This collection of Strategy KPIs is compiled by former McKinsey, BCG, Deloitte, EY, and Capgemini consultants based on best practices in Corporate Strategy and Strategic Management.
This presentation provides a comprehensive set of 800+ Corporate Strategy KPIs to ensure all levels of the organization are aligned with the overarching strategic objectives.
It offers a ready-to-use, extensive collection of KPIs, saving significant time and effort in research and compilation.
The wide range of KPIs allows for tailored selection and customization to fit specific industry needs and organizational goals, enhancing the relevance and impact of strategic initiatives.
GROWTH STRATEGY PPT DESCRIPTION
This product (
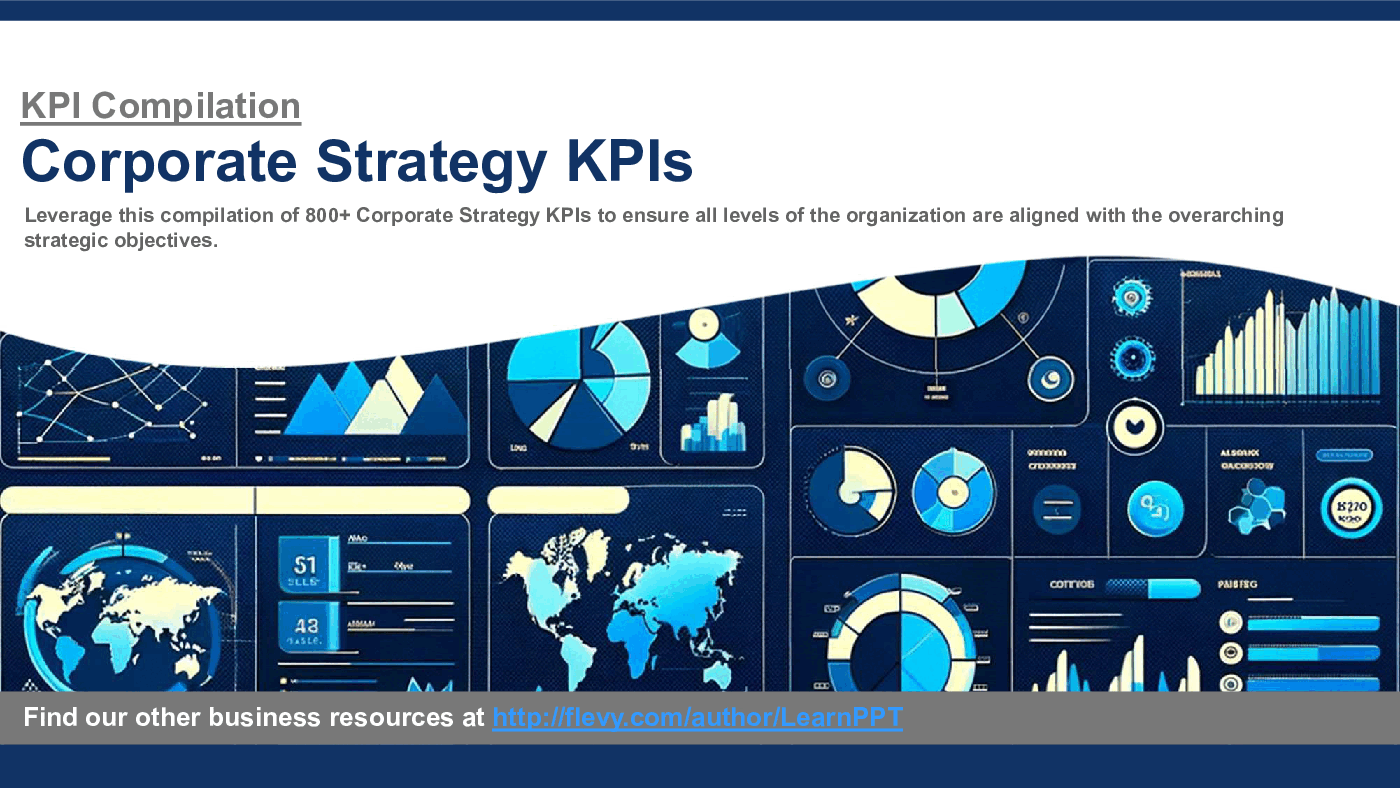
KPI Compilation: 800+ Corporate Strategy KPIs) is a 186-slide PPT PowerPoint presentation slide deck (PPTX), which you can download immediately upon purchase.
This presentation is a comprehensive collection of Key Performance Indicators (KPI) related to Corporate Strategy. A KPI is a quantifiable measure used to evaluate the success of an organization, employee, or process in meeting objectives for performance.
KPIs are typically implemented at various levels within an organization, from the highest strategic level down to individual departments and teams. These Strategy KPIs provide executives with a vast array of data points for making nuanced, strategic decisions.
In total, we have compiled over 800+ Strategy KPIs in this PowerPoint presentation. These KPIs are categorized into the following 19 groups:
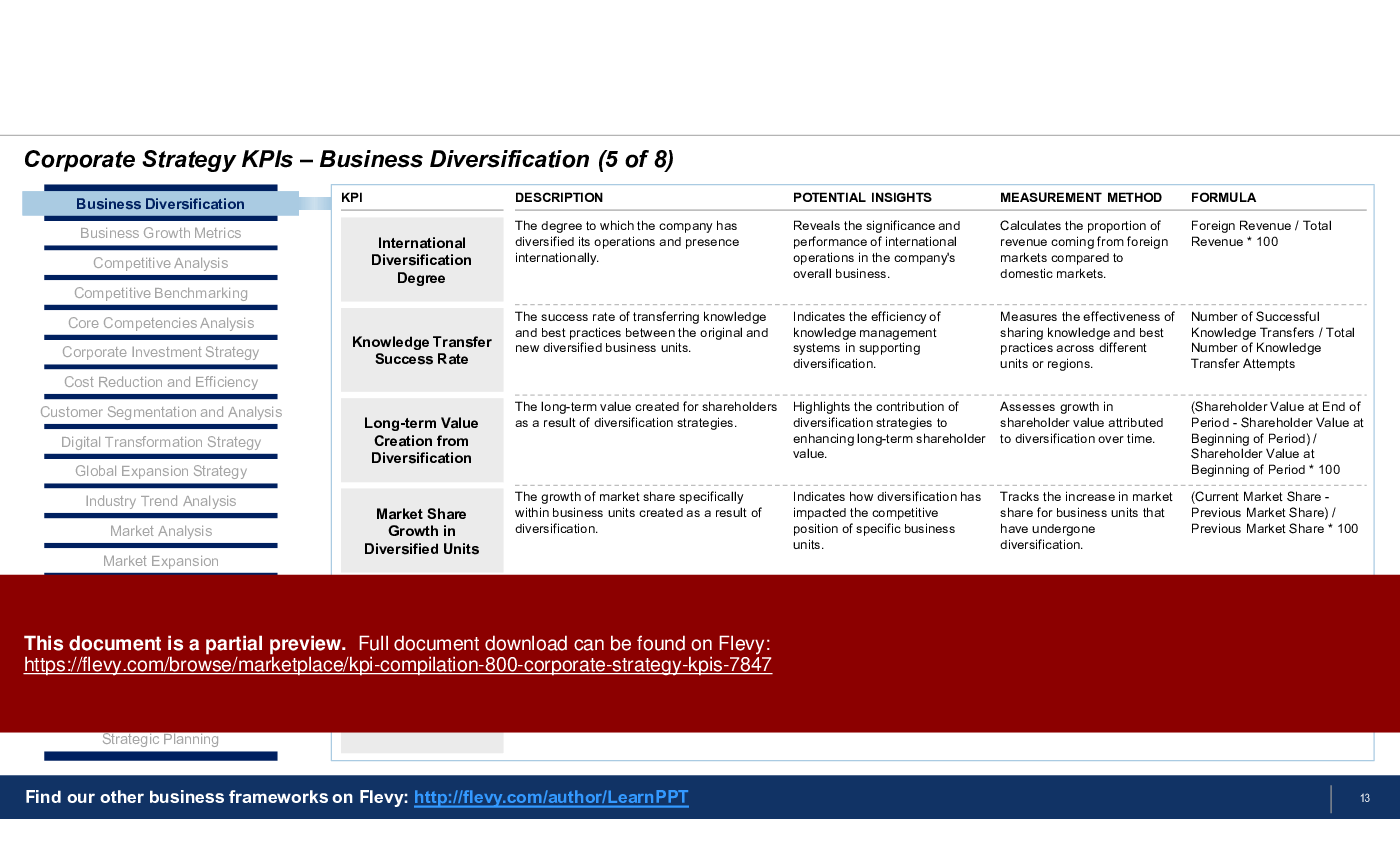
1. Business Diversification – These KPIs enable executives to measure the impact of diversification efforts on risk mitigation and revenue stability across different markets and products.
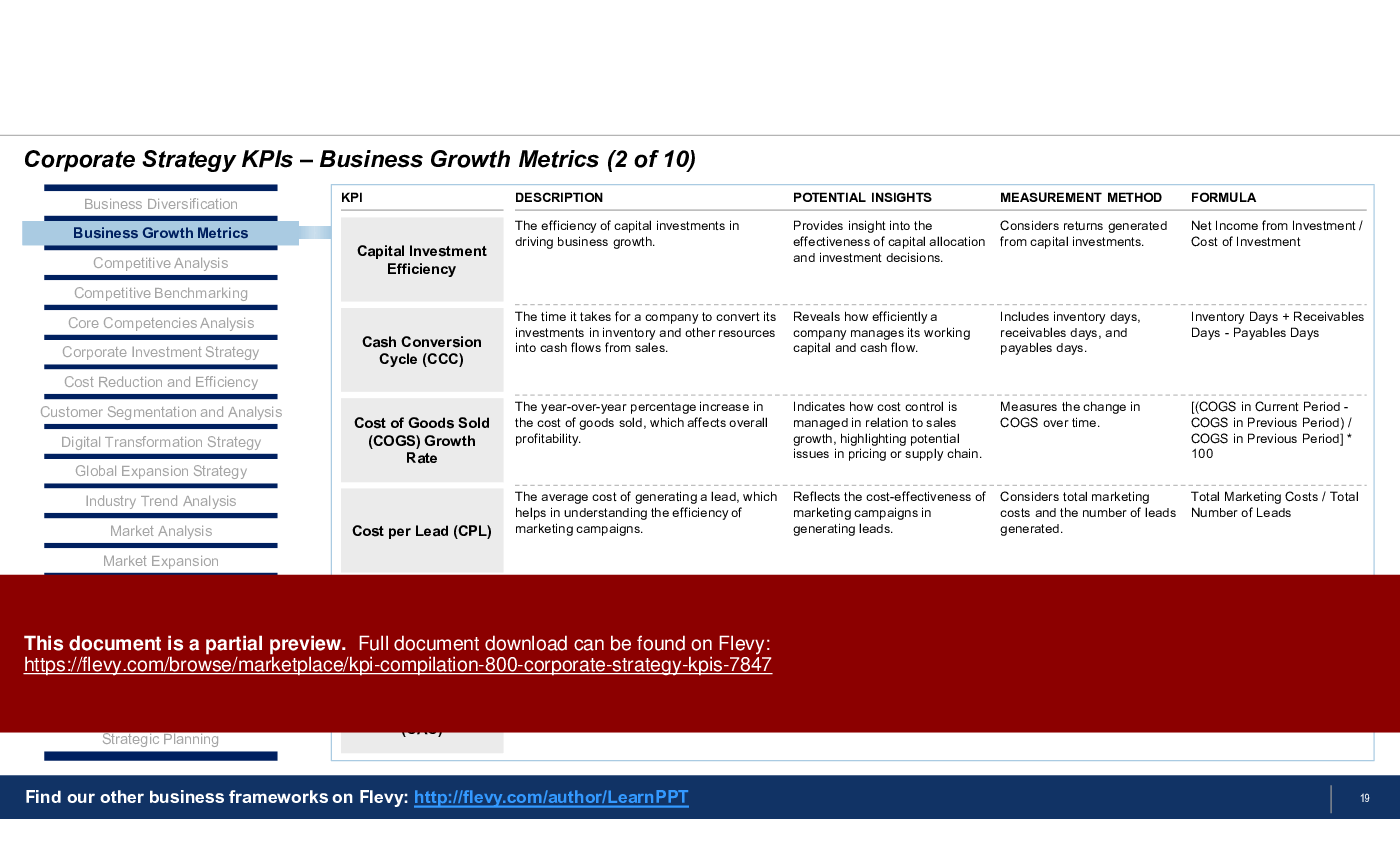
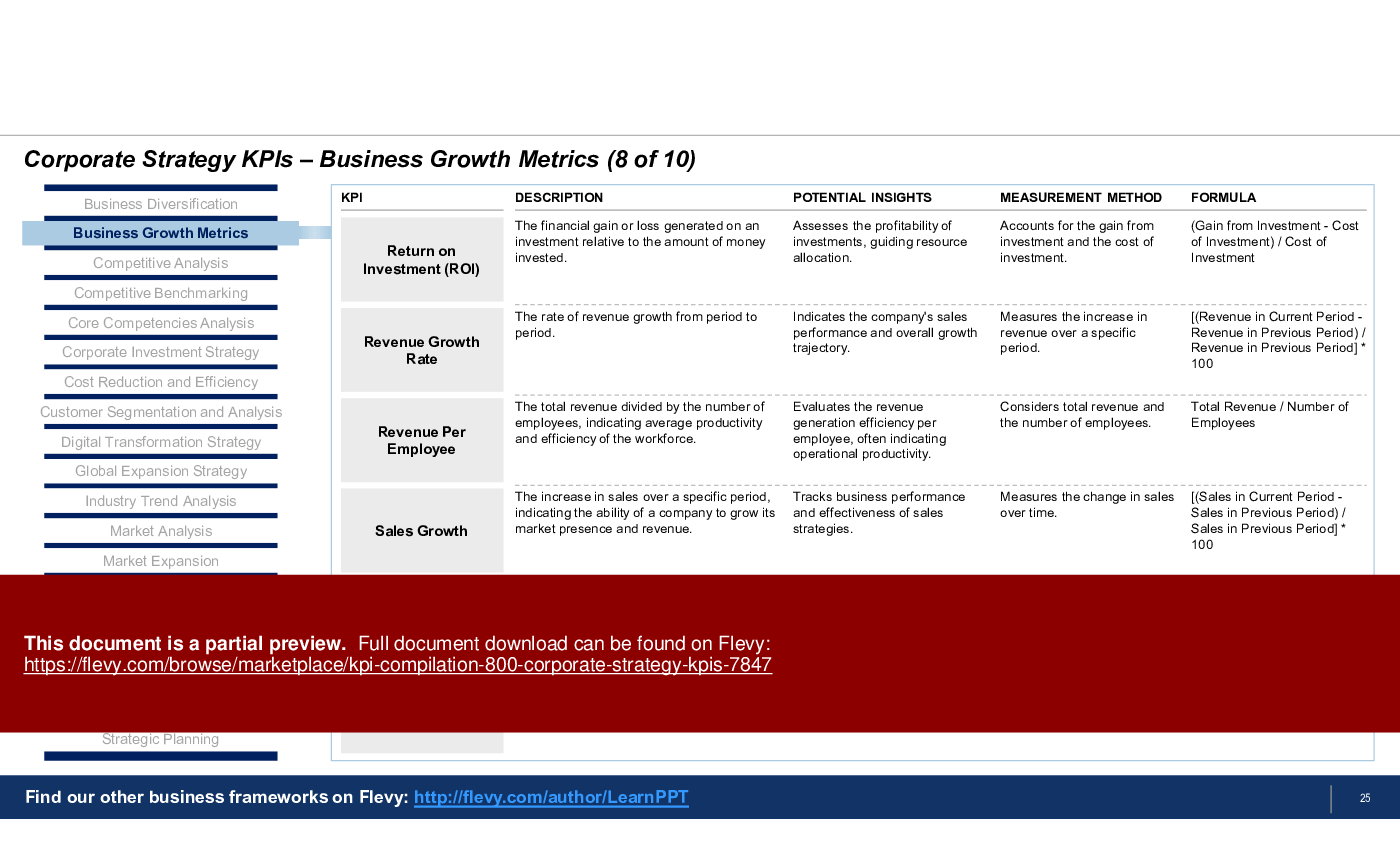
2. Business Growth Metrics – These metrics provide critical insights into the effectiveness of Growth Strategies, enabling leaders to adjust tactics and drive sustainable business expansion.
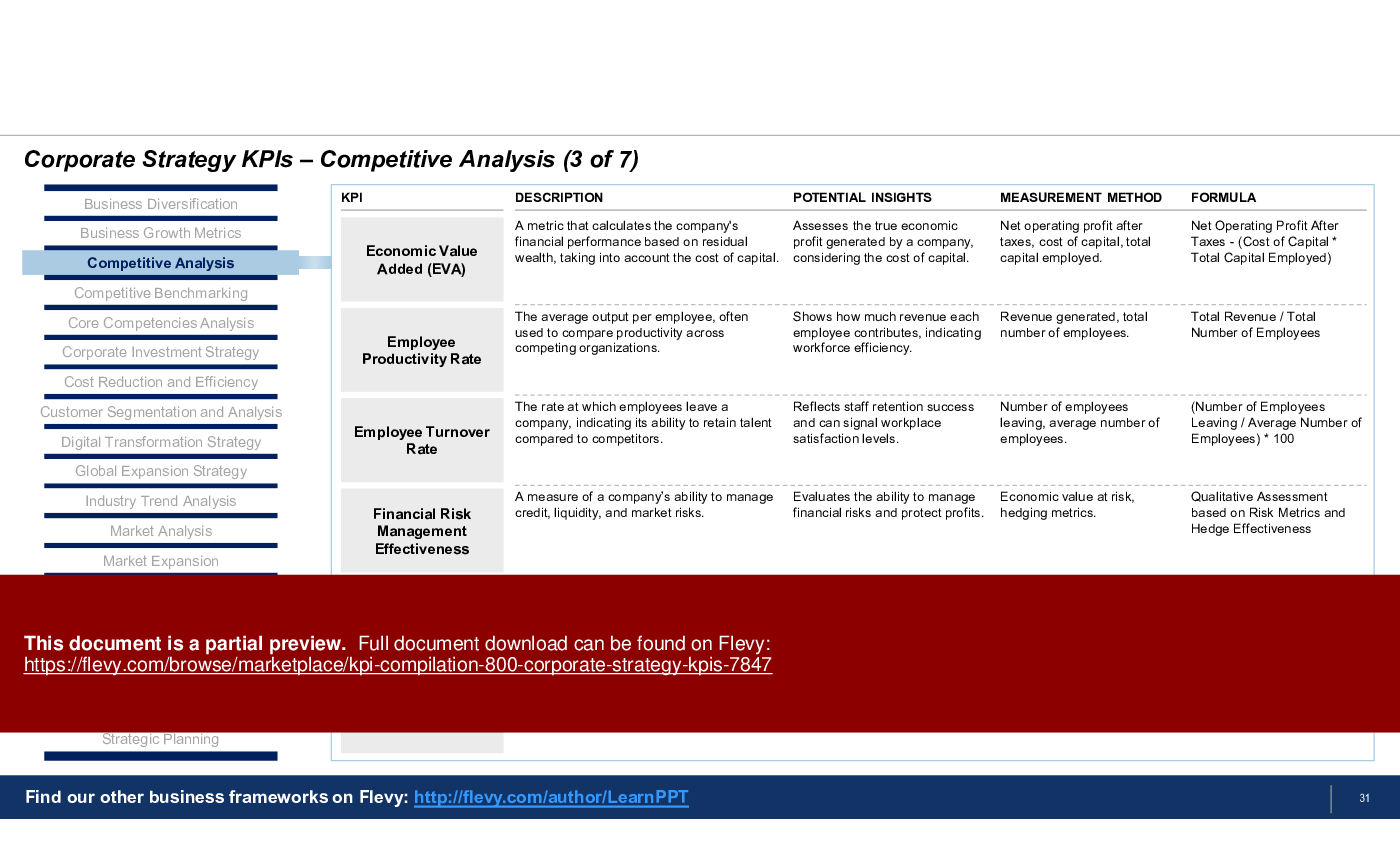
3. Competitive Analysis – KPIs in Competitive Analysis provide leadership with actionable intelligence on where they stand in the marketplace and how to capitalize on competitors' weaknesses.
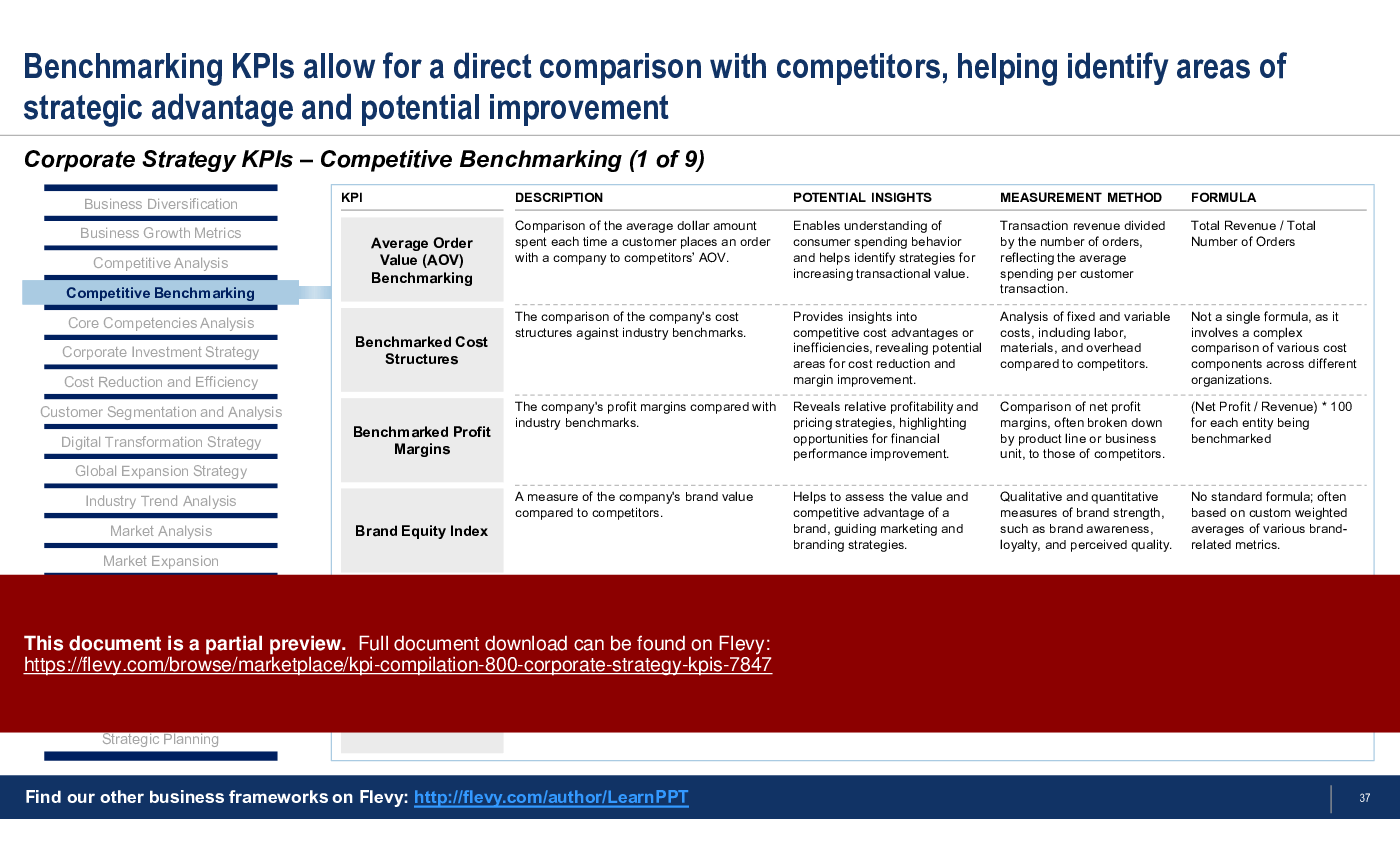
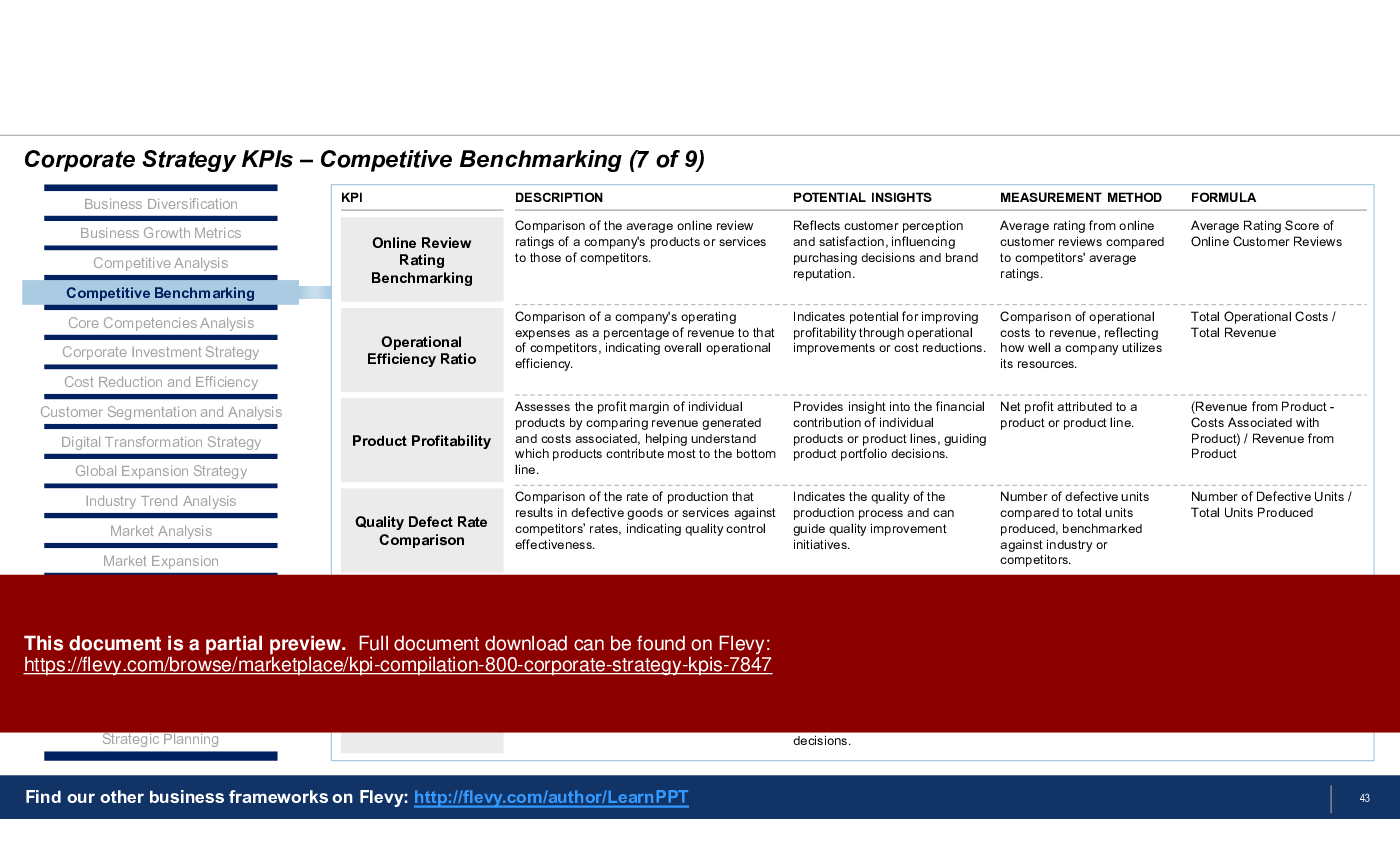
4. Competitive Benchmarking – These KPIs allow for a direct comparison with competitors, helping identify areas of strategic advantage and potential improvement.
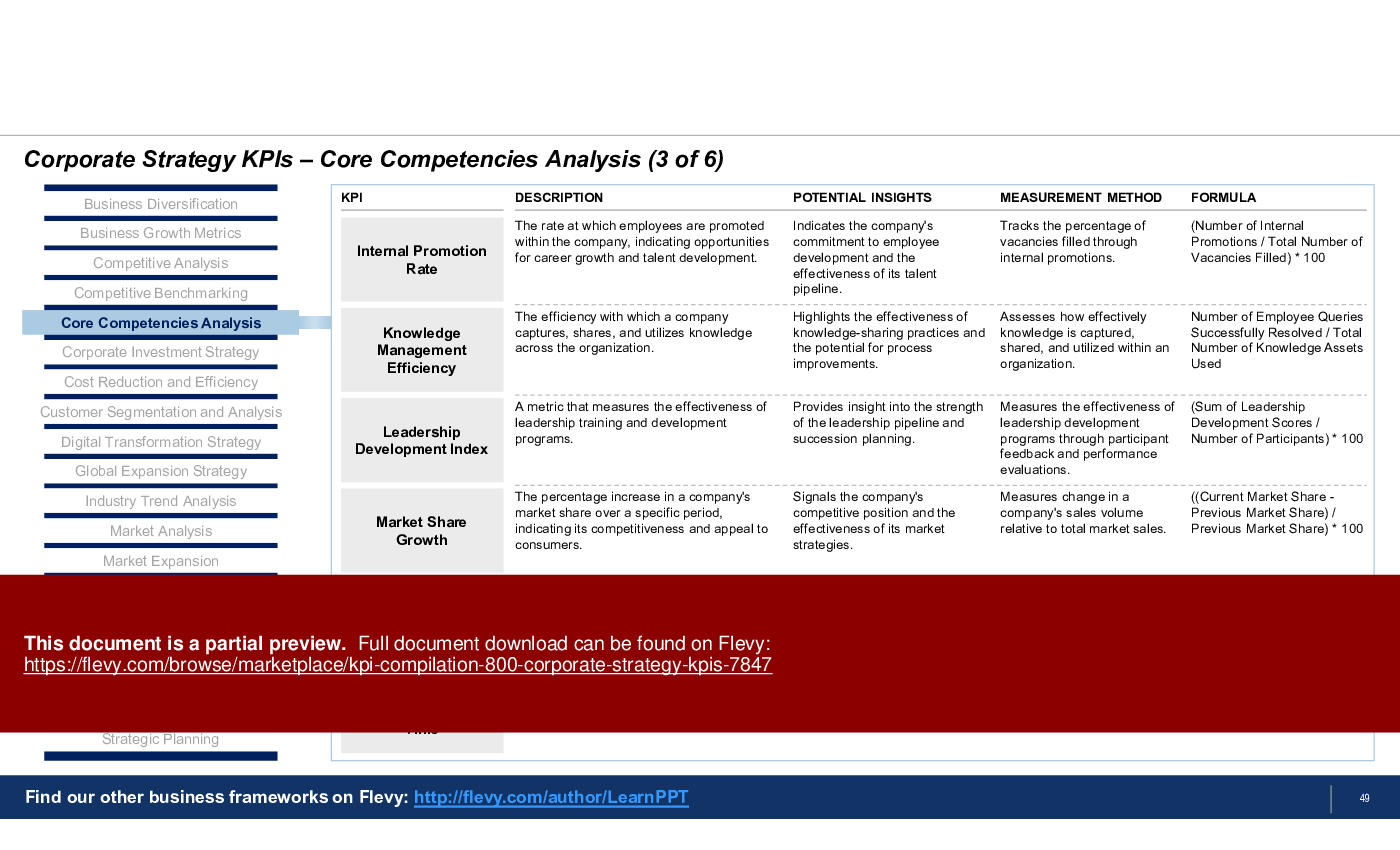
5. Core Competencies Analysis – These KPIs facilitate the identification and strengthening of unique organizational strengths that provide a sustainable Competitive Advantage in the market.
6. Corporate Investment Strategy – Investment-related KPIs offer executives data-driven guidance for optimizing investment portfolios and capital allocation to drive shareholder value.
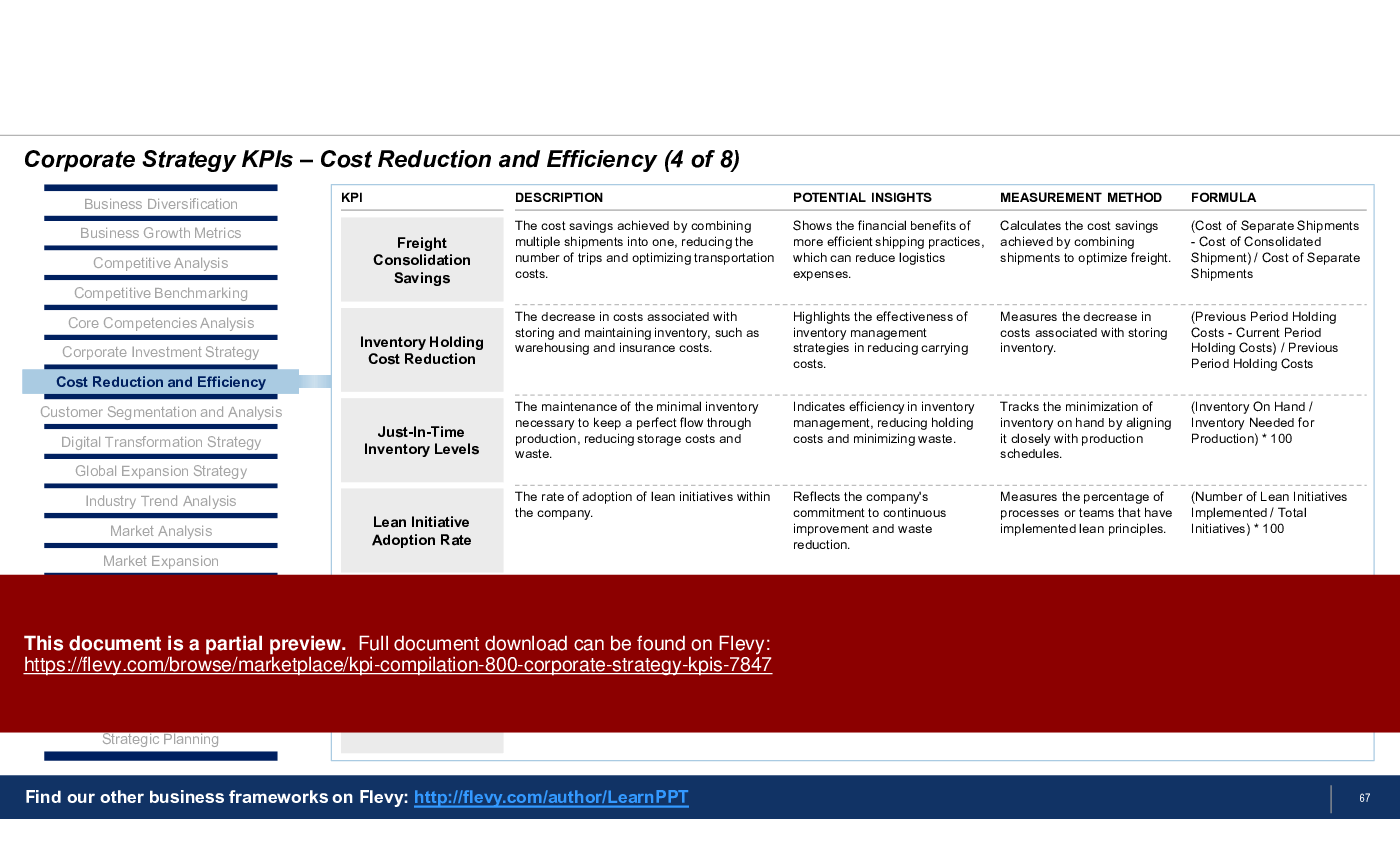
7. Cost Reduction and Efficiency – These KPIs track and quantify efficiency gains and cost savings, ensuring operational adjustments translate into tangible financial improvements.
8. Customer Segmentation and Analysis – These KPIs help in understanding customer demographics and behavior, enabling personalized marketing strategies and product offerings.
9. Digital Transformation Strategy – DX KPIs assess the progress and impact of digital initiatives, ensuring technology investments align with corporate objectives.
10. Global Expansion Strategy – KPIs provide a framework for measuring the success of international ventures, supporting strategic decisions in new and existing global markets.
11. Industry Trend Analysis – Trend-related KPIs equip leaders with foresight into evolving industry dynamics, allowing for timely strategic adjustments.
12. Market Analysis – These KPIs offer insights into market size, share, and potential, guiding data-driven strategies for market penetration and customer acquisition.
13. Market Expansion – Market Expansion KPIs gauge the effectiveness of strategies to enter new markets or increase share in existing ones, helping to drive revenue growth.
14. Merger and Acquisition Strategy – KPIs related to M&A enable executives to measure the success of integrations and the impact on the company's strategic positioning.
15. Portfolio Management – KPIs in portfolio management help executives assess the balance and performance of the company's business units or product lines.
16. Revenue Diversification – These KPIs measure the contribution of different revenue streams, ensuring a balanced and resilient financial structure.
17. Strategic Initiative Progress – These KPIs provide milestones for tracking the implementation and success of strategic initiatives, aligning them with the organization's long-term goals.
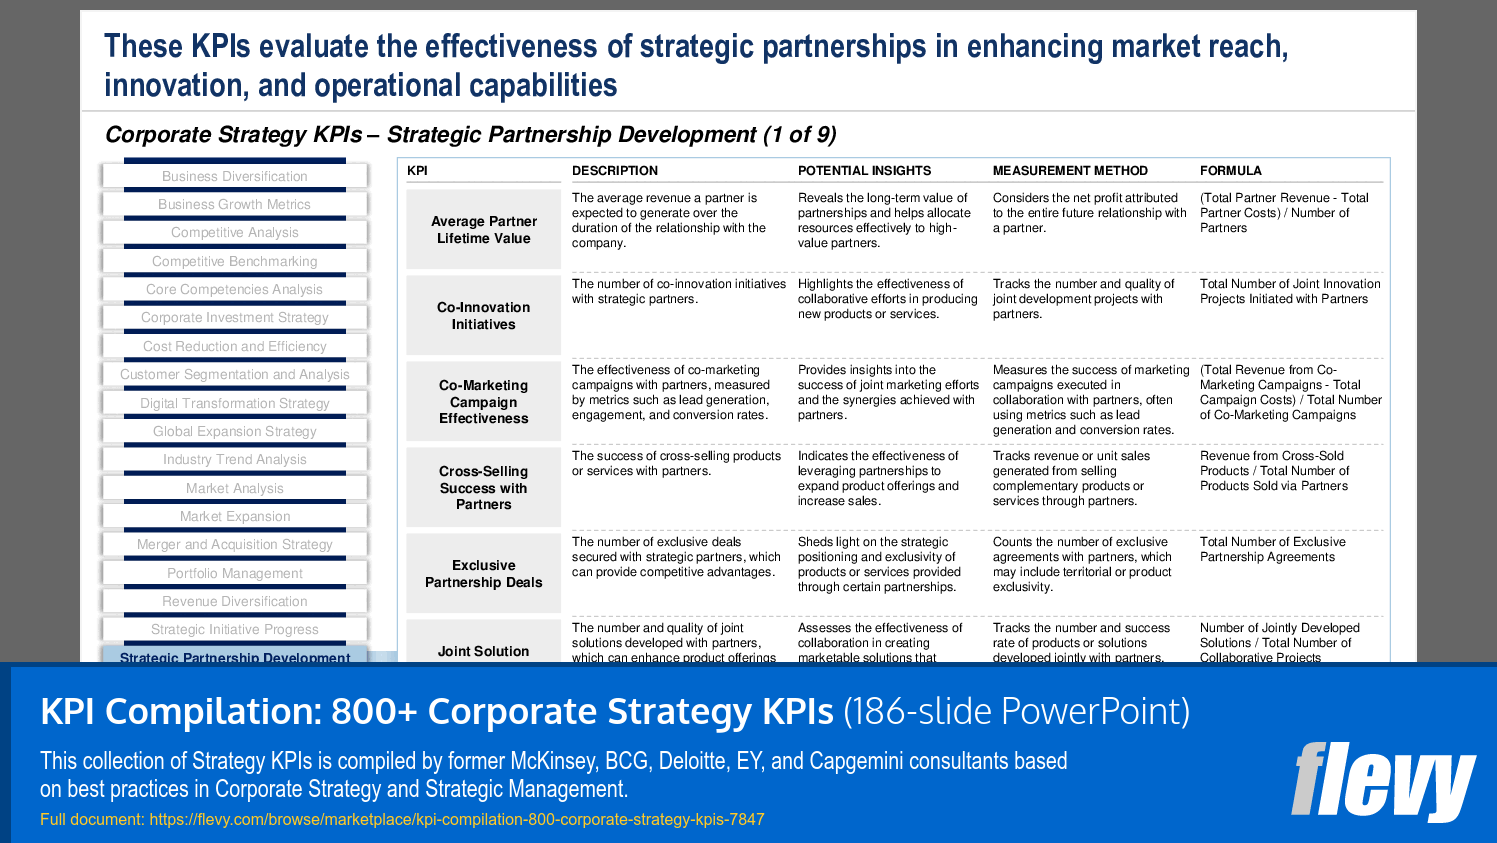
18. Strategic Partnership Development These KPIs evaluate the effectiveness of strategic partnerships in enhancing market reach, innovation, and operational capabilities.
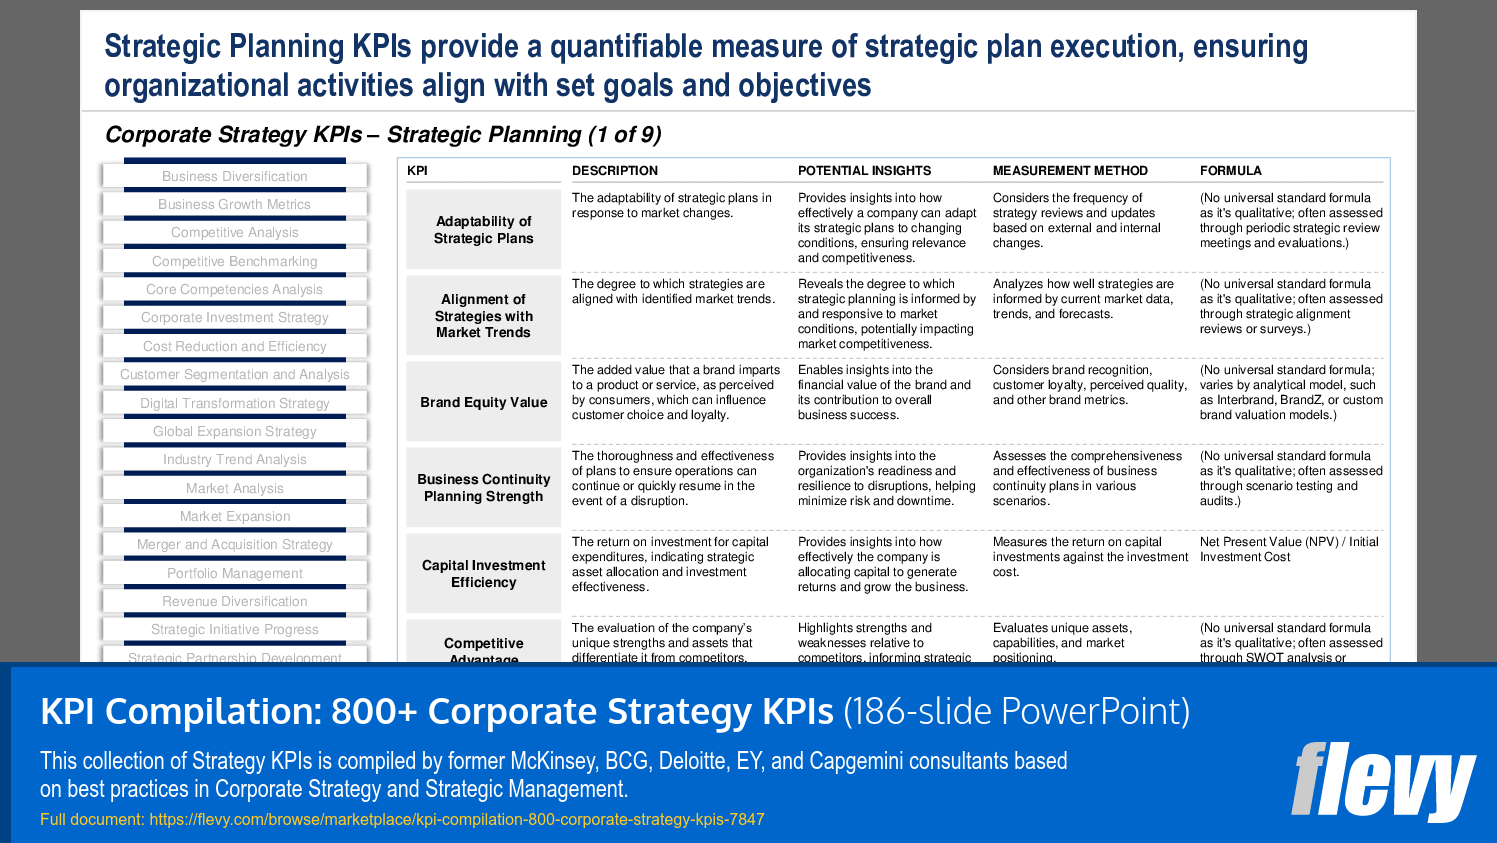
19. Strategic Planning – Lastly, these Strategic Planning KPIs provide a quantifiable measure of strategic plan execution, ensuring organizational activities align with set goals and objectives.
Many Fortune 500 companies engage top management consulting firms, like McKinsey, BCG, and Deloitte, to identify and implement KPIs, acknowledging their critical role in driving performance and strategic alignment, despite the significant investment this process entails.
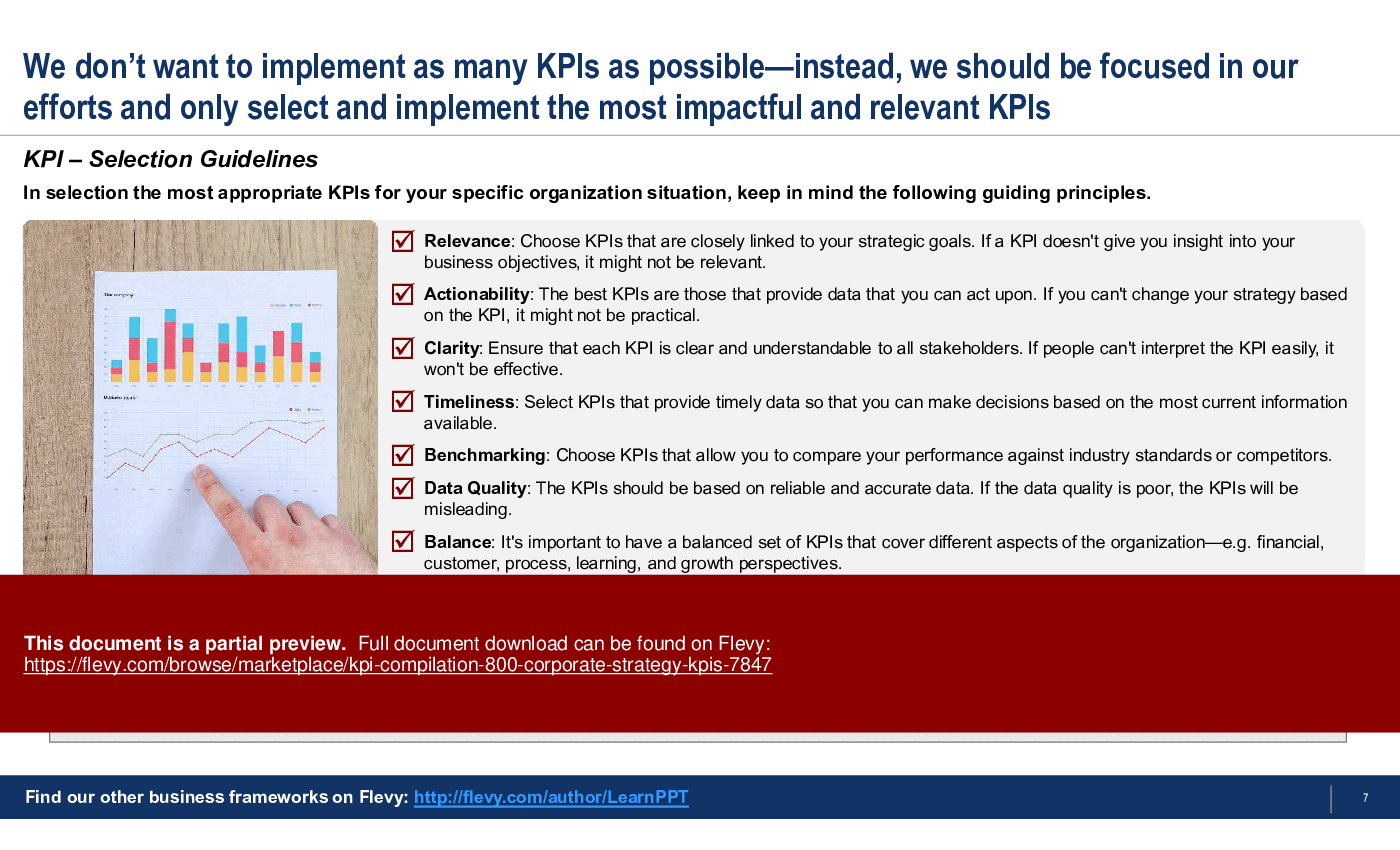
This presentation also includes an introduction on KPIs, covering topics like KPI selection guidelines and common usages.
This PPT provides clear guidelines for selecting the most relevant KPIs tailored to your organization's strategic goals. Each KPI is meticulously detailed with descriptions, potential insights, and measurement methods, ensuring you have the tools to drive informed decision-making.
Got a question about the product? Email us at support@flevy.com or ask the author directly by using the "Ask the Author a Question" form. If you cannot view the preview above this document description, go here to view the large preview instead.
This slide presents a structured framework for evaluating key performance indicators (KPIs) relevant to global expansion strategies. Key metrics include "Brand Recognition in New Markets," measuring consumer awareness and brand strength, essential for market penetration. The "Cross-Border M&A Integration Success Rate" evaluates post-transaction performance, critical for optimizing integration strategies. The "Cross-Cultural Training Completion Rate" assesses employee preparedness for global operations, highlighting the importance of a culturally aware workforce. "Cultural Adaptation Effectiveness" measures how well organizations adjust practices to local customs, influencing long-term success. Additionally, customer acquisition costs in foreign markets are emphasized for assessing profitability, while the "Diverse Market" KPI reveals market diversification and potential risk mitigation. This framework aids executives in making informed strategic decisions regarding global expansion.
This slide provides an overview of Key Performance Indicators (KPIs) for evaluating mergers and acquisitions (M&A). Key metrics include "Acquisition Bid Success Rate," measuring the percentage of successful bids, and "Acquisition Discount Rate," assessing negotiation capabilities. "Acquisition Integration Costs" capture the financial implications of merging operations, while "Acquisition Premium Paid" highlights the additional amount over market value. Metrics like "Acquisition Speed" and "Acquisition Target" offer insights into the efficiency of the acquisition process and target pipeline robustness. These KPIs are essential for executives seeking to enhance M&A strategies through data-driven insights.
This slide outlines key performance indicators (KPIs) for digital transformation strategies in corporate settings. KPIs include "Agile Practice Adoption Rate," measuring the percentage of teams using Agile methodologies, which indicates organizational flexibility and delivery speed. The "AI Integration Level" assesses the extent of artificial intelligence in operations, revealing its impact on efficiency and decision-making. "Cloud Migration Status" tracks cloud adoption progress, highlighting cost savings and scalability. The "Cross-functional Team Collaboration Effectiveness" KPI evaluates team success in achieving project goals, while "Cross-Platform Integration Efficiency" measures the communication between digital platforms, affecting operational efficiency. Lastly, the "Customer Data Platform (CDP)" KPI focuses on customer data management integration in marketing strategies, enhancing customer engagement. This framework enables organizations to measure and improve digital transformation initiatives effectively.
This slide outlines a framework for evaluating key performance indicators (KPIs) related to strategic partnerships. Key KPIs include "Average Partner Lifetime Value," measuring expected revenue from a partner, and "Co-Innovation Initiatives," tracking collaborative projects for new product development. "Co-Marketing Campaign Effectiveness" assesses the success of joint marketing initiatives through metrics like lead generation. The "Cross-Selling Success with Partners" KPI indicates how partnerships enhance product offerings and drive sales. "Exclusive Partnership Deals" evaluates the number of exclusive agreements for strategic advantages, while "Joint Solution Development" measures the effectiveness of collaborative projects in creating marketable solutions. These KPIs provide actionable insights for partnership development and management.
This slide outlines Key Performance Indicators (KPIs) for cost reduction and efficiency in corporate strategy. Key KPIs include Automation Return on Investment, Average Cost per Unit Reduction, Budget Variance, Business Process Outsourcing (BPO) Savings, Capacity Utilization Rate, and Capital Expenditure.
Automation Return on Investment evaluates financial benefits from automation technologies, while Average Cost per Unit Reduction measures production cost management and potential efficiencies. Budget Variance compares actual spending to budgeted figures, identifying overspending or underperformance. BPO Savings quantifies financial advantages of outsourcing non-core processes. Capacity Utilization Rate assesses production capacity efficiency, informing operational decisions. Capital Expenditure focuses on managing long-term investments related to asset acquisition and maintenance.
These KPIs guide decision-making and strategic planning for enhancing operational efficiency and achieving financial results.
This slide provides an overview of key performance indicators (KPIs) for business growth metrics. Average Revenue Per User (ARPU) measures revenue per customer, essential for revenue efficiency and forecasting. Brand Equity evaluates the value of a recognizable brand versus generic alternatives, impacting marketing strategy. The Brand Loyalty Index indicates customer loyalty levels, predicting long-term revenue potential, while the Brand Recognition Ratio assesses brand visibility in target markets, reflecting marketing effectiveness. Break-even Time shows how long it takes to recover initial investments, crucial for financial planning. Capacity Utilization measures production efficiency, guiding operational decisions. These KPIs offer actionable insights for leaders to refine strategies and drive sustainable business expansion.
This slide outlines key performance indicators (KPIs) for strategic planning, including adaptability of strategic plans, alignment with market trends, brand equity value, business continuity planning strength, capital investment efficiency, and competitive advantage. Adaptability measures a company's ability to adjust strategies based on market changes, while alignment assesses how well strategies reflect current market data. Insights from these KPIs inform decision-making, such as how brand equity affects consumer loyalty and financial performance. Measurement methods include qualitative assessments and quantitative formulas like net present value for capital investment efficiency. This structured approach enhances the evaluation of strategic initiatives and identifies areas for improvement.
This slide outlines key performance indicators (KPIs) for core competencies analysis in corporate strategy. "Brand Recognition" measures brand visibility in target markets, reflecting marketing effectiveness through consumer surveys. The "Cost Leadership Index" evaluates a company's ability to provide lower-cost products while maintaining quality, essential for understanding cost structures. "Cultural Alignment Degree" assesses the fit between employee values and company culture, impacting engagement and retention. "Customer Lifetime Value Growth" indicates expected revenue from a customer over time, vital for customer relationship management. Additional KPIs include "Customer Retention Rate," measuring loyalty, and the "Customer Satisfaction Index," gauging customer happiness and improvement areas. These metrics enable organizations to enhance strategic decision-making and operational efficiency.
This collection of Strategy KPIs is compiled by former McKinsey, BCG, Deloitte, EY, and Capgemini consultants based on best practices in Corporate Strategy and Strategic Management.
We are a team of management consultants trained by top tier global consulting firms (including McKinsey, BCG, Deloitte, EY, Capgemini) with a collective experience of several decades. We specialize in business frameworks based on real-life consulting engagements.
We have served 100s of clients that range from Fortune 500 companies to tech startups to
... [read more] $1B+ private companies.
Utilize our consulting frameworks to apply structured thinking & analysis to address your business challenges, uncover strategic insights, and implement workable solutions. Our PowerPoint presentations follow traditional consulting slide design formats, starting with a clear slide headline. Easily customize and repurpose our slides for your own business presentations.
Beyond business frameworks & methodologies, we also offer PowerPoint templates and other business templates. Our templates are professionally designed and have been used in thousands of deliverables & work products across hundreds of clients.
Need KPIs or benchmarks?Explore KPI Depot to access the most comprehensive database of KPI data, organized by function and industry.
Trusted by over 10,000+ Client Organizations
Since 2012, we have provided best practices to over 10,000 businesses and organizations of all sizes, from startups and small businesses to the Fortune 100, in over 130 countries.
Read Customer Testimonials
"I like your product. I'm frequently designing PowerPoint presentations for my company and your product has given me so many great ideas on the use of charts, layouts, tools, and frameworks. I really think the templates are a valuable asset to the job."
– Roberto Fuentes Martinez, Senior Executive Director at Technology Transformation Advisory
"If you are looking for great resources to save time with your business presentations, Flevy is truly a value-added resource. Flevy has done all the work for you and we will continue to utilize Flevy as a source to extract up-to-date information and data for our virtual and onsite presentations!"
– Debbi Saffo, President at The NiKhar Group
"Flevy is now a part of my business routine. I visit Flevy at least 3 times each month.
Flevy has become my preferred learning source, because what it provides is practical, current, and useful in this era where the business world is being rewritten.
many challenges and there is the need to make the right decisions in a short time, with so much scattered information, we are fortunate to have Flevy. Flevy investigates, selects, and puts at our disposal the best of the best to help us be successful in our work.
"
– Omar Hernán Montes Parra, CEO at Quantum SFE
"As an Independent Management Consultant, I find Flevy to add great value as a source of best practices, templates and information on new trends. Flevy has matured and the quality and quantity of the library is excellent. Lastly the price charged is reasonable, creating a win-win value for
the customer, Flevy and the various authors. This is truly a service that benefits the consulting industry and associated clients. Thanks for providing this service.
"
– Jim Schoen, Principal at FRC Group
"As a small business owner, the resource material available from FlevyPro has proven to be invaluable. The ability to search for material on demand based our project events and client requirements was great for me and proved very beneficial to my clients. Importantly, being able to easily edit and tailor
the material for specific purposes helped us to make presentations, knowledge sharing, and toolkit development, which formed part of the overall program collateral. While FlevyPro contains resource material that any consultancy, project or delivery firm must have, it is an essential part of a small firm or independent consultant's toolbox.
"
– Michael Duff, Managing Director at Change Strategy (UK)
"I have used Flevy services for a number of years and have never, ever been disappointed. As a matter of fact, David and his team continue, time after time, to impress me with their willingness to assist and in the real sense of the word. I have concluded in fact
that it is not at all just a repository of documents/resources but, in the way that David and his team manage the firm, it is like dealing with consultants always ready to assist, advise and direct you to what you really need, and they always get it right.
I am an international hospitality accomplished senior executive who has worked and lived during the past 35 years in 23 countries in 5 continents and I can humbly say that I know what customer service is, trust me.
Aside from the great and professional service that Flevy's team provide, their wide variety of material is of utmost great quality, professionally put together and most current.
Well done Flevy, keep up the great work and I look forward to continue working with you in the future and to recommend you to a variety of colleagues around the world.
"
– Roberto Pelliccia, Senior Executive in International Hospitality
"FlevyPro has been a brilliant resource for me, as an independent growth consultant, to access a vast knowledge bank of presentations to support my work with clients. In terms of RoI, the value I received from the very first presentation I downloaded paid for my subscription many times over! The
quality of the decks available allows me to punch way above my weight – it's like having the resources of a Big 4 consultancy at your fingertips at a microscopic fraction of the overhead.
"
– Roderick Cameron, Founding Partner at SGFE Ltd
"My FlevyPro subscription provides me with the most popular frameworks and decks in demand in today’s market. They not only augment my existing consulting and coaching offerings and delivery, but also keep me abreast of the latest trends, inspire new products and service offerings for my practice, and educate me
Download our free compilation of 50+ Strategy & Transformation slides and templates. Frameworks include McKinsey 7-S, Balanced Scorecard, Disruptive Innovation, BCG Curve, and many more.