DESCRIPTION
Learning how to visually present data is essential for anyone who wants to effectively communicate information through slides.
We all have a plethora of different charts at our disposal. Selecting the right chart for the right type of data is critical to communicating efficiently and accurately, which leads to improved decision making. Choosing the wrong type of visualization can easily lead to people misinterpreting the data. Sometimes what seems intuitive and clear to the slide designer may not be the case for the audience.
It's important to understand the science of when to use what chart and why. This series of presentations breaks down this info for the most commonly used charts and visualizations.
Got a question about the product? Email us at support@flevy.com or ask the author directly by using the "Ask the Author a Question" form.
Source: Visual Presentation of Data - Full Series () Document, LearnPPT Consulting
THERE ARE 6 PRODUCTS IN THIS BUNDLE:
|
|
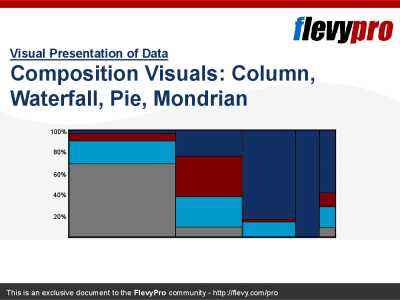
This presentation focuses on Composition visuals: e.g., 100% Column Charts, Waterfall Charts, Mondrian (AKA Marimekko) Graphs, Pie Charts.
The PPT provides a comprehensive... [read more]
Individual Price: $29.00
|
|
|
This presentation focuses on Correlation visuals: X-Y Scatterplots, Paired Bar/Column Charts, Bubble Charts, Radar Diagrams.
Unlock the power of data visualization with our... [read more]
Individual Price: $29.00
|
|
|
This presentation focuses on Frequency Distribution visuals: e.g., Histograms (Columnar and Step), Combination of Curve and Column, Range Charts.
Dive deeper into the nuances... [read more]
Individual Price: $29.00
|
|
|
This presentation focuses on Item Comparison visuals: e.g., Bar Charts, Stacked Column/Bar Charts.
This PPT provides a comprehensive guide on using bar charts and stacked... [read more]
Individual Price: $29.00
|
|
|
This presentation focuses on Rating visuals: Opportunity Prioritization Charts, Booz Balls.
This PPT provides a comprehensive guide on utilizing Opportunity Prioritization... [read more]
Individual Price: $29.00
|
|
|
This presentation focuses on Time Series visuals: e.g., Line Charts, Column Charts, Area (AKA Surface) Charts, Line-Columns Combination Charts.
This deck provides a... [read more]
Individual Price: $29.00
|
ABOUT THE AUTHOR
We are a team of management consultants trained by top tier global consulting firms (including McKinsey, BCG, Deloitte, EY, Capgemini) with a collective experience of several decades. We specialize in business frameworks based on real-life consulting engagements.
We have served 100s of clients that range from Fortune 500 companies to tech startups to
... [read more]
Ask the Author a Question
You must be logged in to contact the author.
