
 Click main image to view in full screen. Unlock all 14 preview images:
Vertically Integrated Cannabis Operations Model – Excel XLSX
Excel (XLSX)


BENEFITS OF THIS DOWNLOADABLE EXCEL DOCUMENT
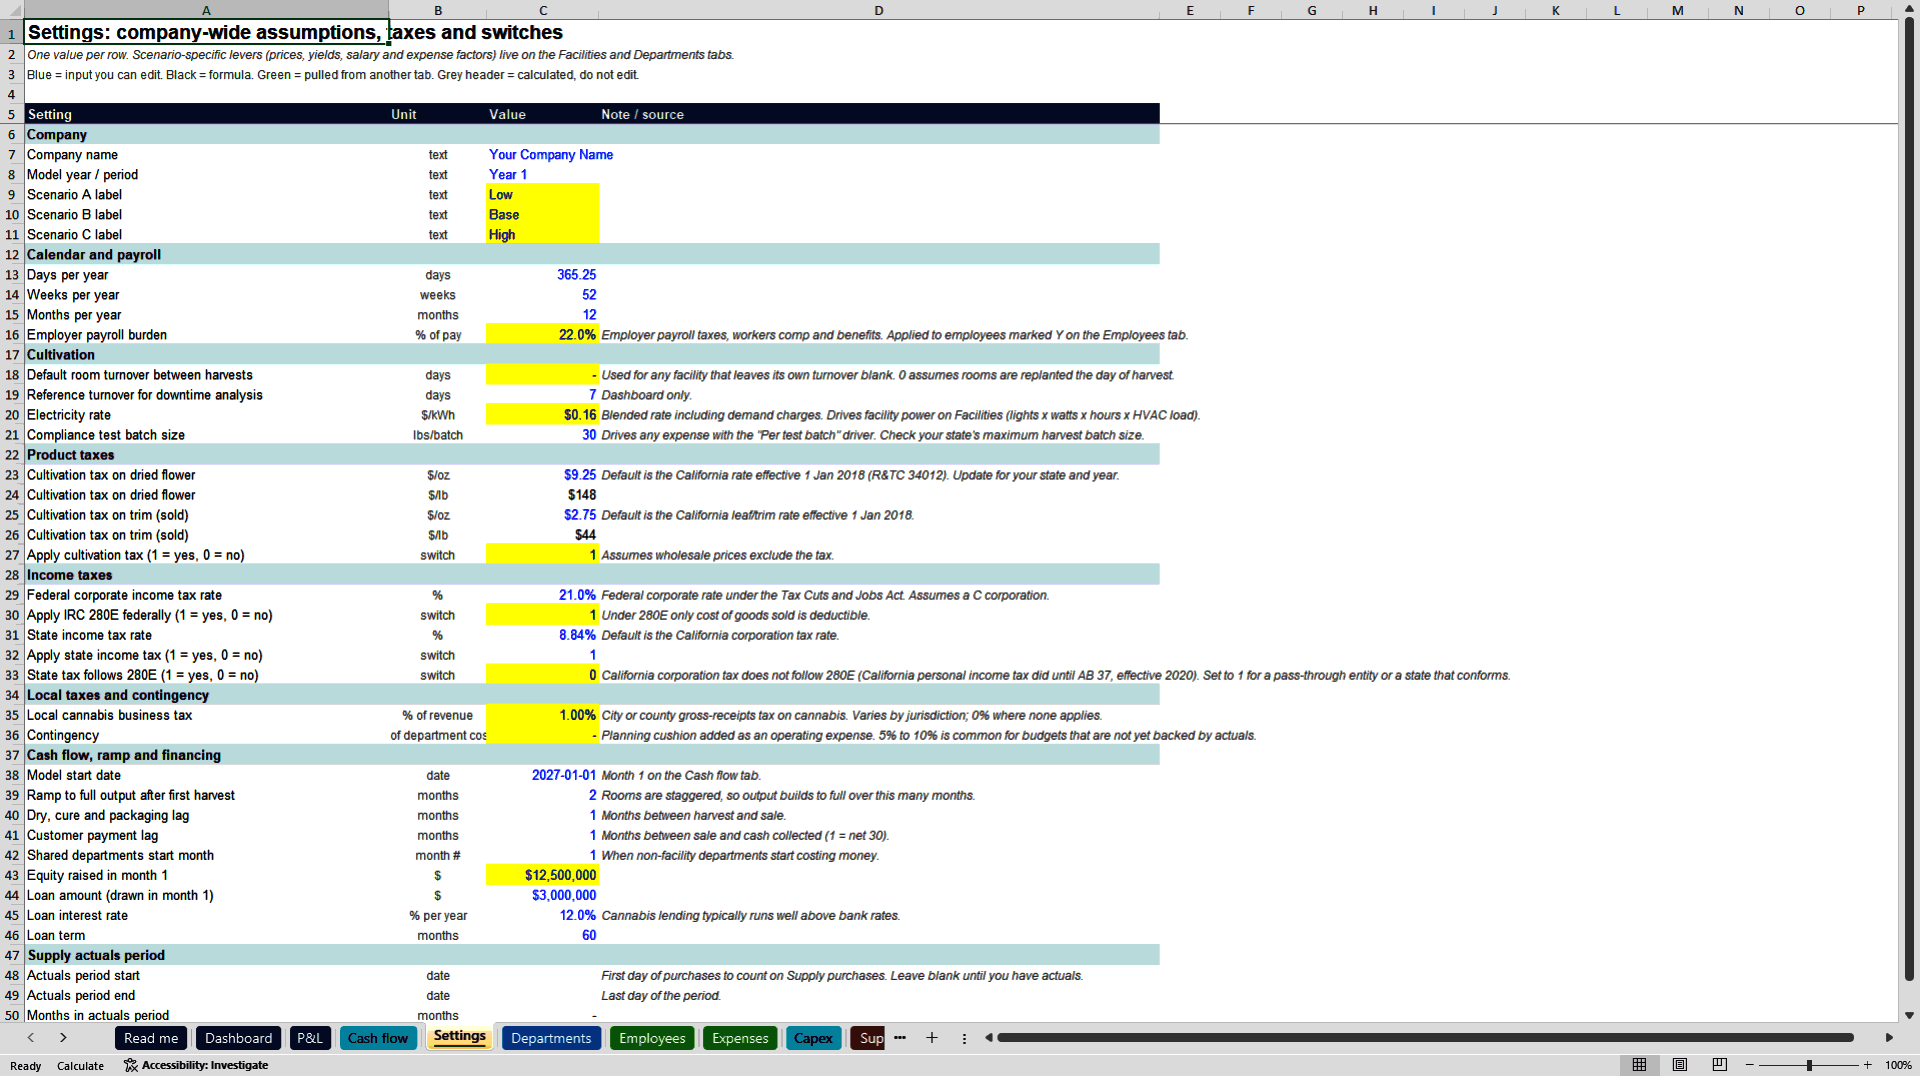
- See exactly how much extra tax IRC 280E costs you under Low, Base and High scenarios.
- Know your all-in cost per pound and the breakeven flower price for every scenario.
- Plan peak funding need with a 36-month ramp that follows each facility to first harvest.
VALUE CHAIN ANALYSIS EXCEL DESCRIPTION
A three-scenario operating model for a vertically integrated cannabis business. It covers cultivation sites, a nursery, a clone and tissue culture lab, packaging, distribution, marketing and G&A, with cultivation tax, IRC 280E and state income tax built in. The workbook has 19 tabs and 41,012 formulas, and a fresh recalculation shows no formula errors.
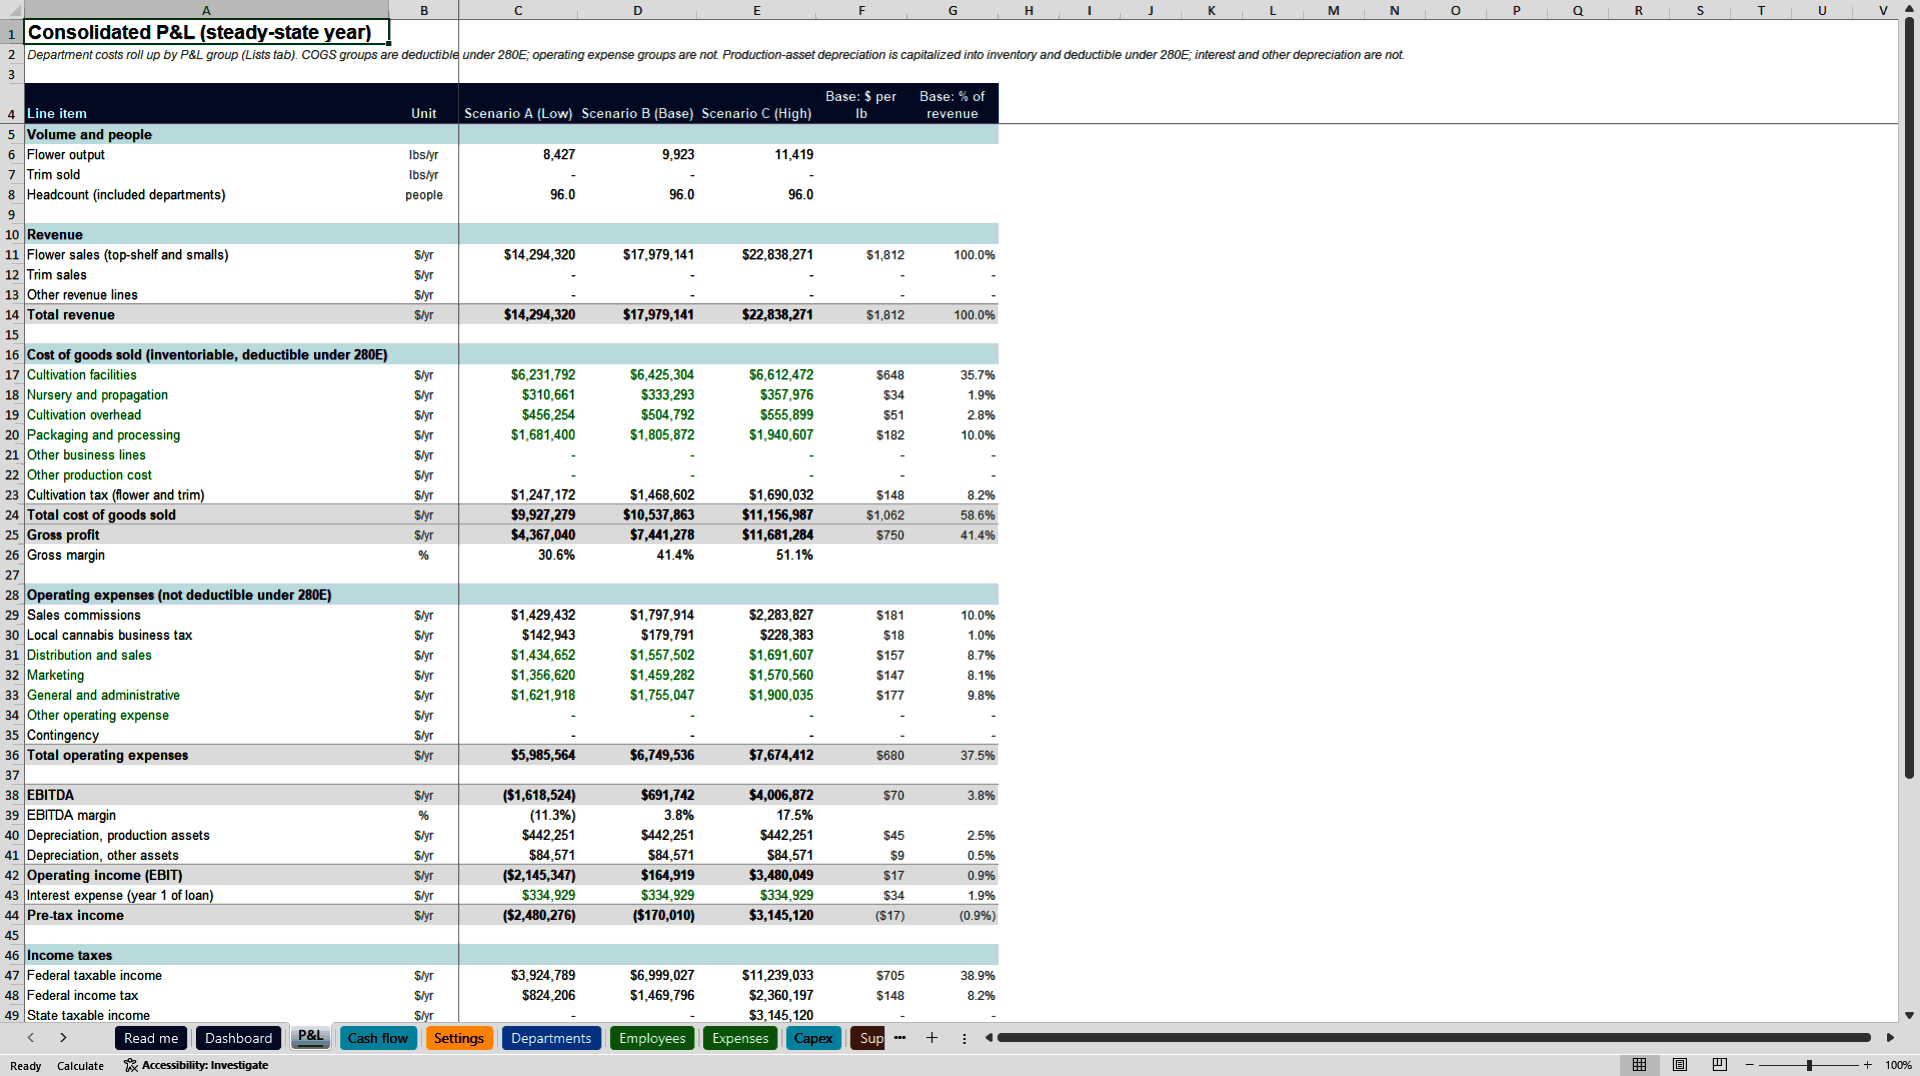
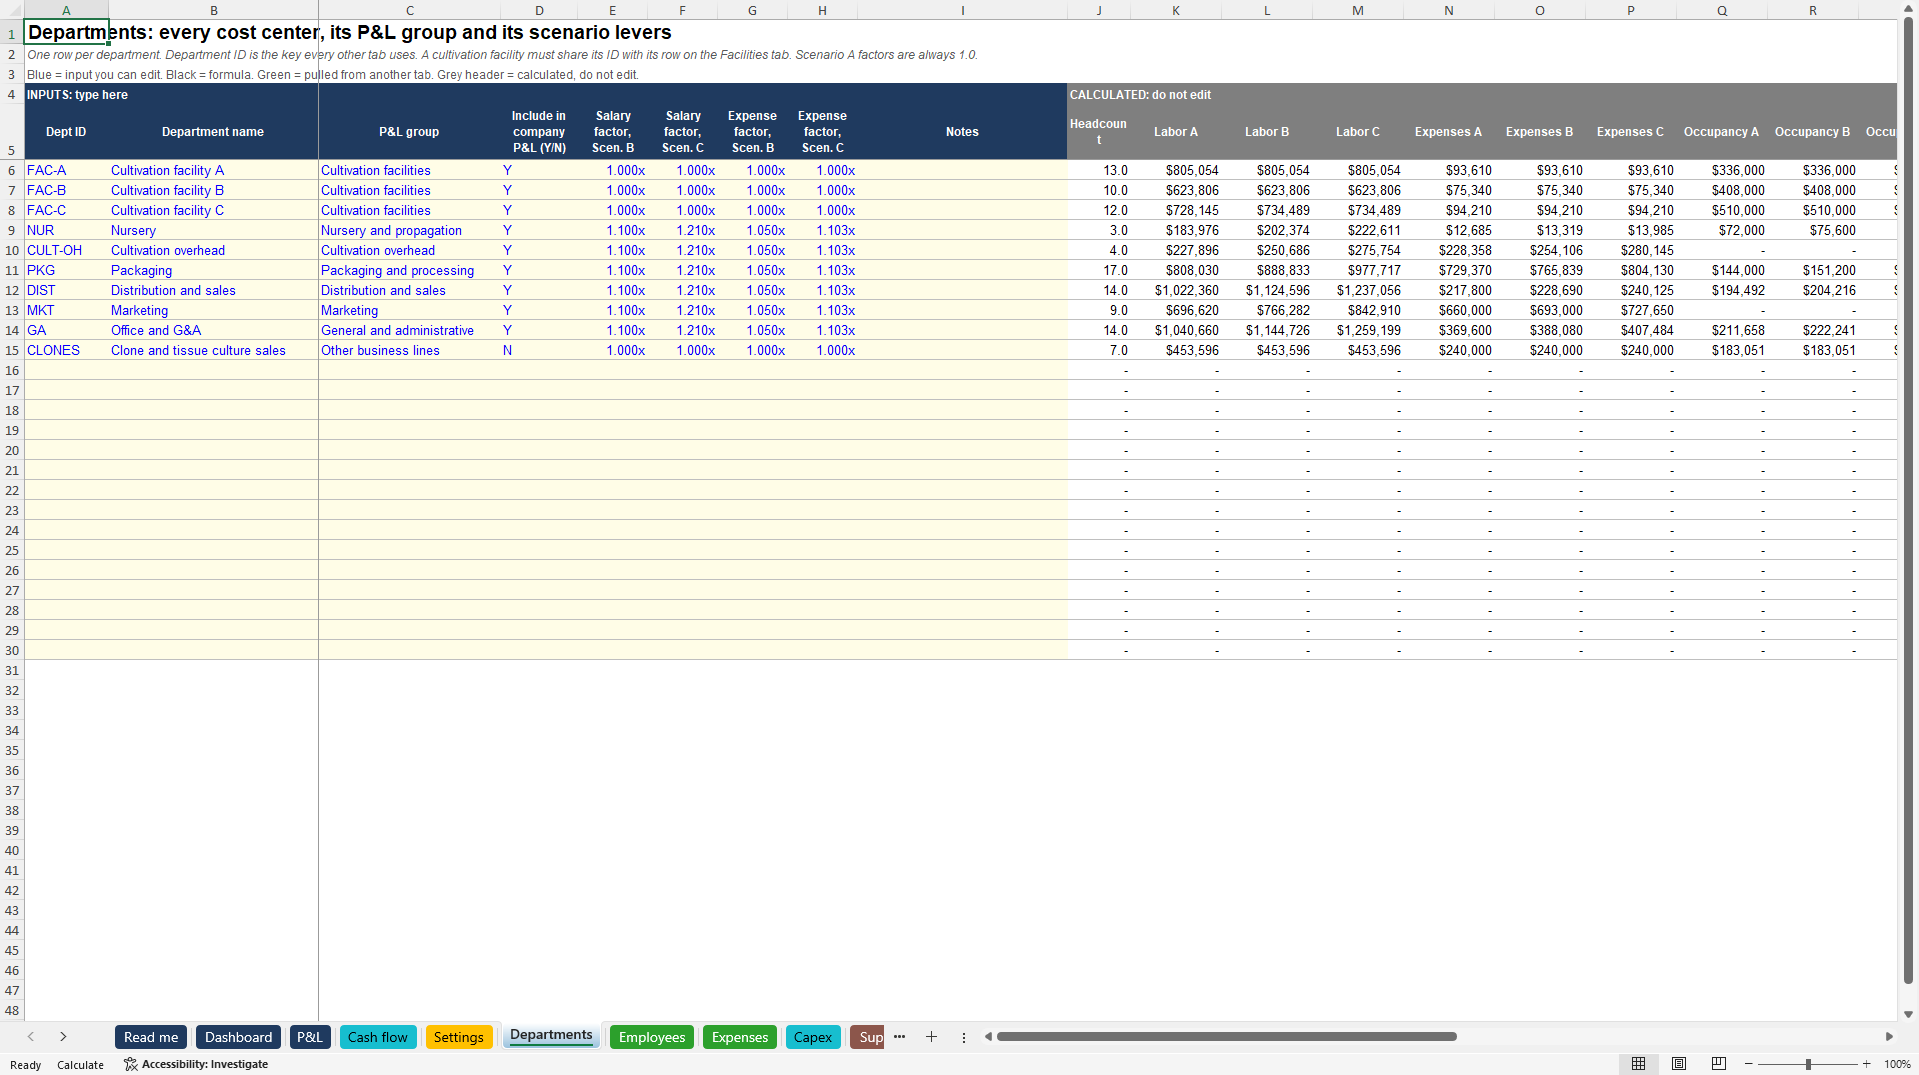
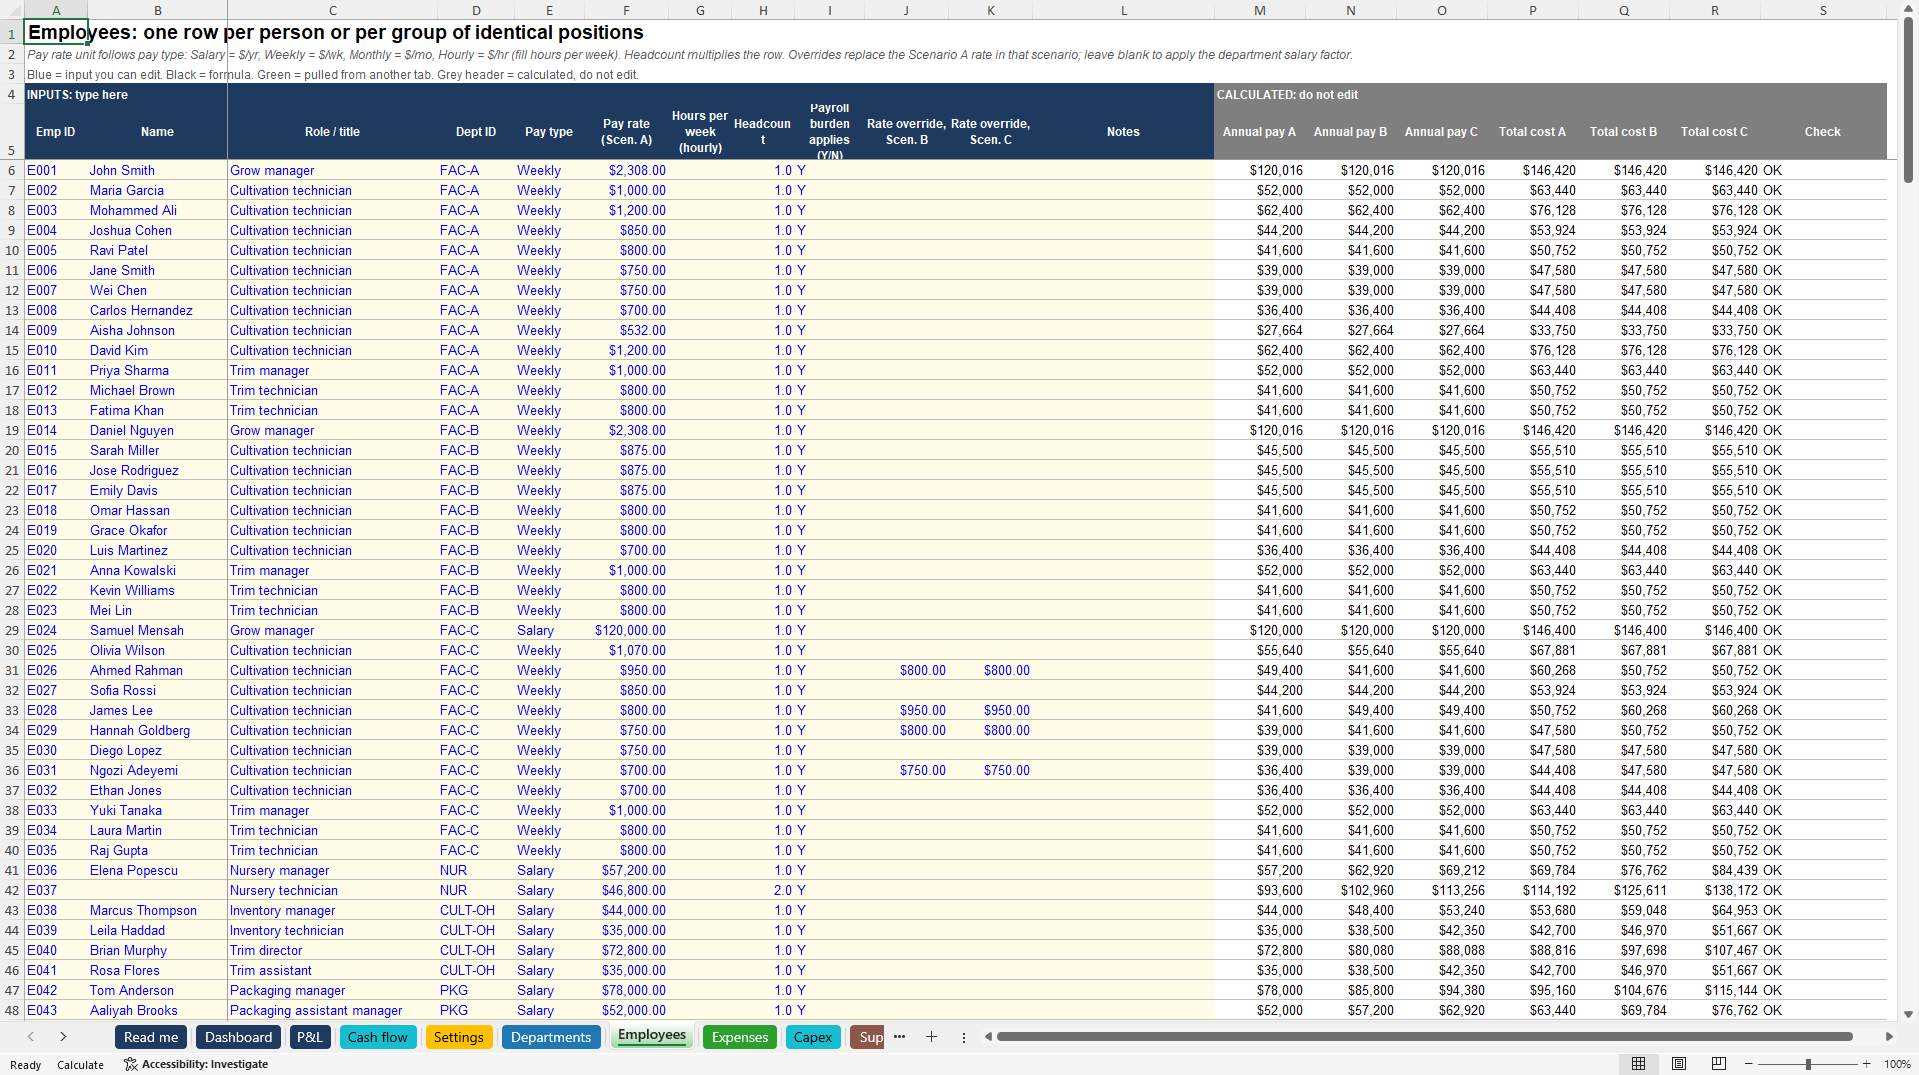
The structure is simple to operate. You type only on the data tabs, in blue cells. Every employee, expense, supply item, capex line and facility carries a department ID, and the calculation tabs roll everything up by that ID into ten P&L groups. Groups one to six are cost of goods sold, which stays deductible under 280E. Groups seven to ten are operating expense, which does not. Nothing on the Dashboard or the P&L is typed in by hand.
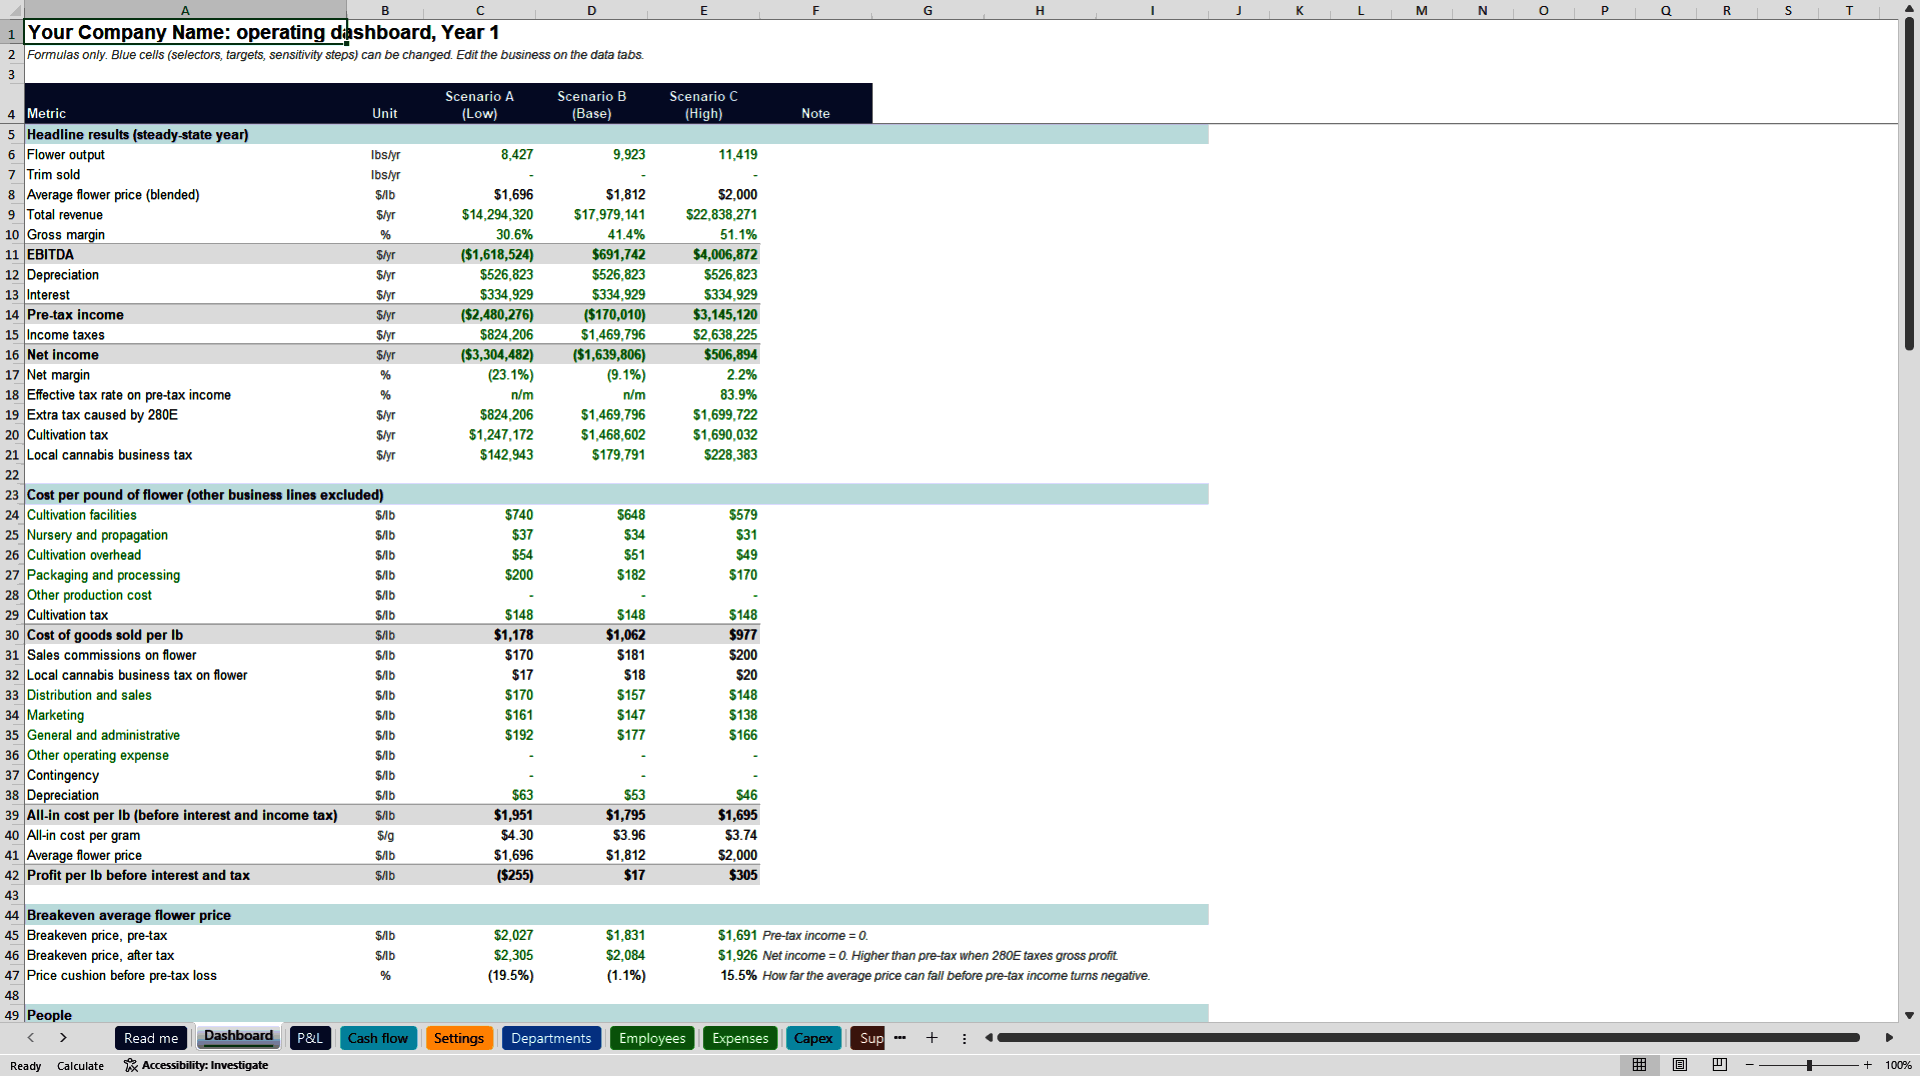
The Dashboard shows Low, Base and High scenarios side by side: flower output, blended price, revenue, gross margin, EBITDA, net income, the extra tax that 280E causes, cost per pound and per gram by P&L group, and the breakeven flower price before and after tax. It also carries canopy benchmarks in grams per watt and grams per square foot, a facility comparison, a price and yield sensitivity grid, and the EBITDA cost of room downtime.
The Facilities tab holds one row per grow: rooms, lights, plants, canopy, watts, light hours and HVAC load, which drive electricity, plus harvest cycle, turnover, trim cost, commission, and top-shelf price and yield by scenario. Supply costs can come from an itemised build-up of about twenty categories (nutrients, media, IPM, CO2, compliance tags, propagation and more) or from an invoice log of actual purchases, chosen per department. A harvest log can replace estimated yields with logged ones.
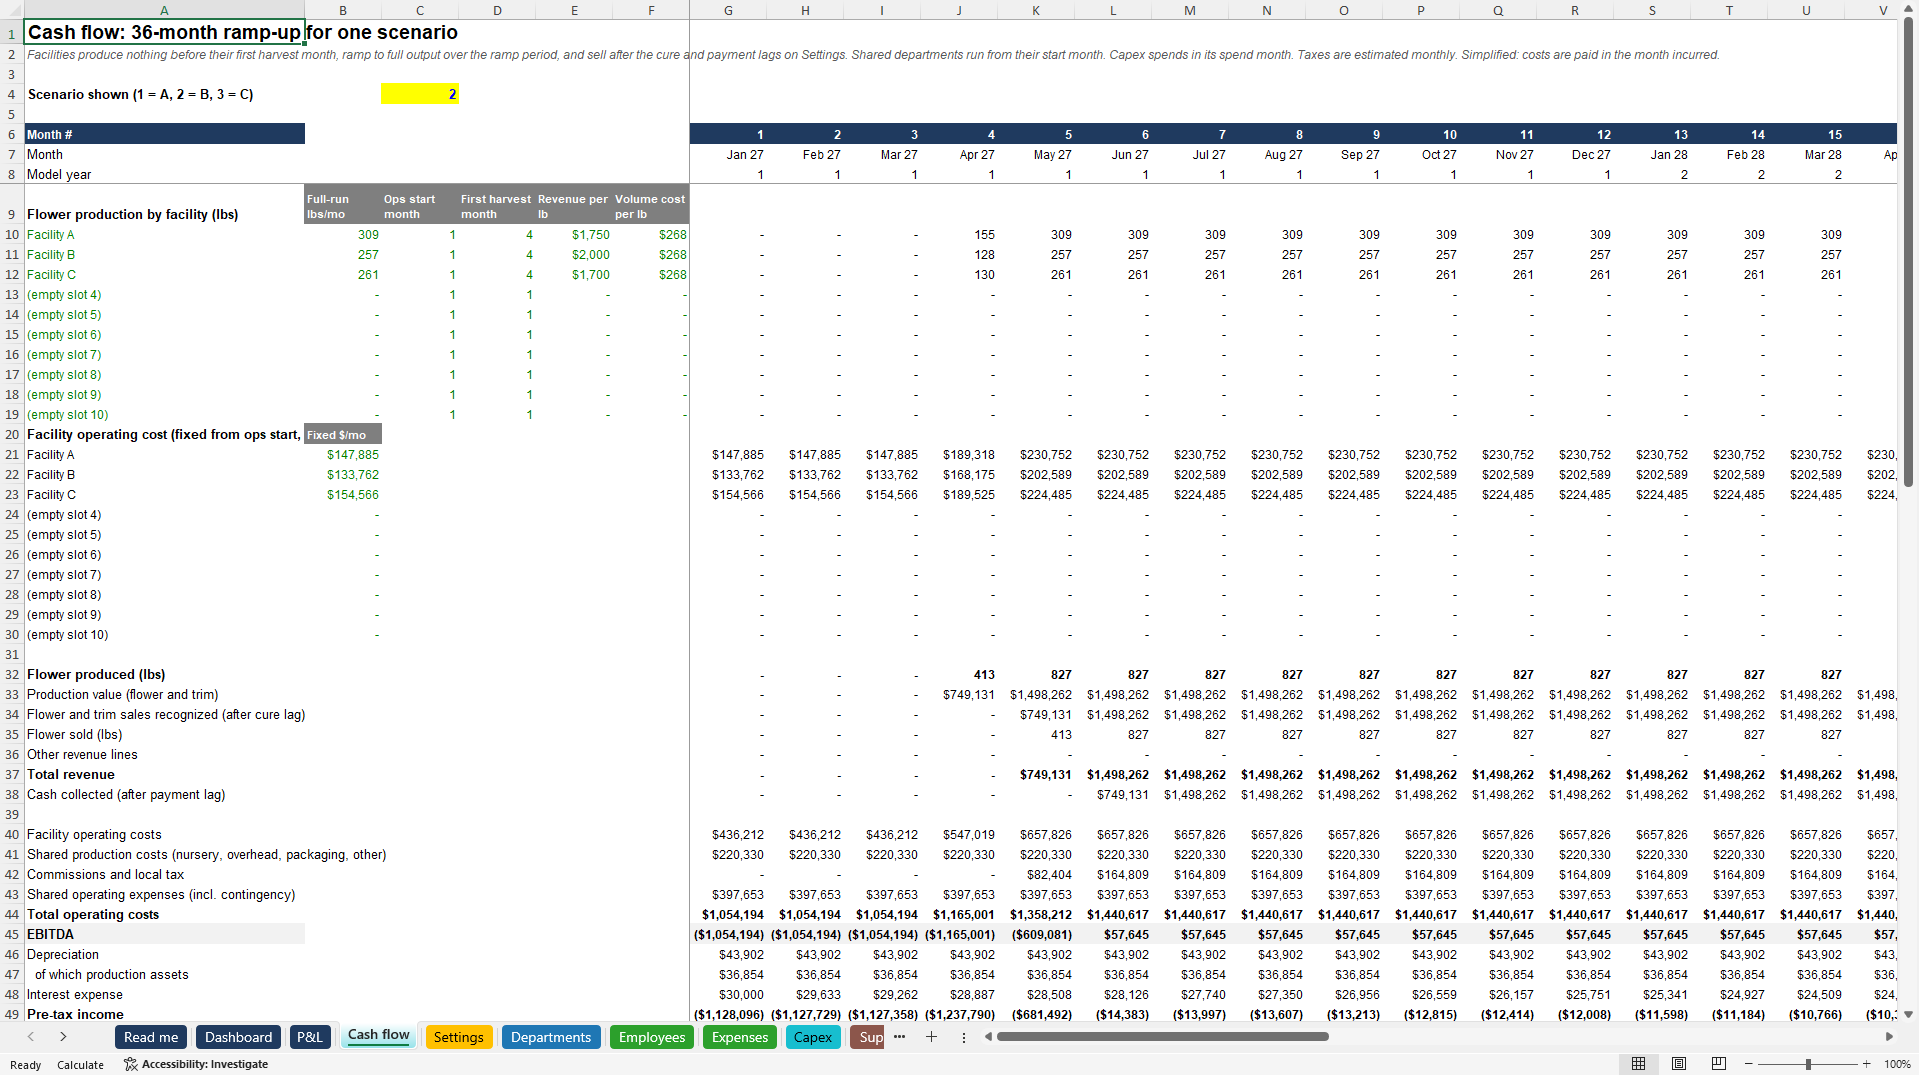
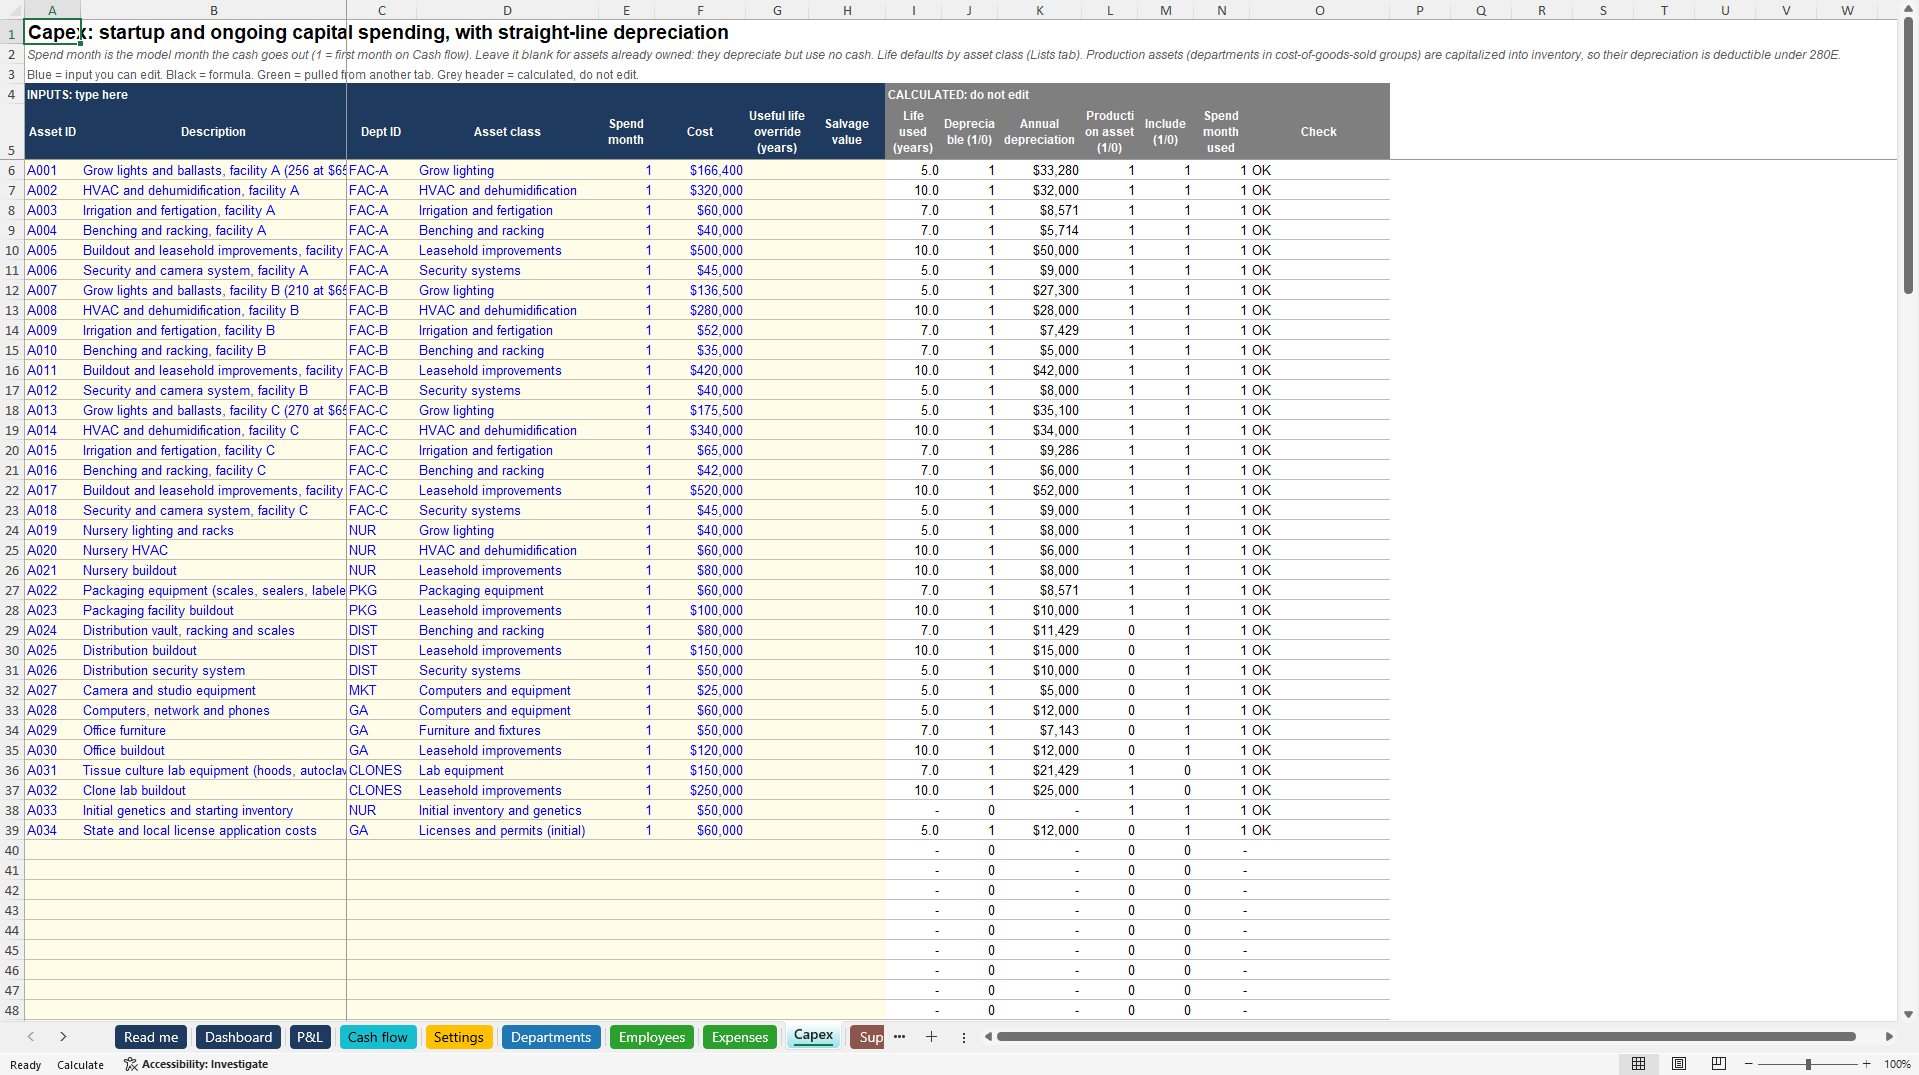
The Cash flow tab runs a 36-month ramp for the scenario you choose. Facilities start, reach first harvest and ramp to full output on their own schedules, sales lag harvest by the cure period, and cash lags sales by payment terms. It includes capex with straight-line depreciation, equity, a loan schedule, monthly tax estimates, peak funding need and a simplified year-end balance sheet. Rent and building bills are entered once per location and split across departments by square feet or percent.
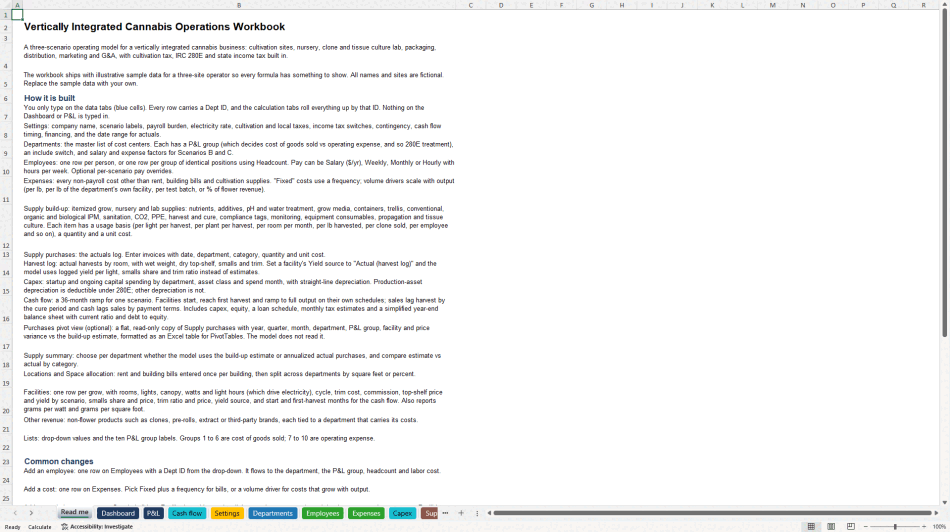
The file ships with illustrative data for a fictional three-site operator so every formula has something to show, and a Read me tab explains each common change, such as adding a grow, a product line or an employee. Tax defaults follow California and every rate is a labelled input. Thirteen built-in data checks flag problem rows. Every cell is unlocked, with no macros and no passwords. Results are planning estimates, not tax, legal or accounting advice.
Got a question about the product? Email us at support@flevy.com or ask the author directly by using the "Ask the Author a Question" form. If you cannot view the preview above this document description, go here to view the large preview instead.
Source: Best Practices in Value Chain Analysis, Integrated Financial Model Excel: Vertically Integrated Cannabis Operations Model Excel (XLSX) Spreadsheet, ModelStack
ABOUT THE AUTHOR

ModelStack builds Excel financial models and business documents for finance, M&A, investment banking, consulting and venture teams.
Every model is formula-transparent. Cells are unlocked, there are no macros and no hidden logic, and each workbook carries a dedicated Checks tab of integrity tests that prove the balance sheet balances and the roll-forwards tie before you rely on a number. Models
... [read more]
Ask the Author a Question
You must be logged in to contact the author.




























