
 Click main image to view in full screen. Unlock all 9 preview images:
Trucking Owner-Operator and Small Fleet Financial Model – Excel XLSX
Excel (XLSX) + supplemental PDF


BENEFITS OF THIS DOWNLOADABLE EXCEL DOCUMENT
- Build revenue by the mile, with deadhead reducing loaded miles while fixed costs keep running.
- Read your cash break-even cost per loaded mile against the market rate on a live gauge.
- Switch the whole cost stack between dry van, reefer and hot shot work with one toggle.
TRANSPORTATION EXCEL DESCRIPTION
An owner-operator does not get paid a flat monthly number. They get paid the gap between the rate they book and what it costs them to turn a mile. Most trucking templates ask for a guessed monthly revenue, or track last month's expenses backwards. This model builds the operation by the mile instead.
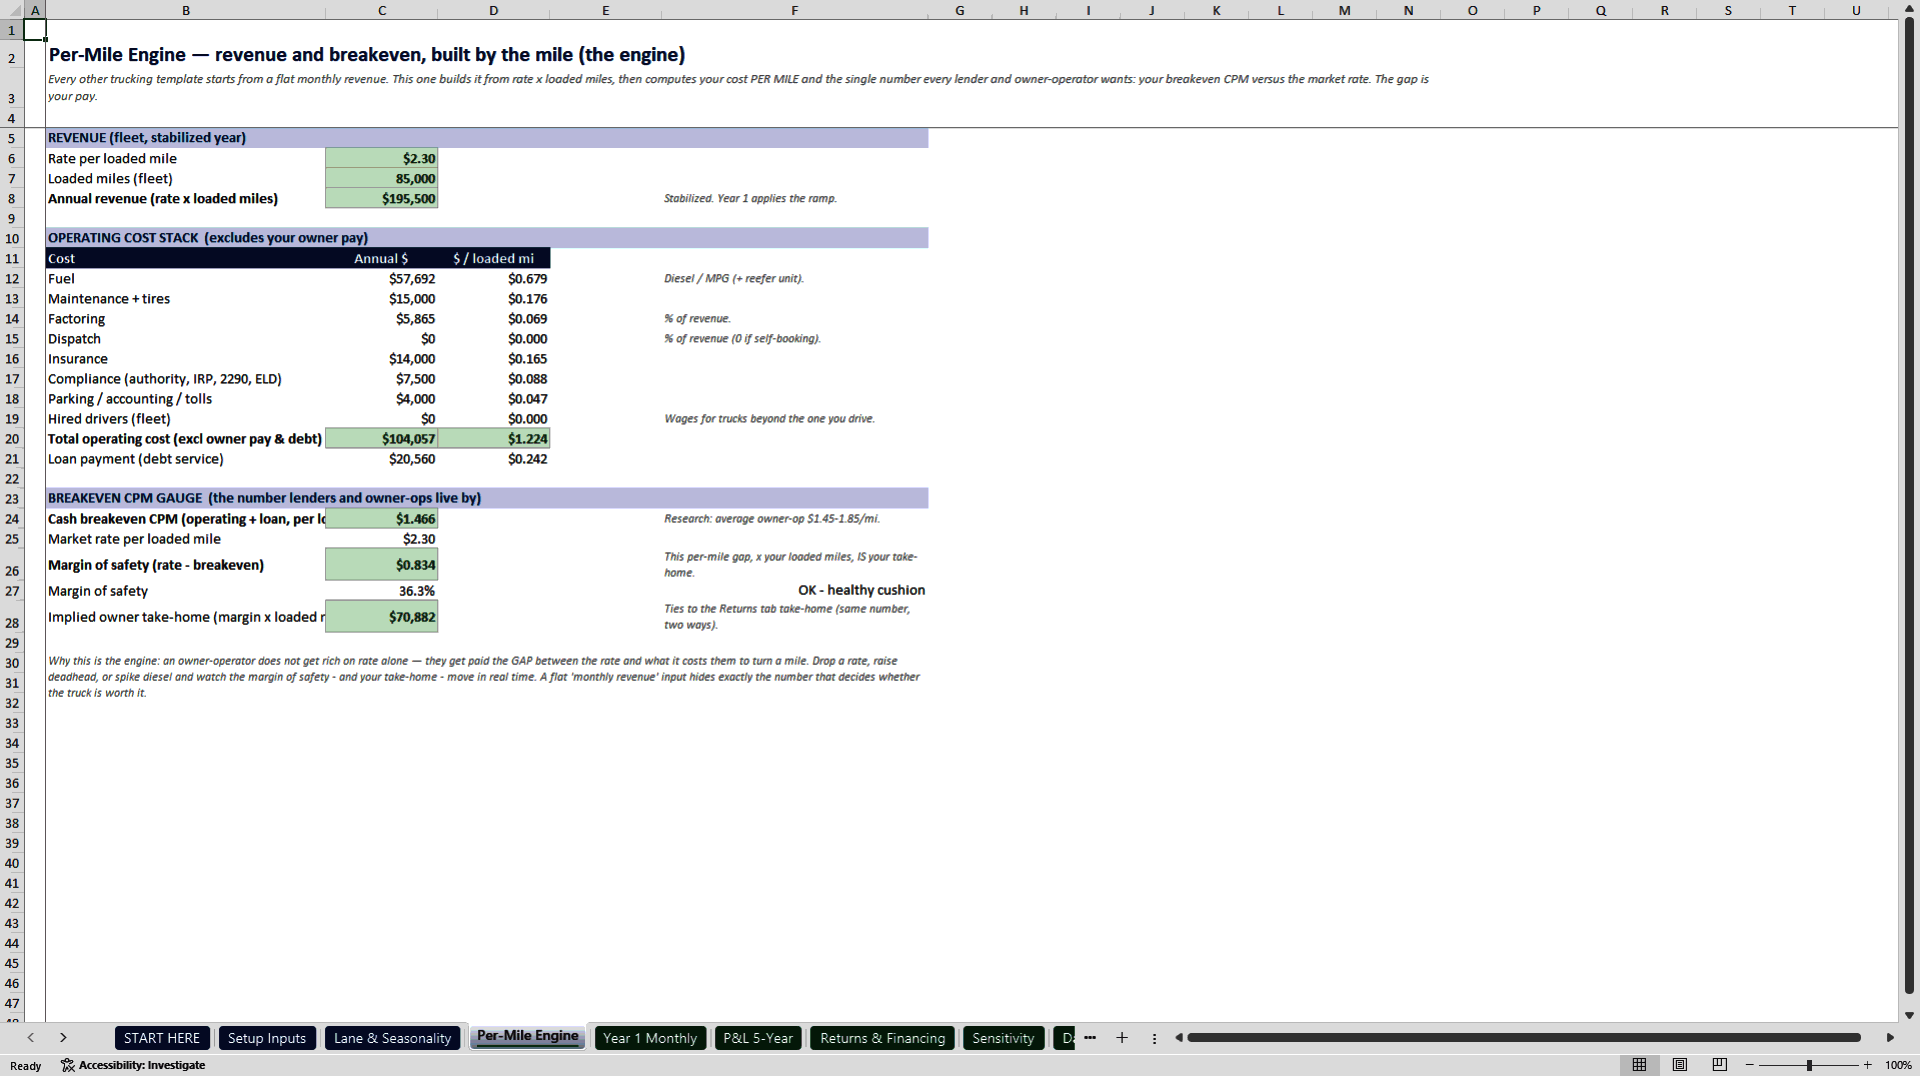
Revenue starts where the money actually starts: rate per loaded mile multiplied by loaded miles, with deadhead treated as a first class input rather than an afterthought. Loaded miles are total miles multiplied by one minus the deadhead percentage, so empty running reduces revenue without reducing fuel, tyres or driver hours. Every cost is then priced per loaded mile, which produces the single number an owner-operator lives by: the all-in cost per loaded mile.
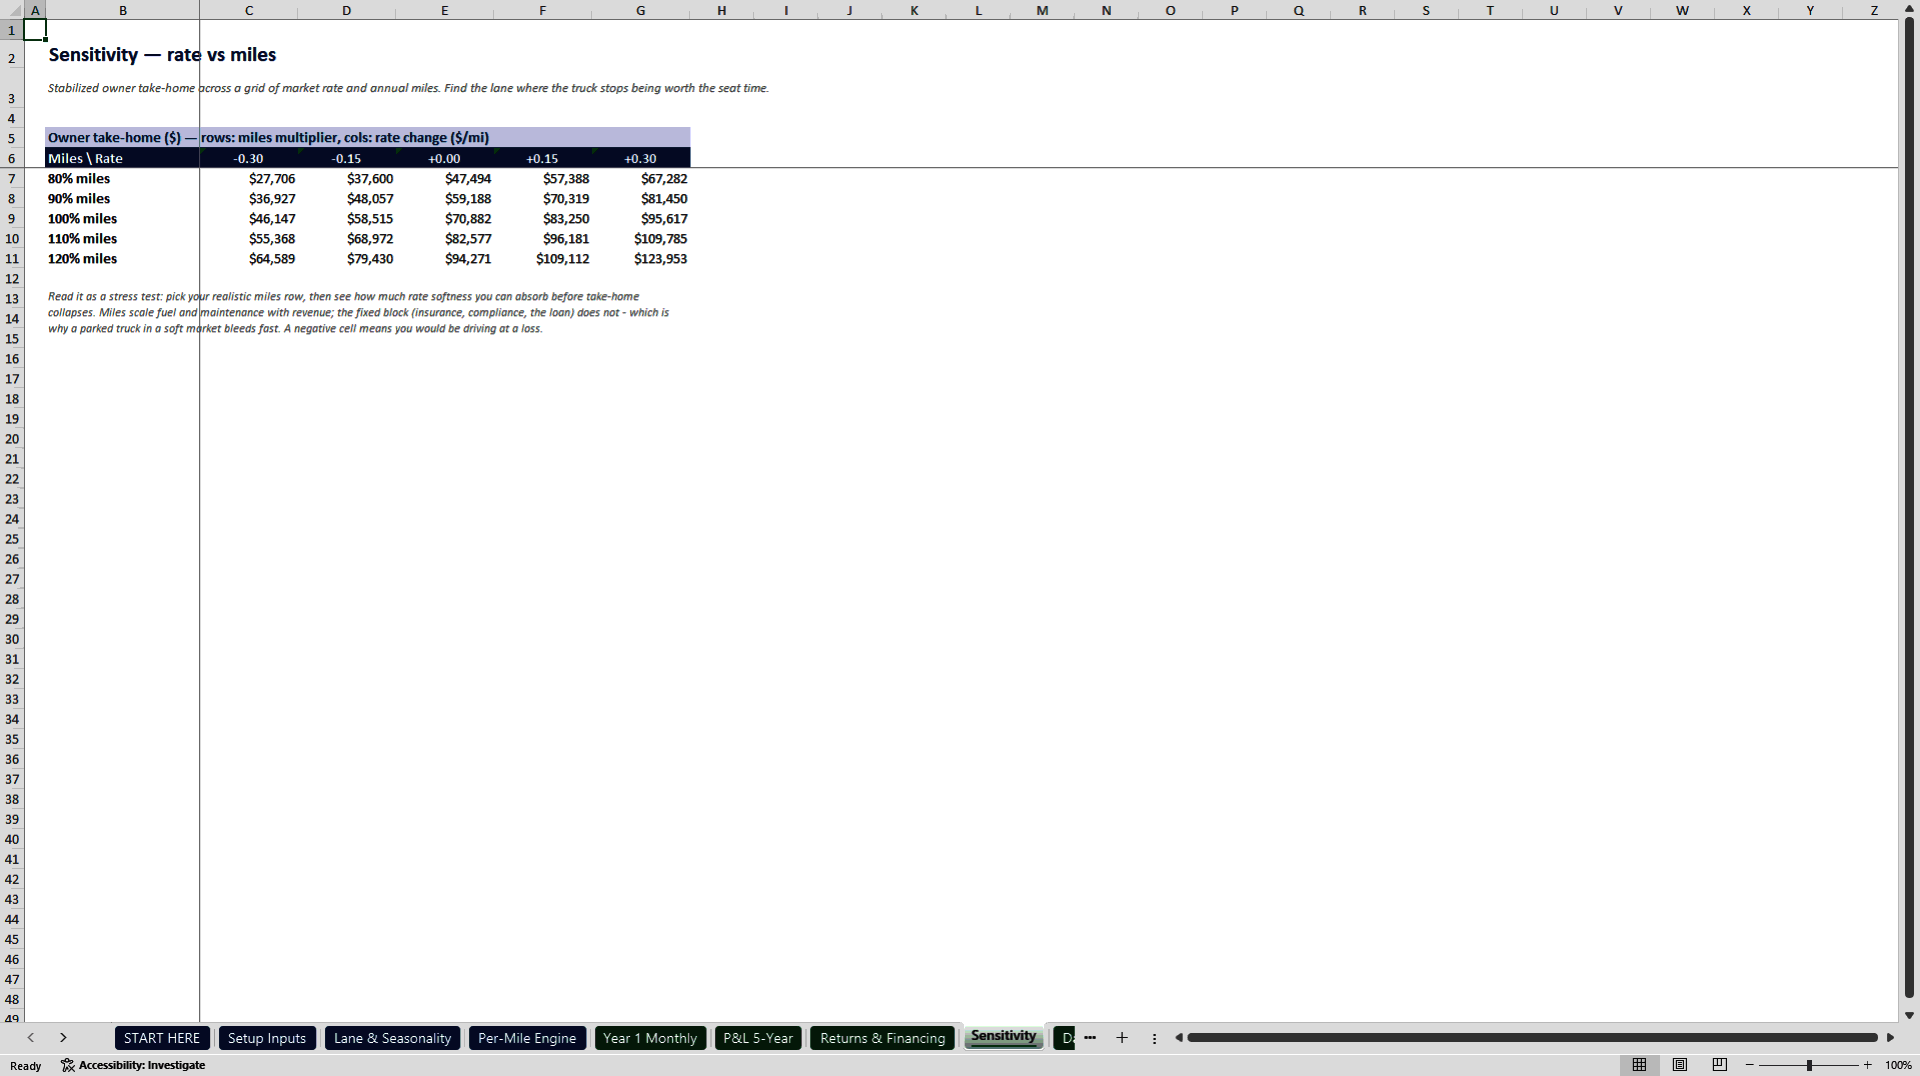
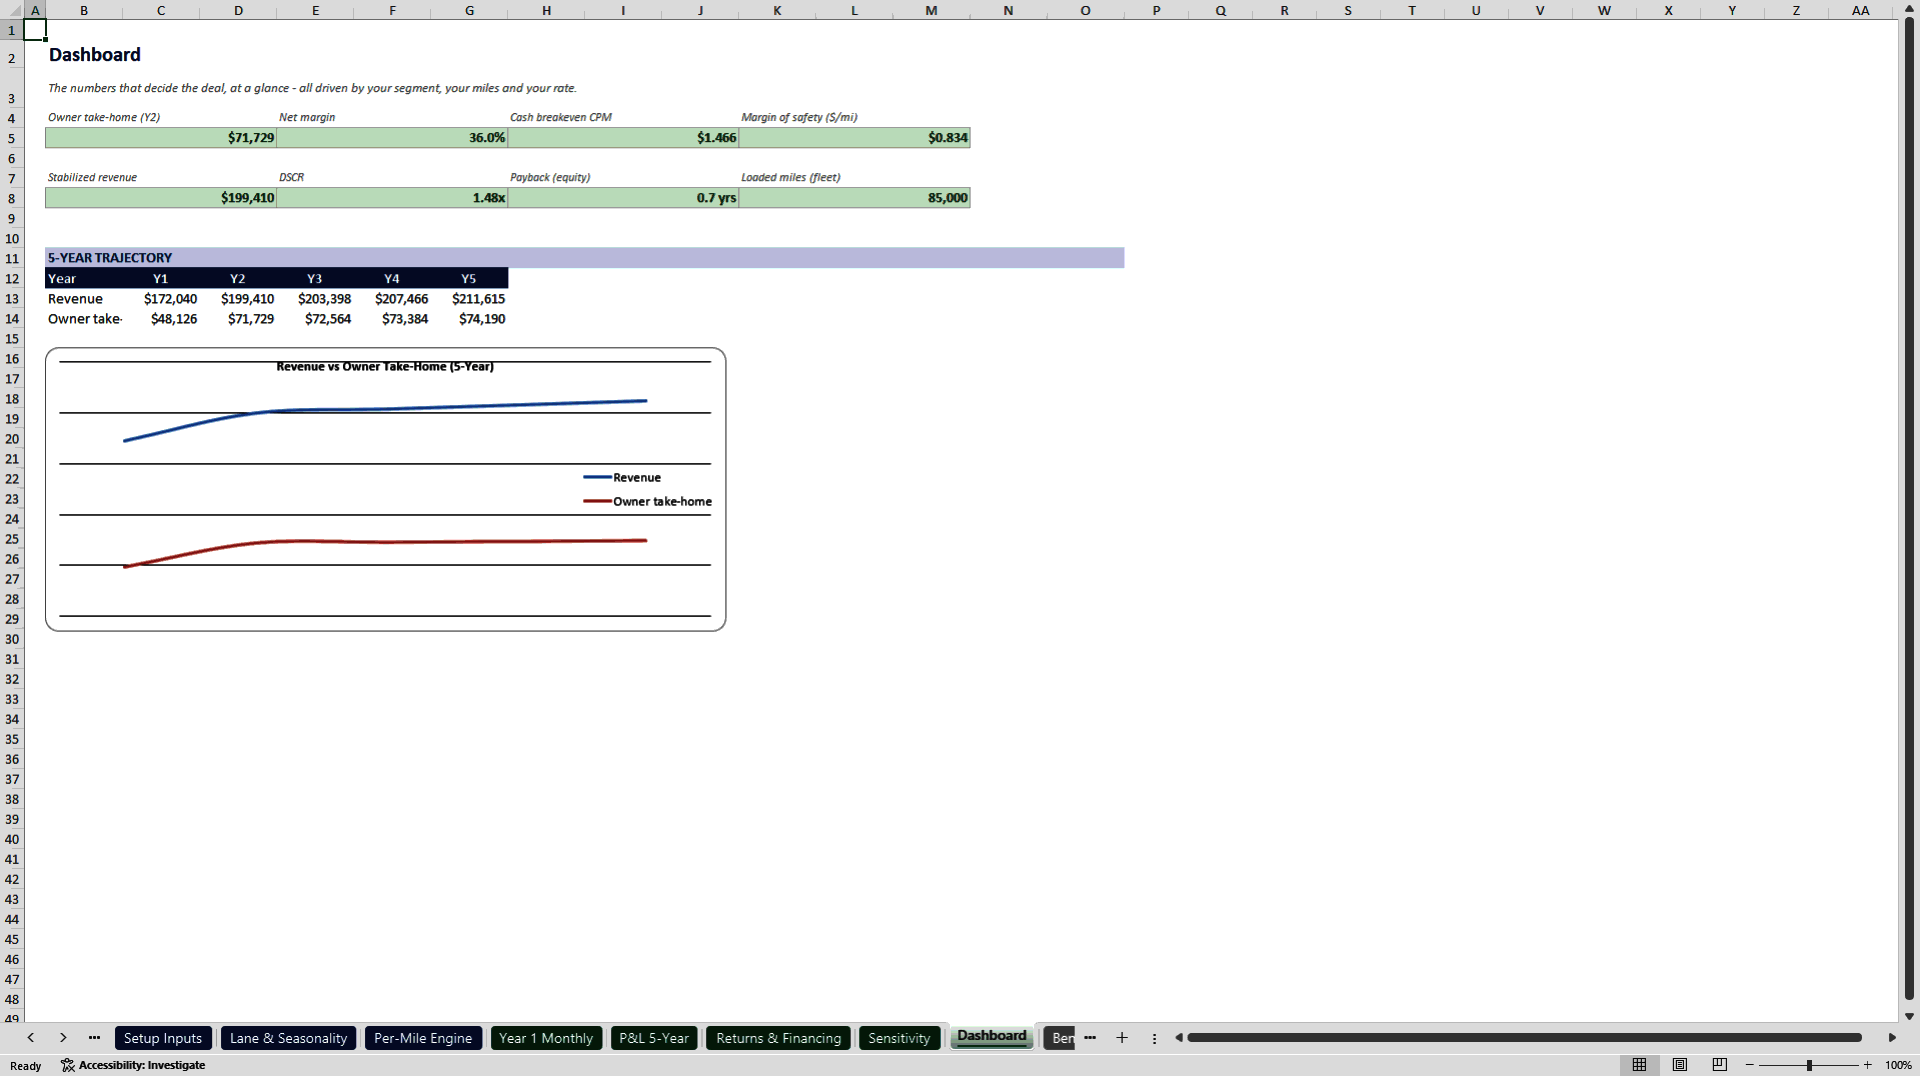
That cost sits next to the market rate on a live gauge. The gap between the two, multiplied by loaded miles, is your take-home on the engine's stabilized year, and the model proves that identity to the cent rather than asserting it. Beside it the model prints your true break-even rate: the rate at which cash flow actually reaches zero, which sits lower because factoring and dispatch shrink with the rate. Drop the rate, raise deadhead or spike diesel and the margin of safety and the take-home move together in front of you.
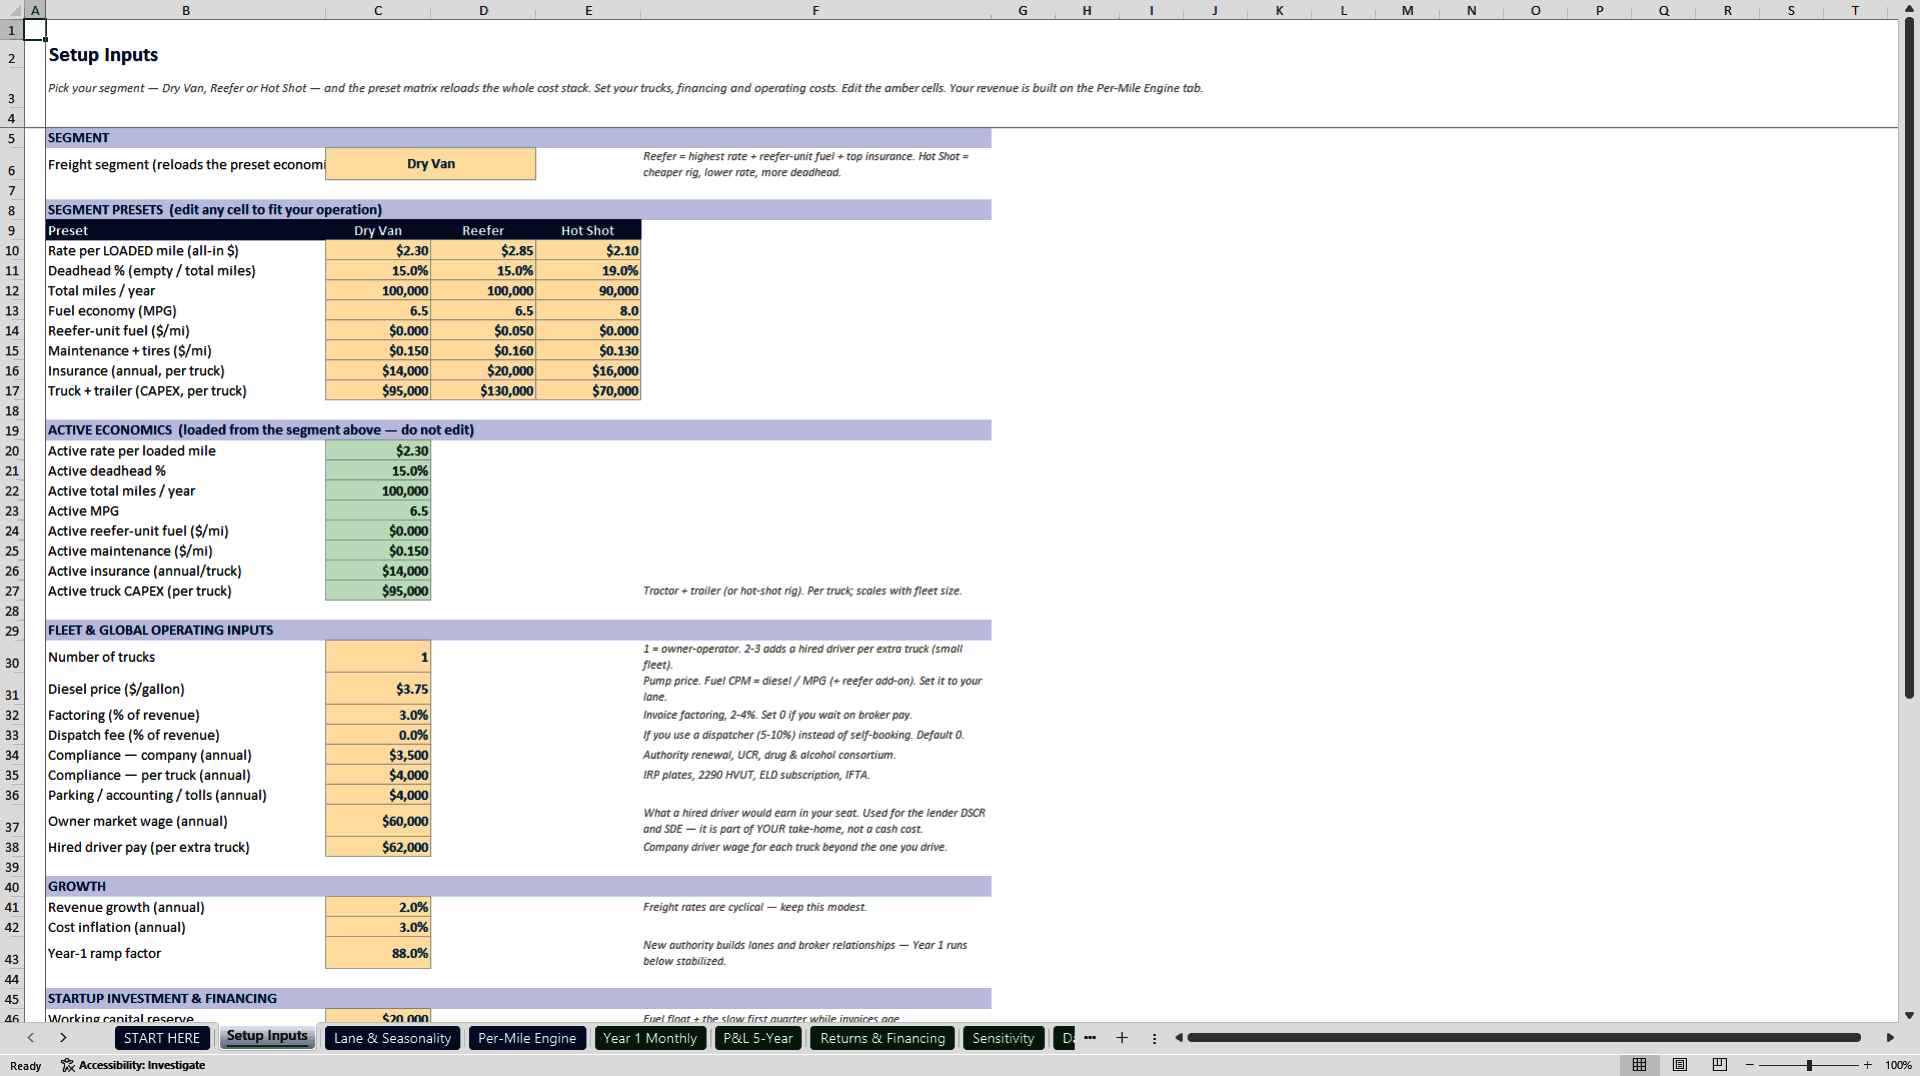
A segment toggle reloads the entire cost stack from an editable preset table covering dry van, reefer and hot shot work: booked rate, fuel economy, reefer unit burn, maintenance, insurance and equipment capital expenditure. The same file runs a single truck for yourself or a small fleet of two or three with hired driver pay layered in.
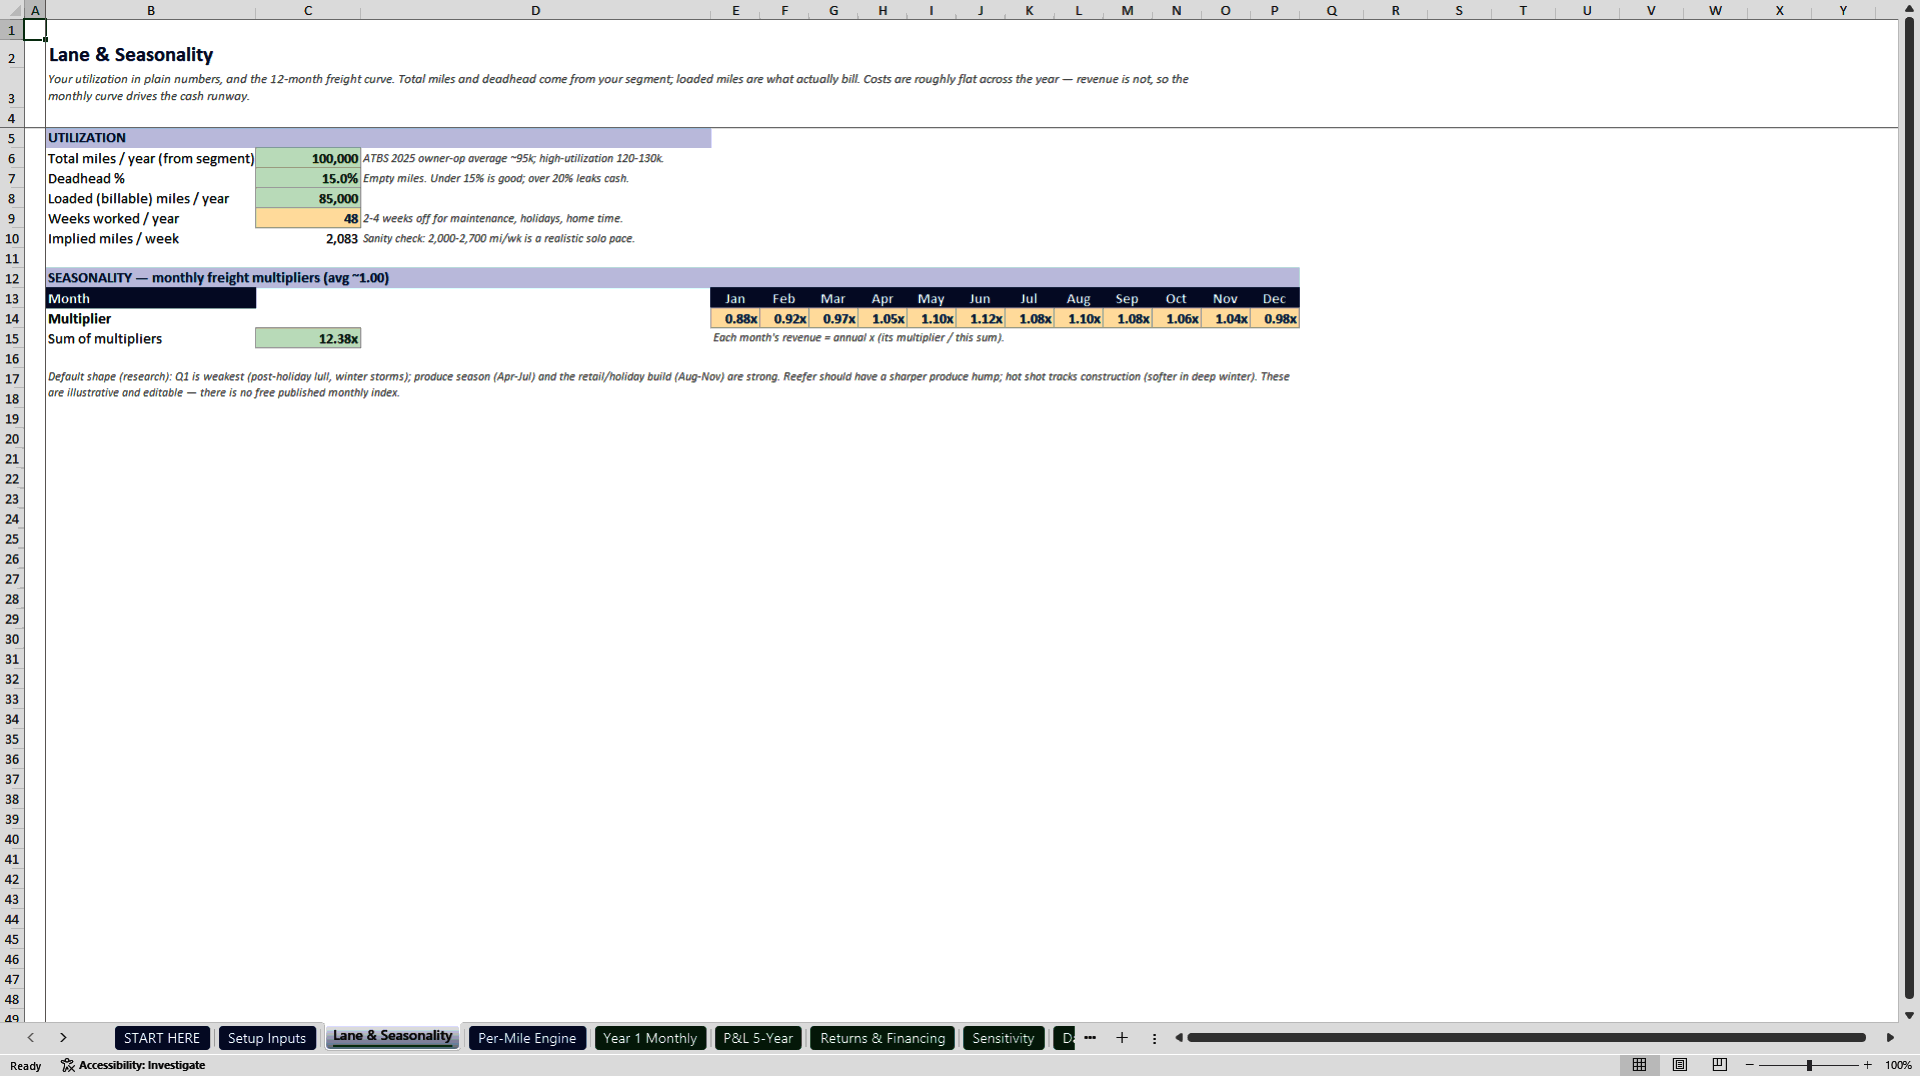
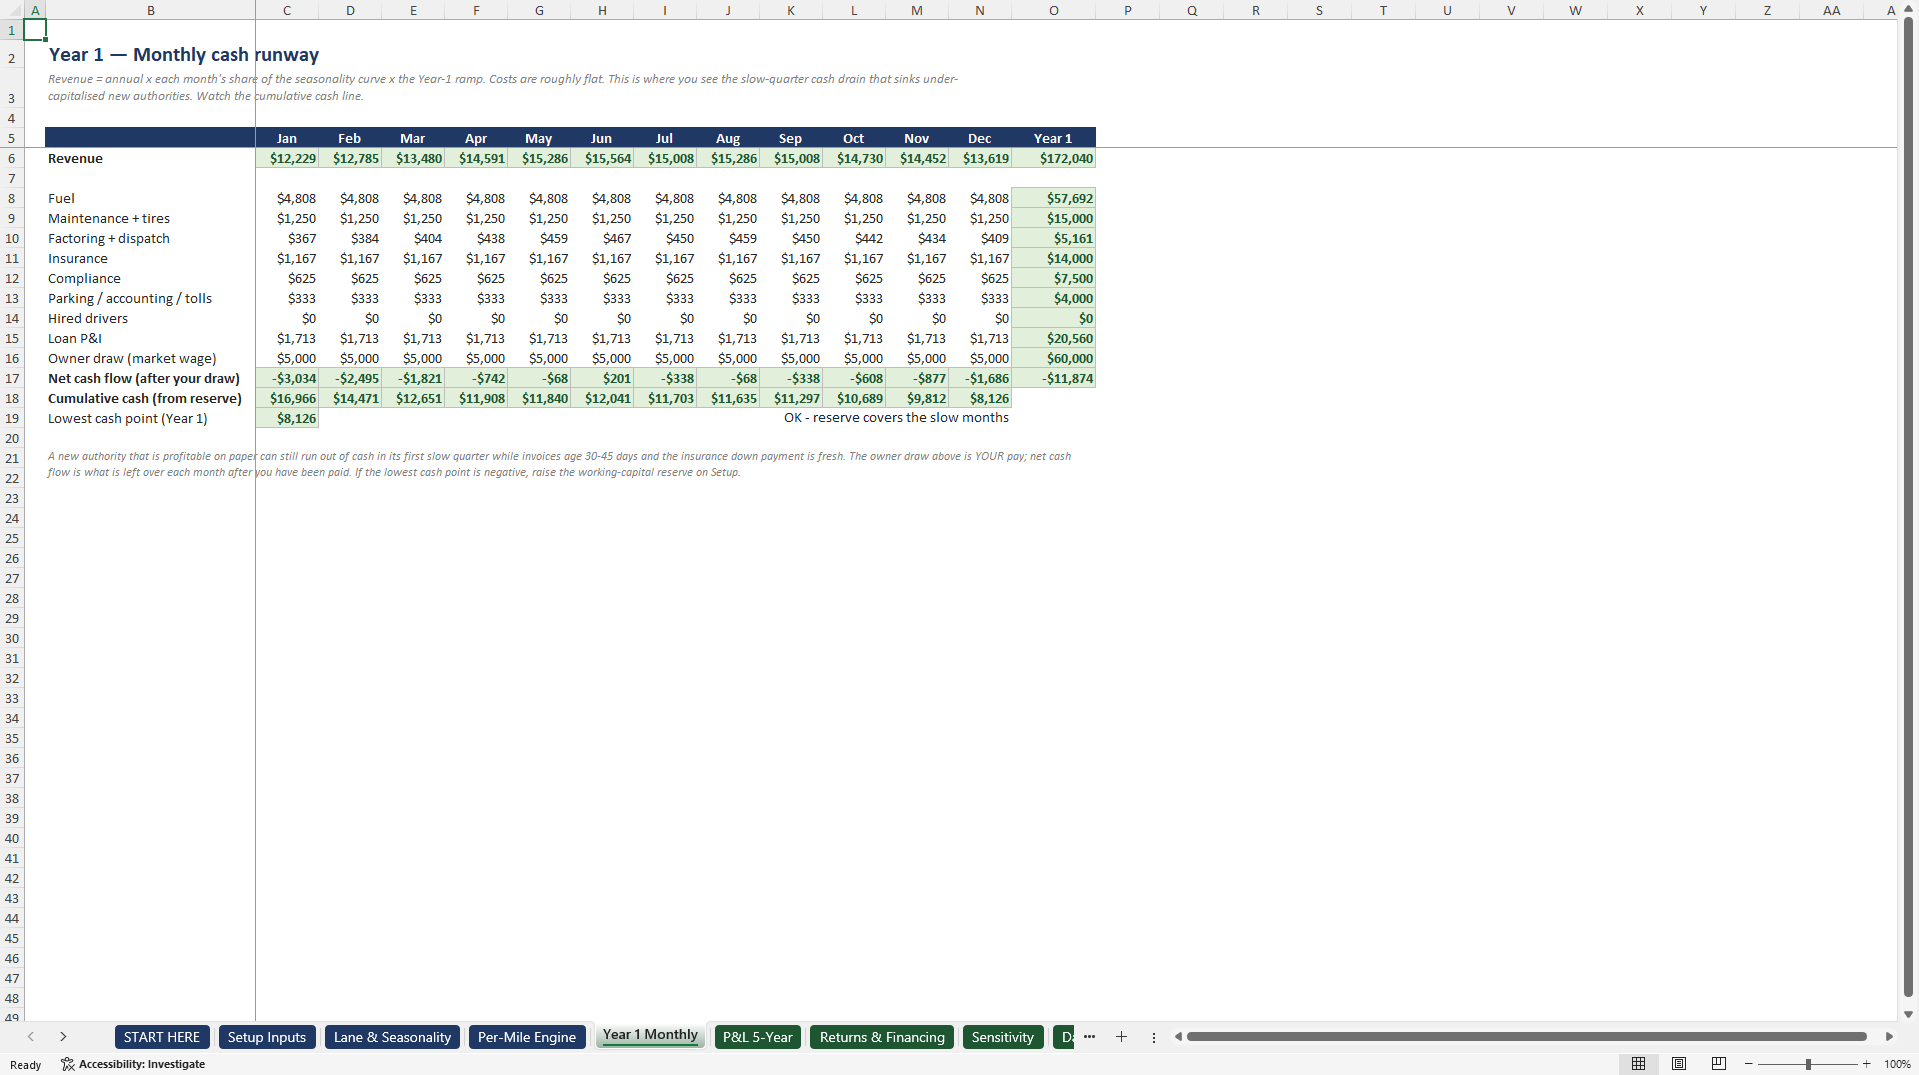
Twelve months of seasonality feed a first year cash runway, so the slow quarter months where you bleed cash while invoices age are visible before they happen. That drain is what sinks under-capitalised new authorities, and it does not appear in an annual average.
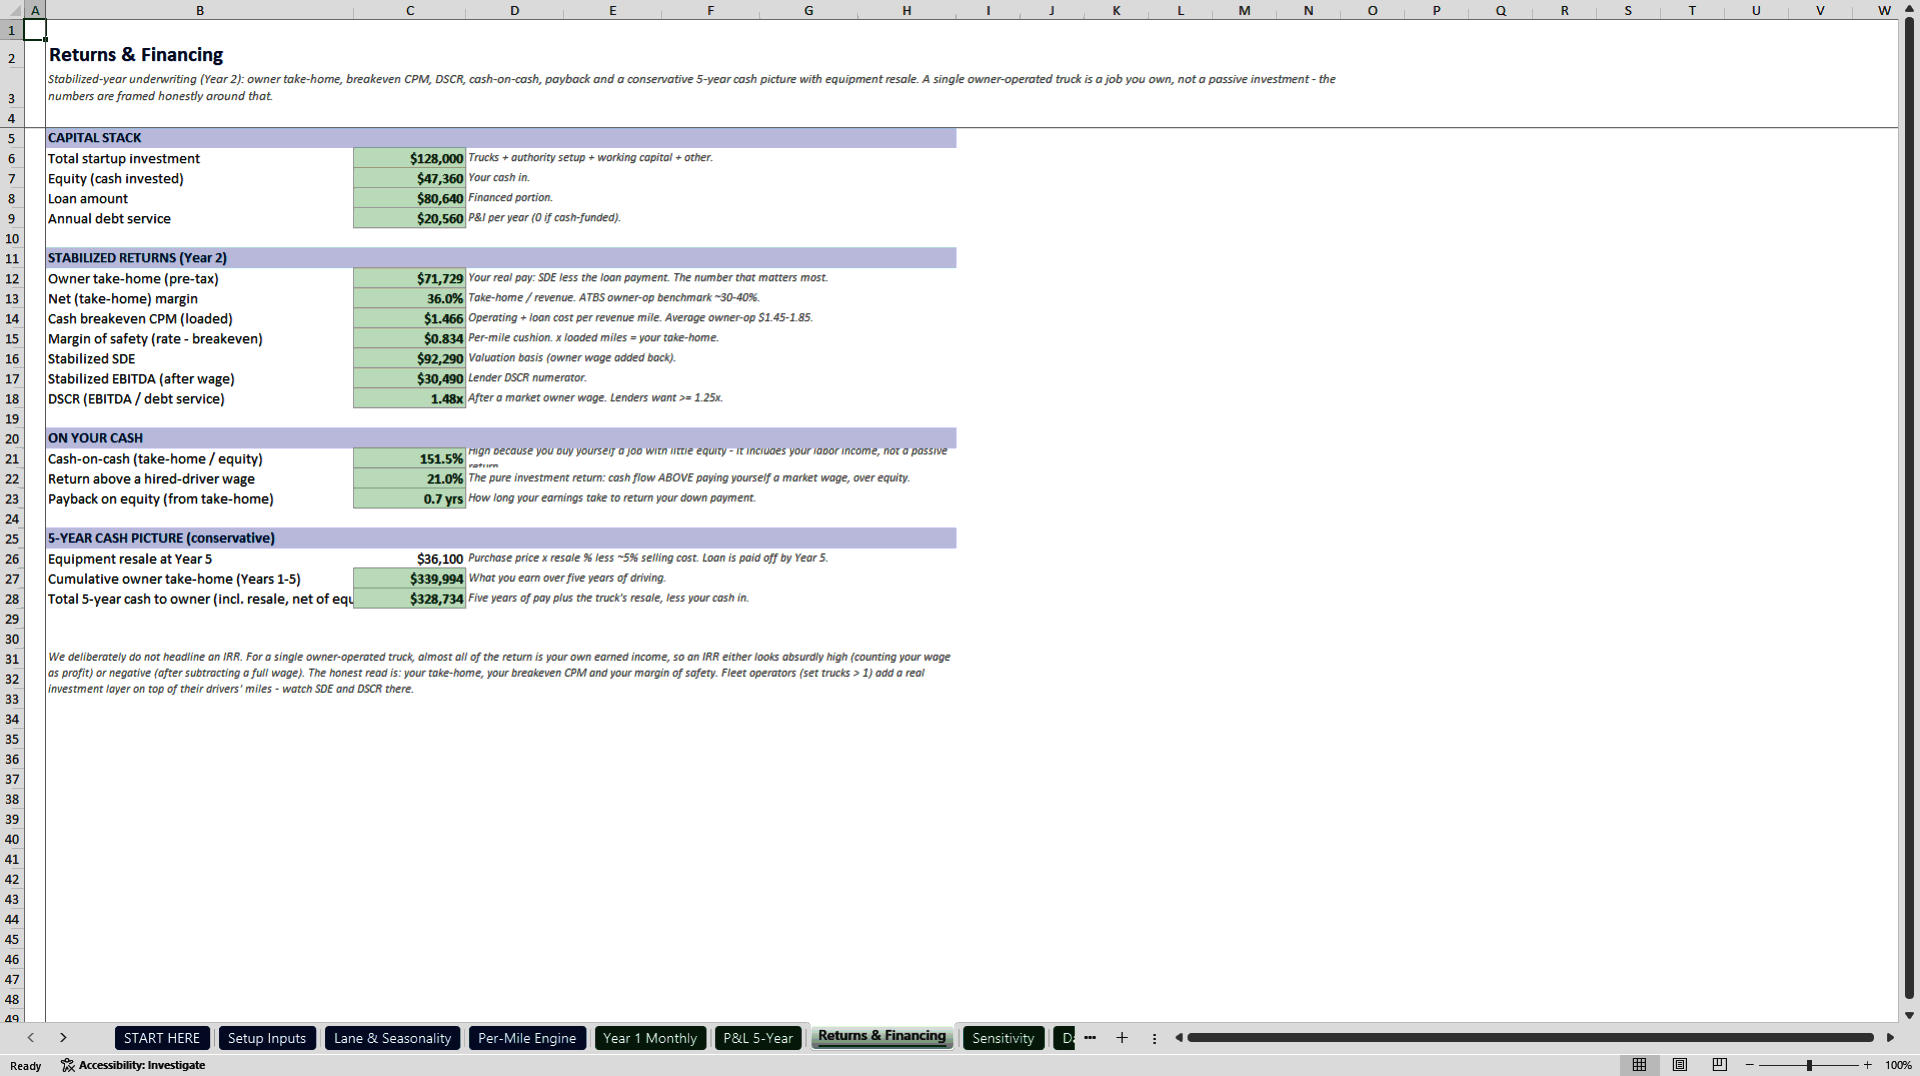
The model produces a five-year profit and loss statement, EBITDA struck after a market driver wage, seller's discretionary earnings, owner take-home after the equipment loan, debt service coverage, cash-on-cash return and payback. These are the figures an equipment lender checks first.
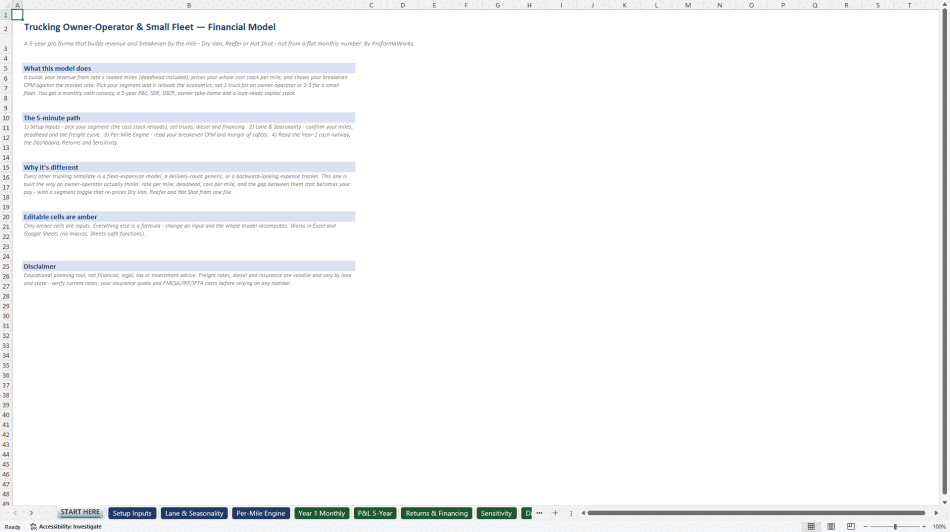
Ten sheets, no macros, no add-ins and no external links, so the workbook opens in Excel and in Google Sheets alike. A START HERE sheet produces a first projection in minutes and only the amber input cells need filling. A benchmarks sheet documents the sourced spot rate, deadhead, diesel, fuel economy, insurance, factoring and owner-operator income ranges behind the defaults. Every formula is recomputed by three independent calculation engines before release.
The download also includes a nineteen page PDF user guide covering quick start, a sheet by sheet walkthrough, how the per-mile engine works, how a lender reads coverage, break-even and payback, where to find your own lane numbers, and a full frequently asked questions section.
This is an educational planning tool and not financial, legal, tax or investment advice. Freight rates, diesel and insurance are volatile and vary by lane and by state, so validate your rate confirmations, your insurance quote and your regulatory costs before relying on any figure.
Got a question about the product? Email us at support@flevy.com or ask the author directly by using the "Ask the Author a Question" form. If you cannot view the preview above this document description, go here to view the large preview instead.
Source: Best Practices in Transportation, Integrated Financial Model Excel: Trucking Owner-Operator and Small Fleet Financial Model Excel (XLSX) Spreadsheet, ProformaWorks
ABOUT THE AUTHOR

ProformaWorks builds acquisition-grade financial models for Main Street and lower-middle-market businesses - the kind of deal financed with an SBA 7(a) loan or a small commercial facility.
Every model answers one question: does this deal pencil at the bank? That means SDE or NOI rebuilt from the seller's own numbers, the add-backs a lender will and will not accept, a debt-service
... [read more]
Ask the Author a Question
You must be logged in to contact the author.




























