
 Click main image to view in full screen. Unlock all 10 preview images:
Subscription Cohort, Churn & Retention Analyzer (NRR/GRR) – Excel XLSX
Excel (XLSX) + supplemental PDF


BENEFITS OF THIS DOWNLOADABLE EXCEL DOCUMENT
- Turns a flat revenue export into board-ready cohort, NRR/GRR and unit-economics analysis in minutes.
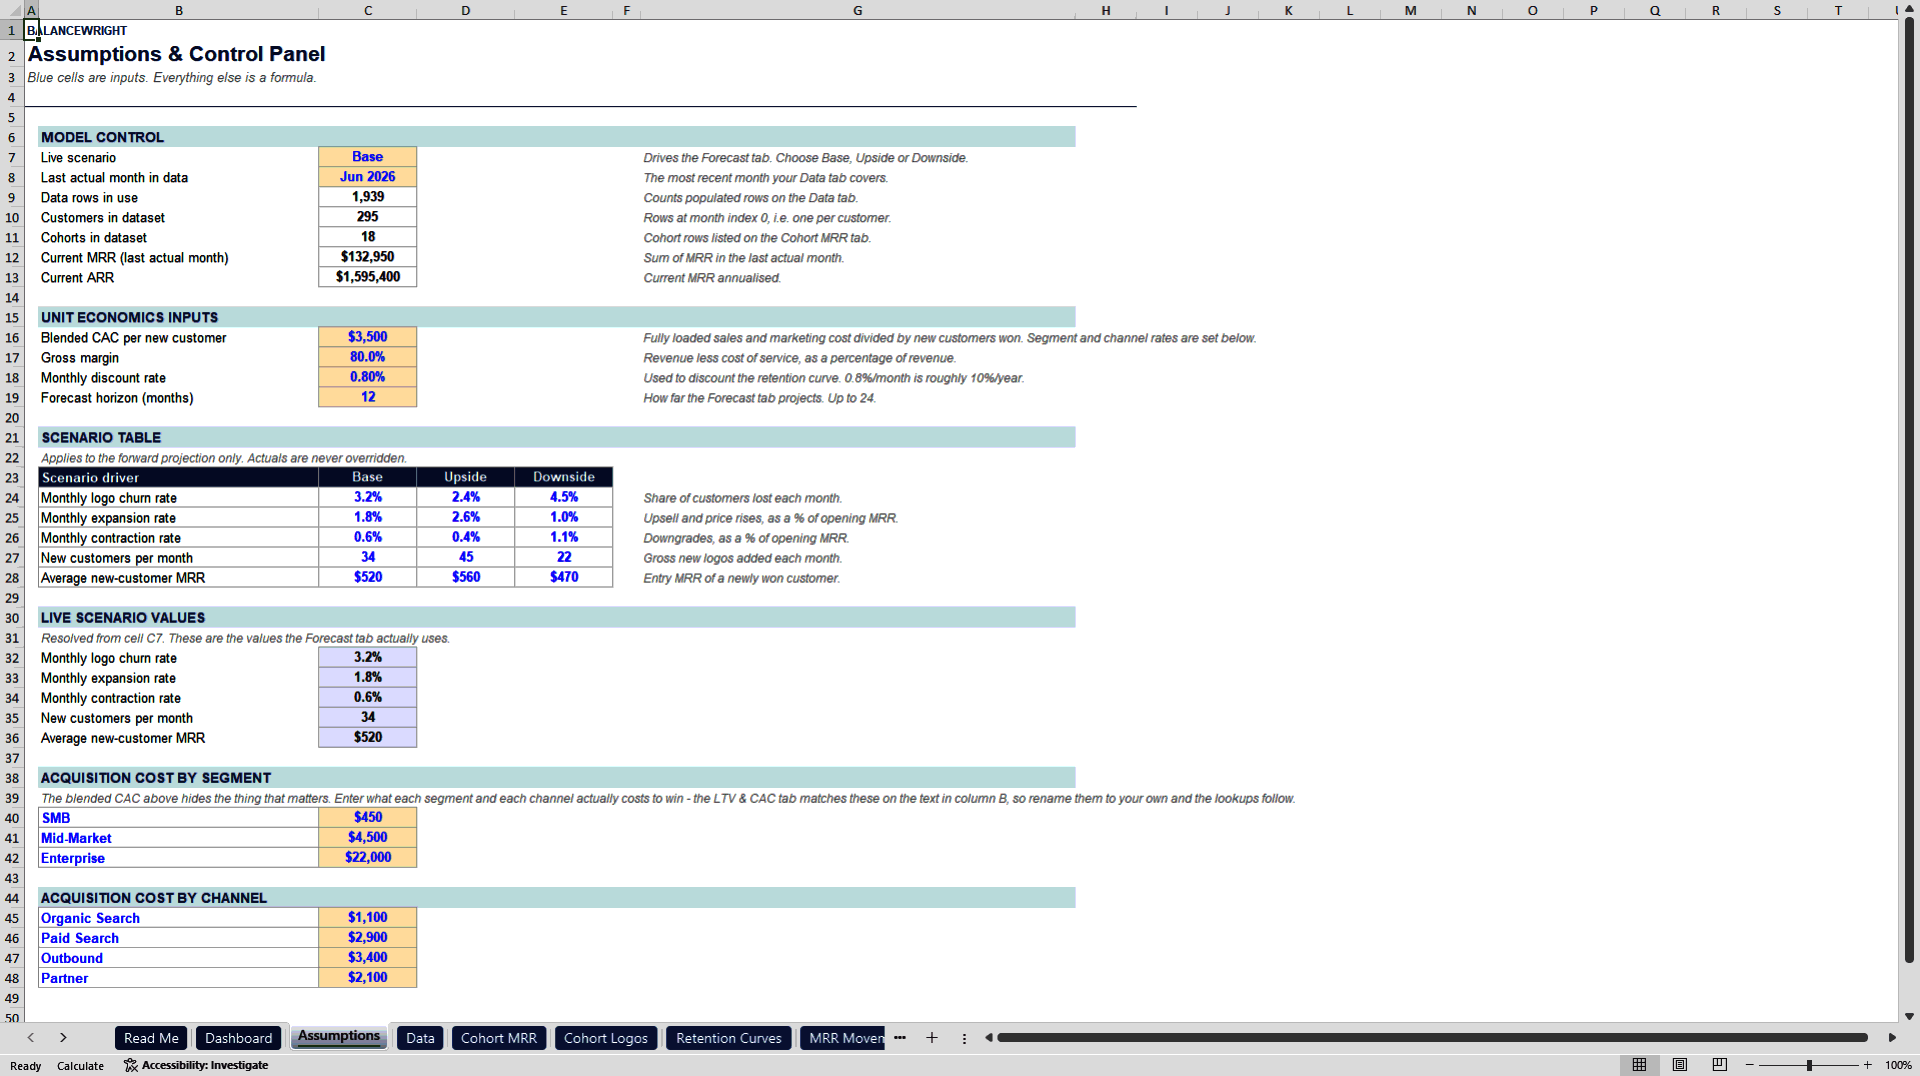
- Splits LTV, LTV:CAC and CAC payback by segment and by channel, each with its own observed churn rate and its own acquisition cost.
- Ships with eight built-in integrity checks, so you can prove the numbers reconcile before you present them.
REVENUE MANAGEMENT EXCEL DESCRIPTION
Most subscription businesses can tell you what their revenue was last month. Far fewer can tell you where it came from – how much was genuinely new, how much was existing customers spending more, and how much quietly leaked away through downgrades and cancellations. That gap is where boards lose confidence and where diligence stalls.
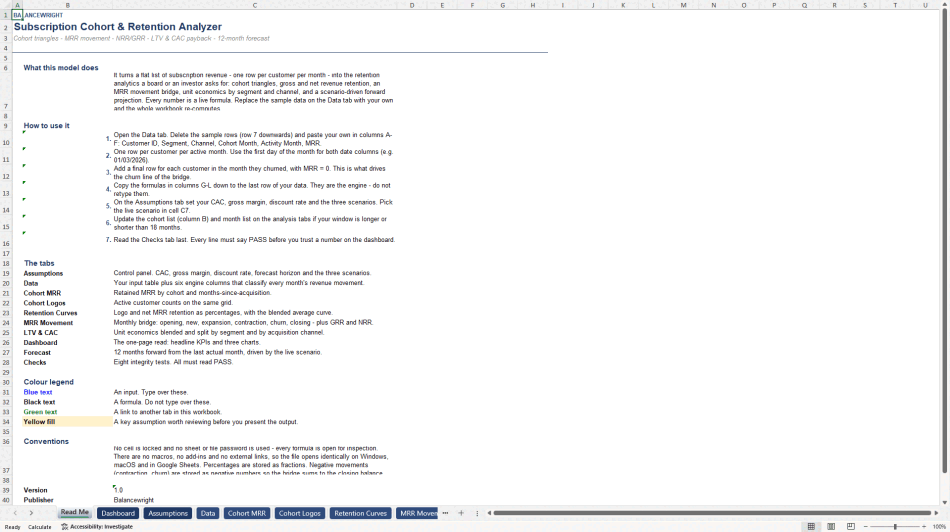
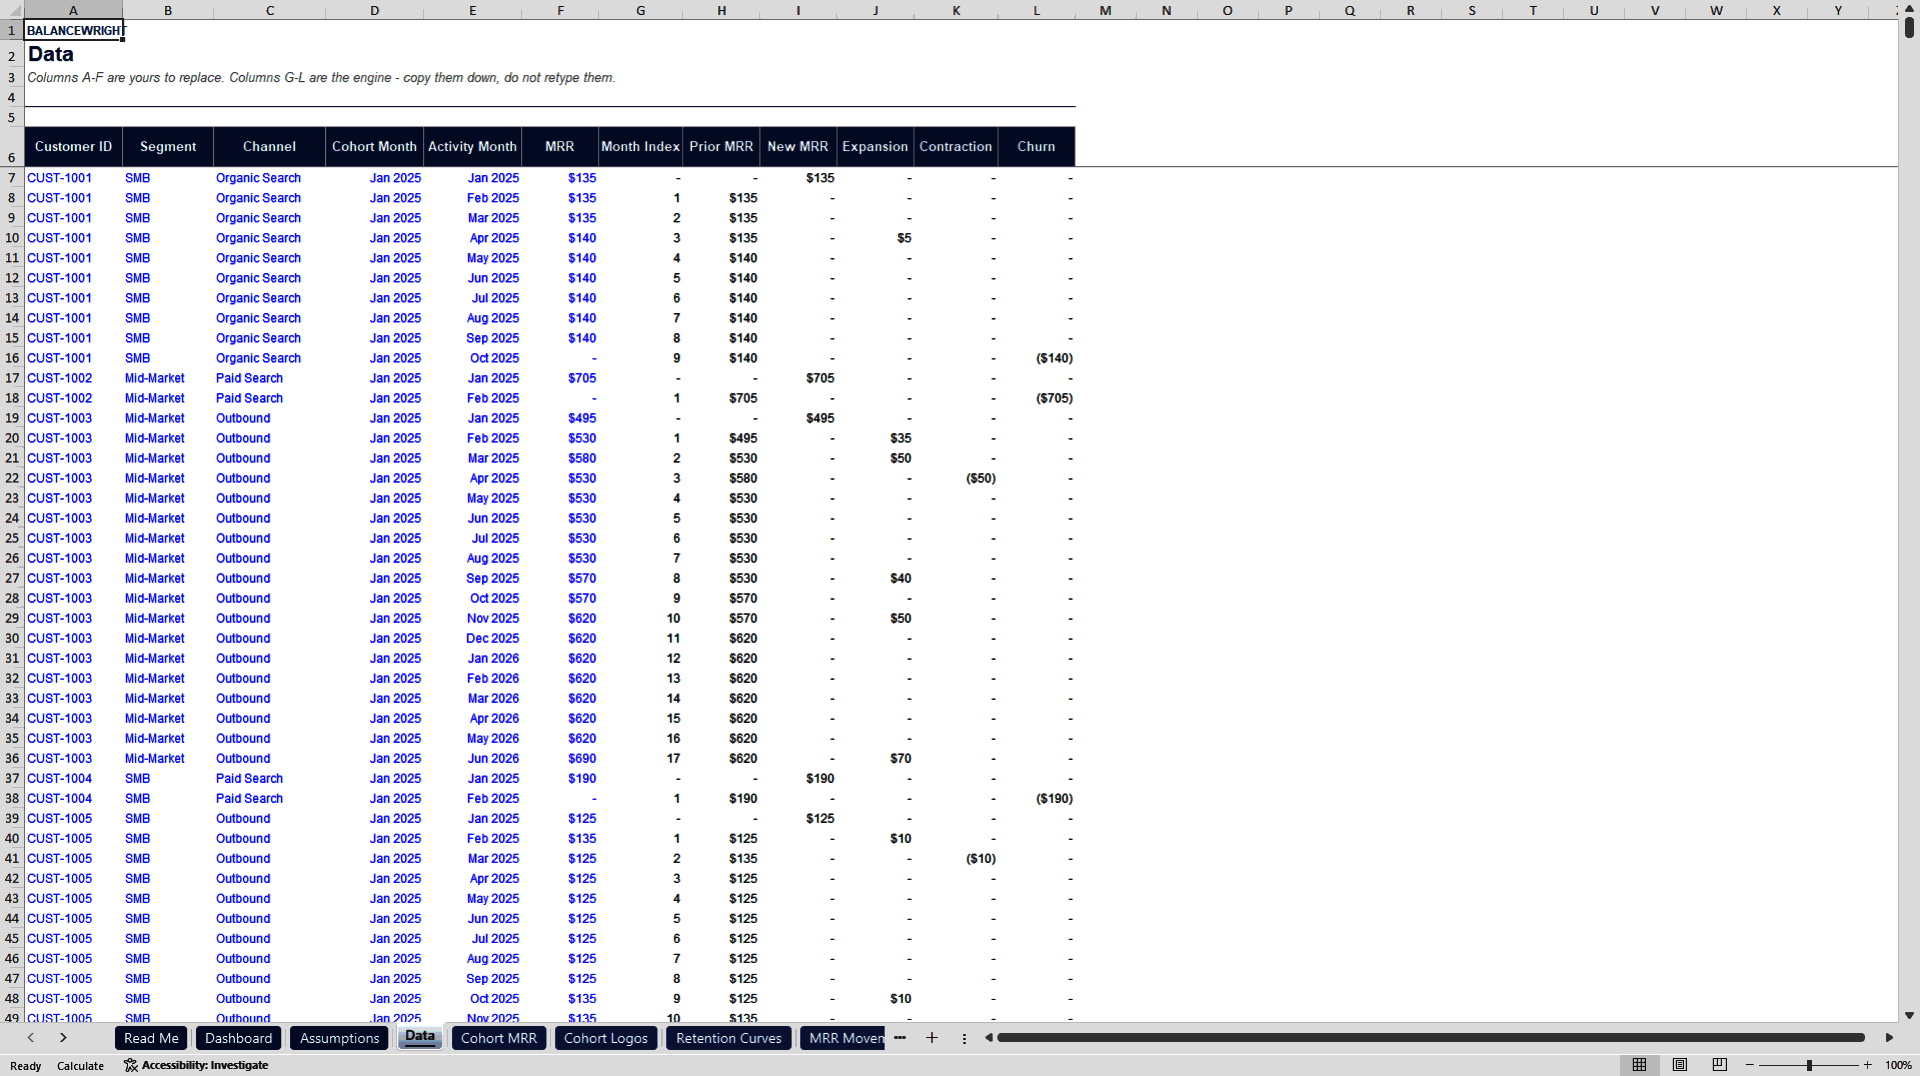
This workbook closes it. Give it one row per customer per month – customer ID, cohort month, activity month and MRR – and it returns the full retention picture in a single file.
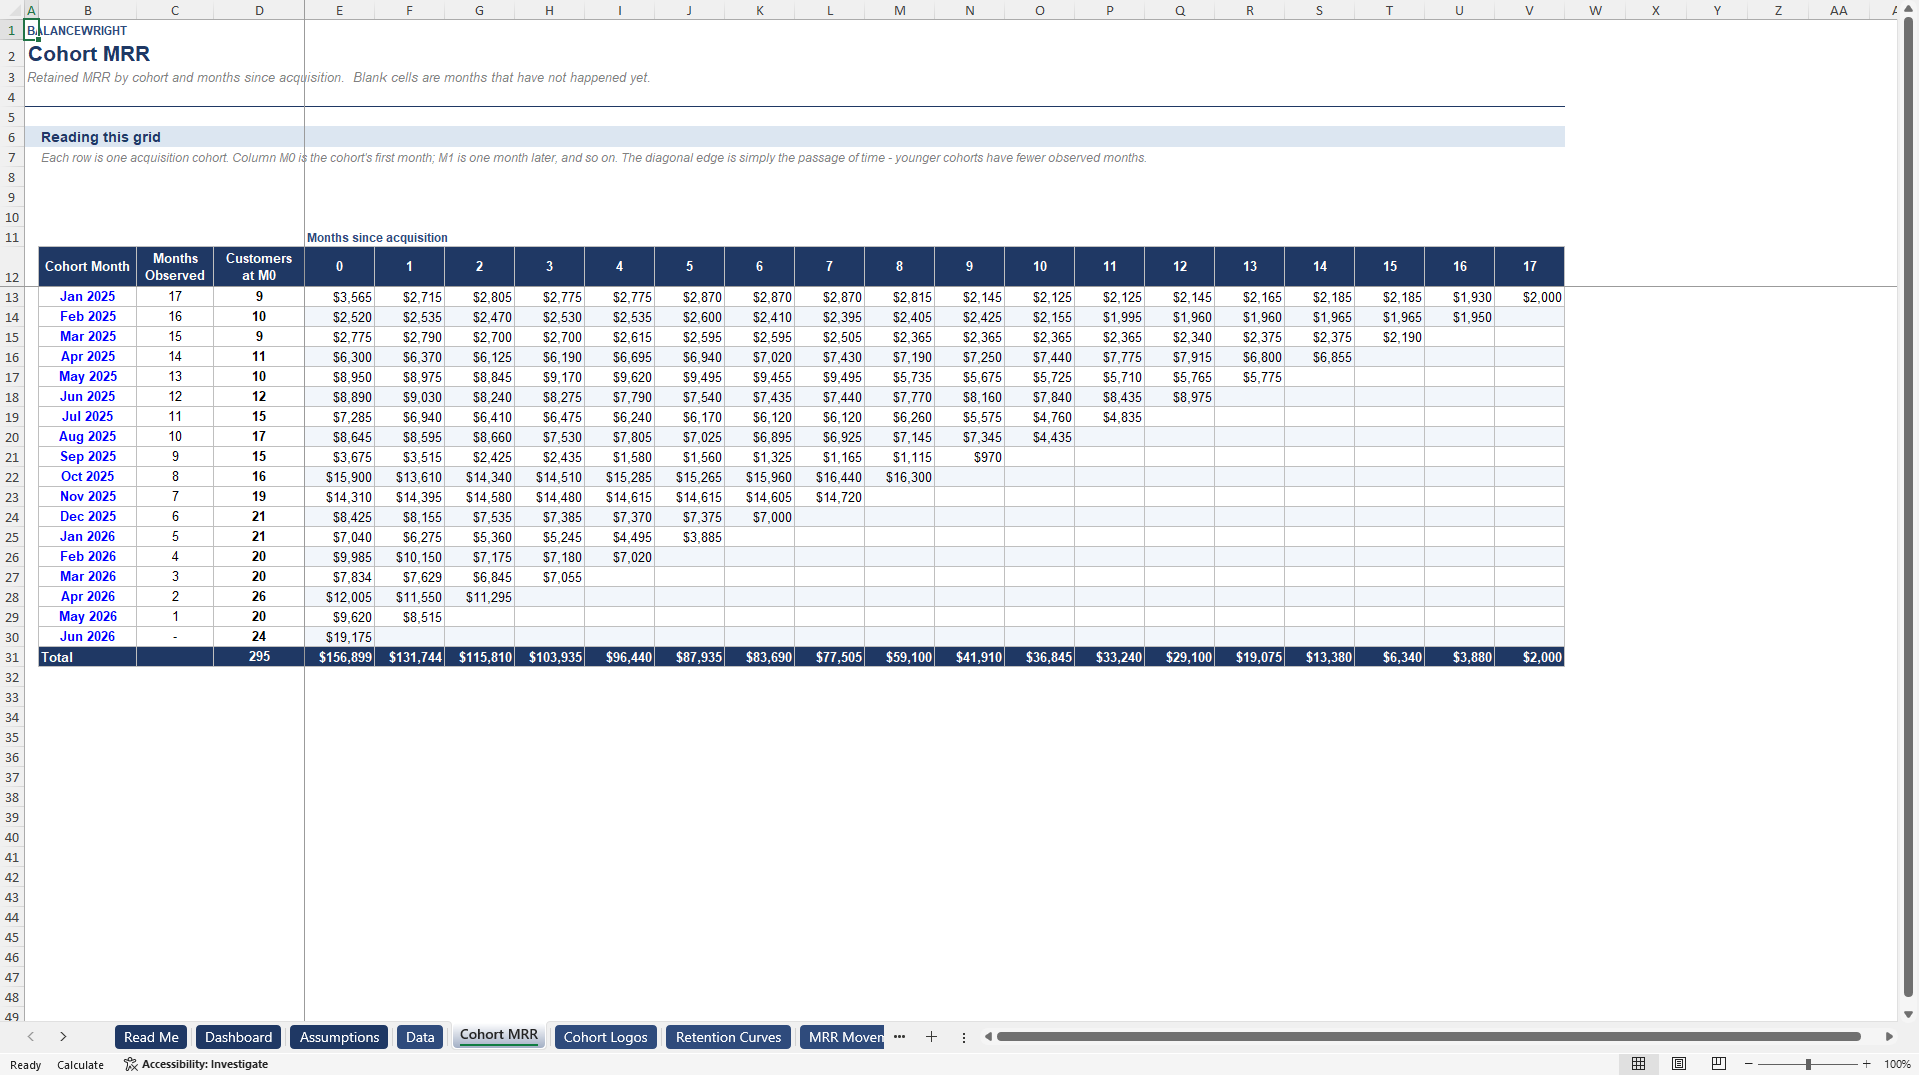
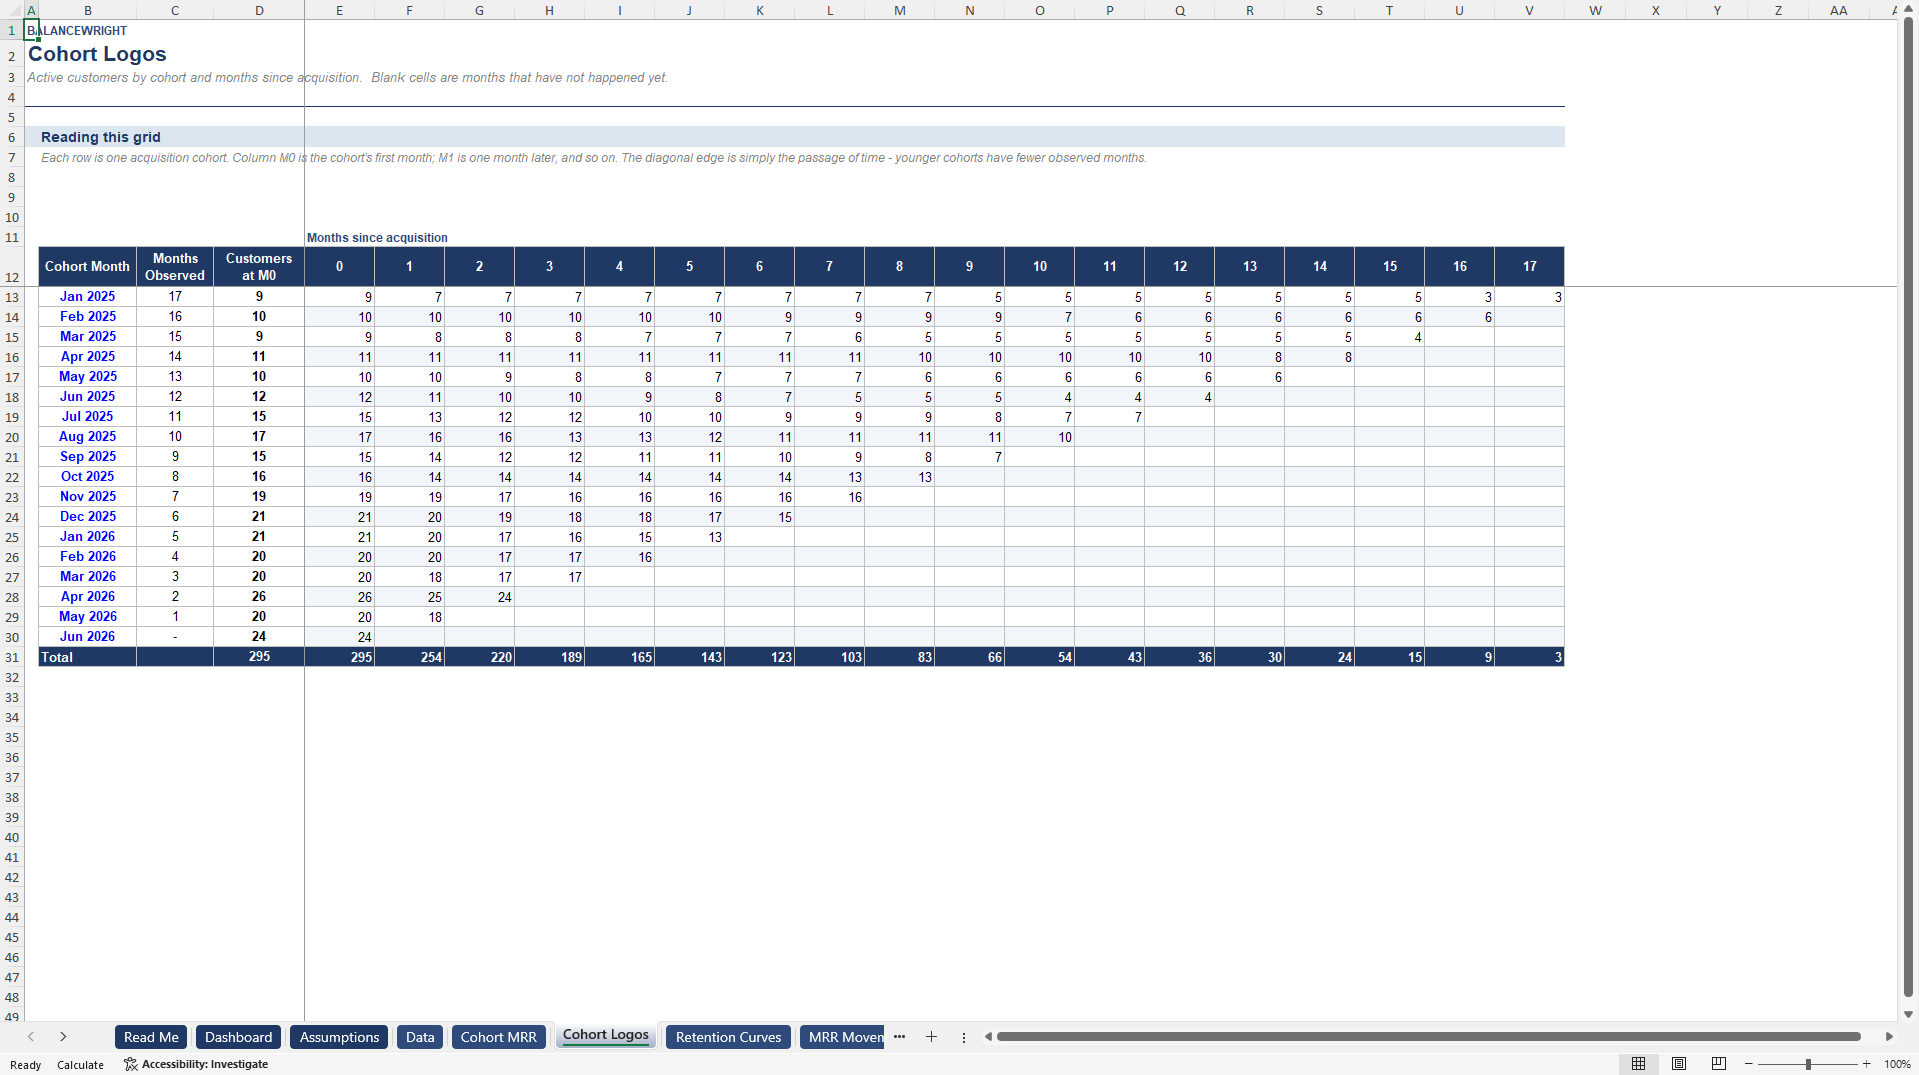
COHORT TRIANGLES. Retained MRR and active customer counts by cohort against months since acquisition, with a total row that reconciles back to your raw data to the cent.
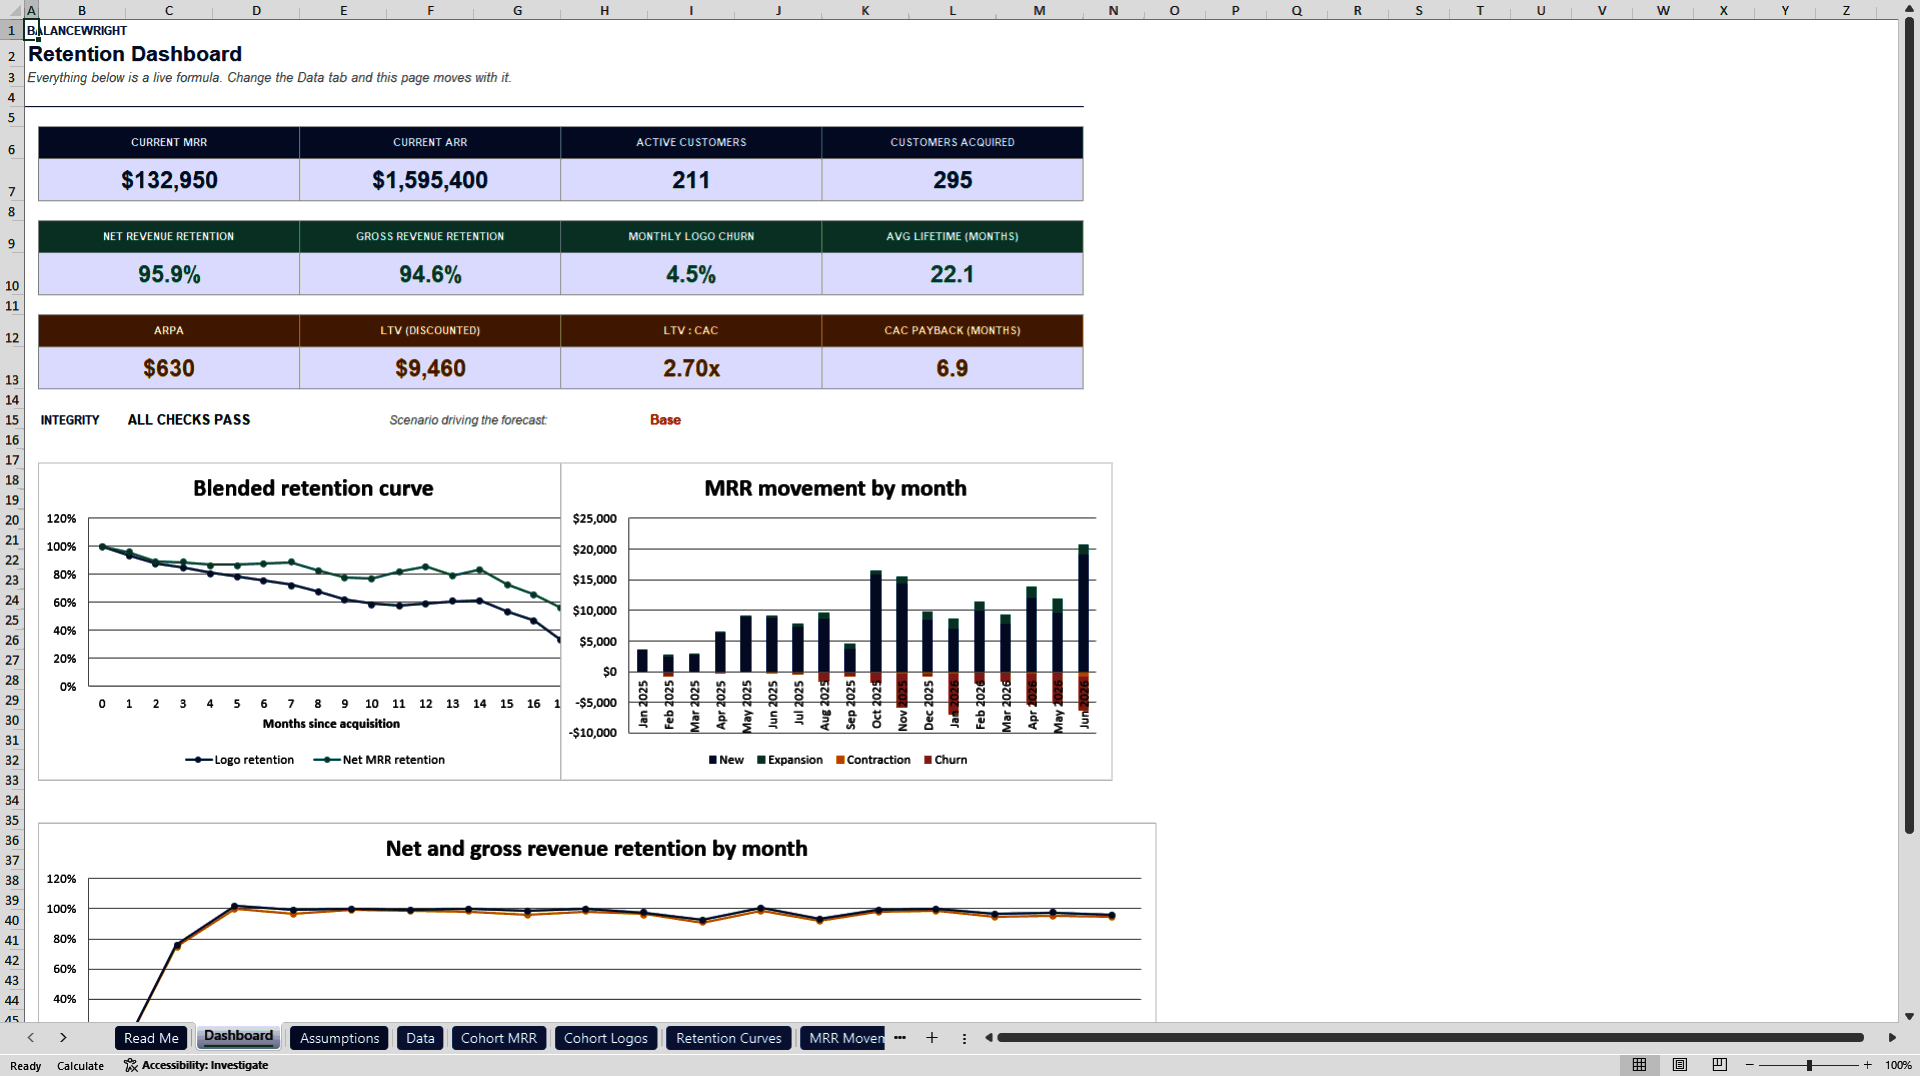
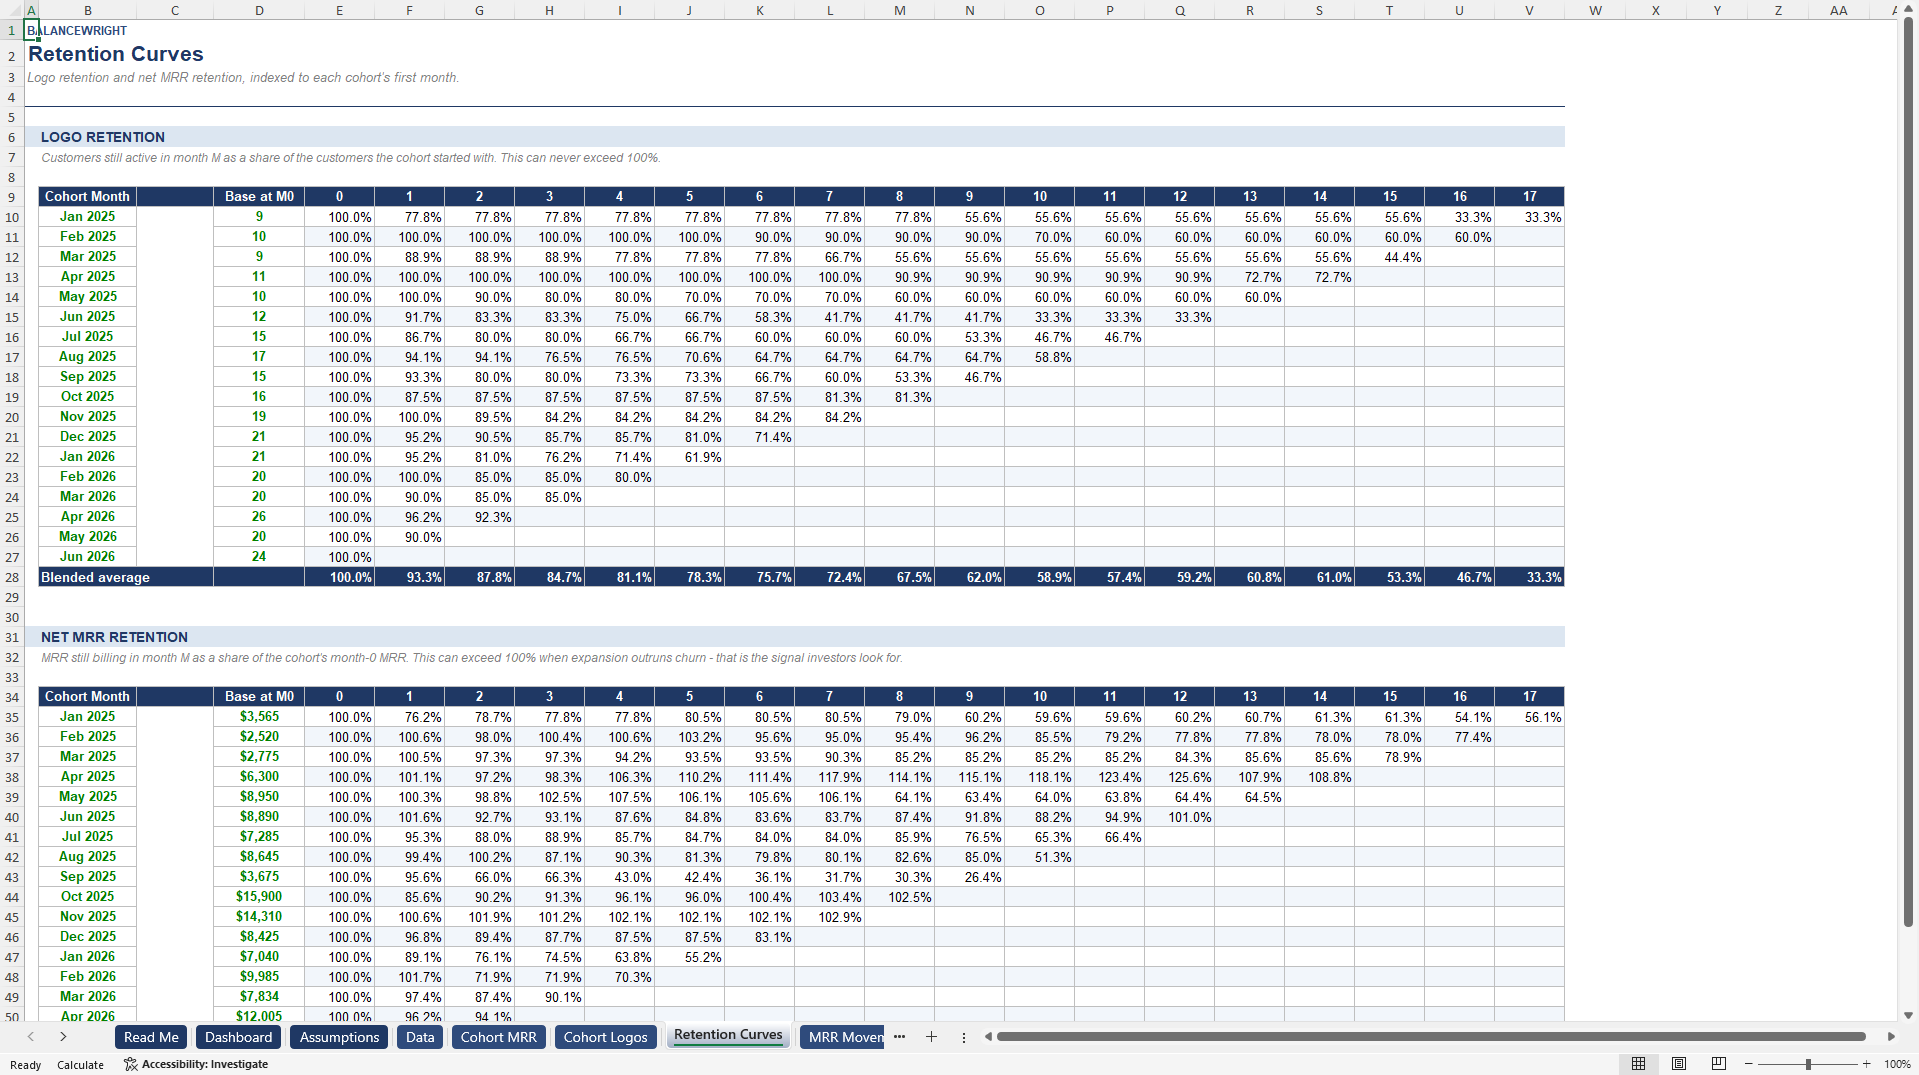
RETENTION CURVES. Both triangles expressed as percentages of each cohort's own starting point, with a blended average curve. Seeing logo retention and MRR retention diverge on the same chart is usually the moment the expansion story becomes visible.
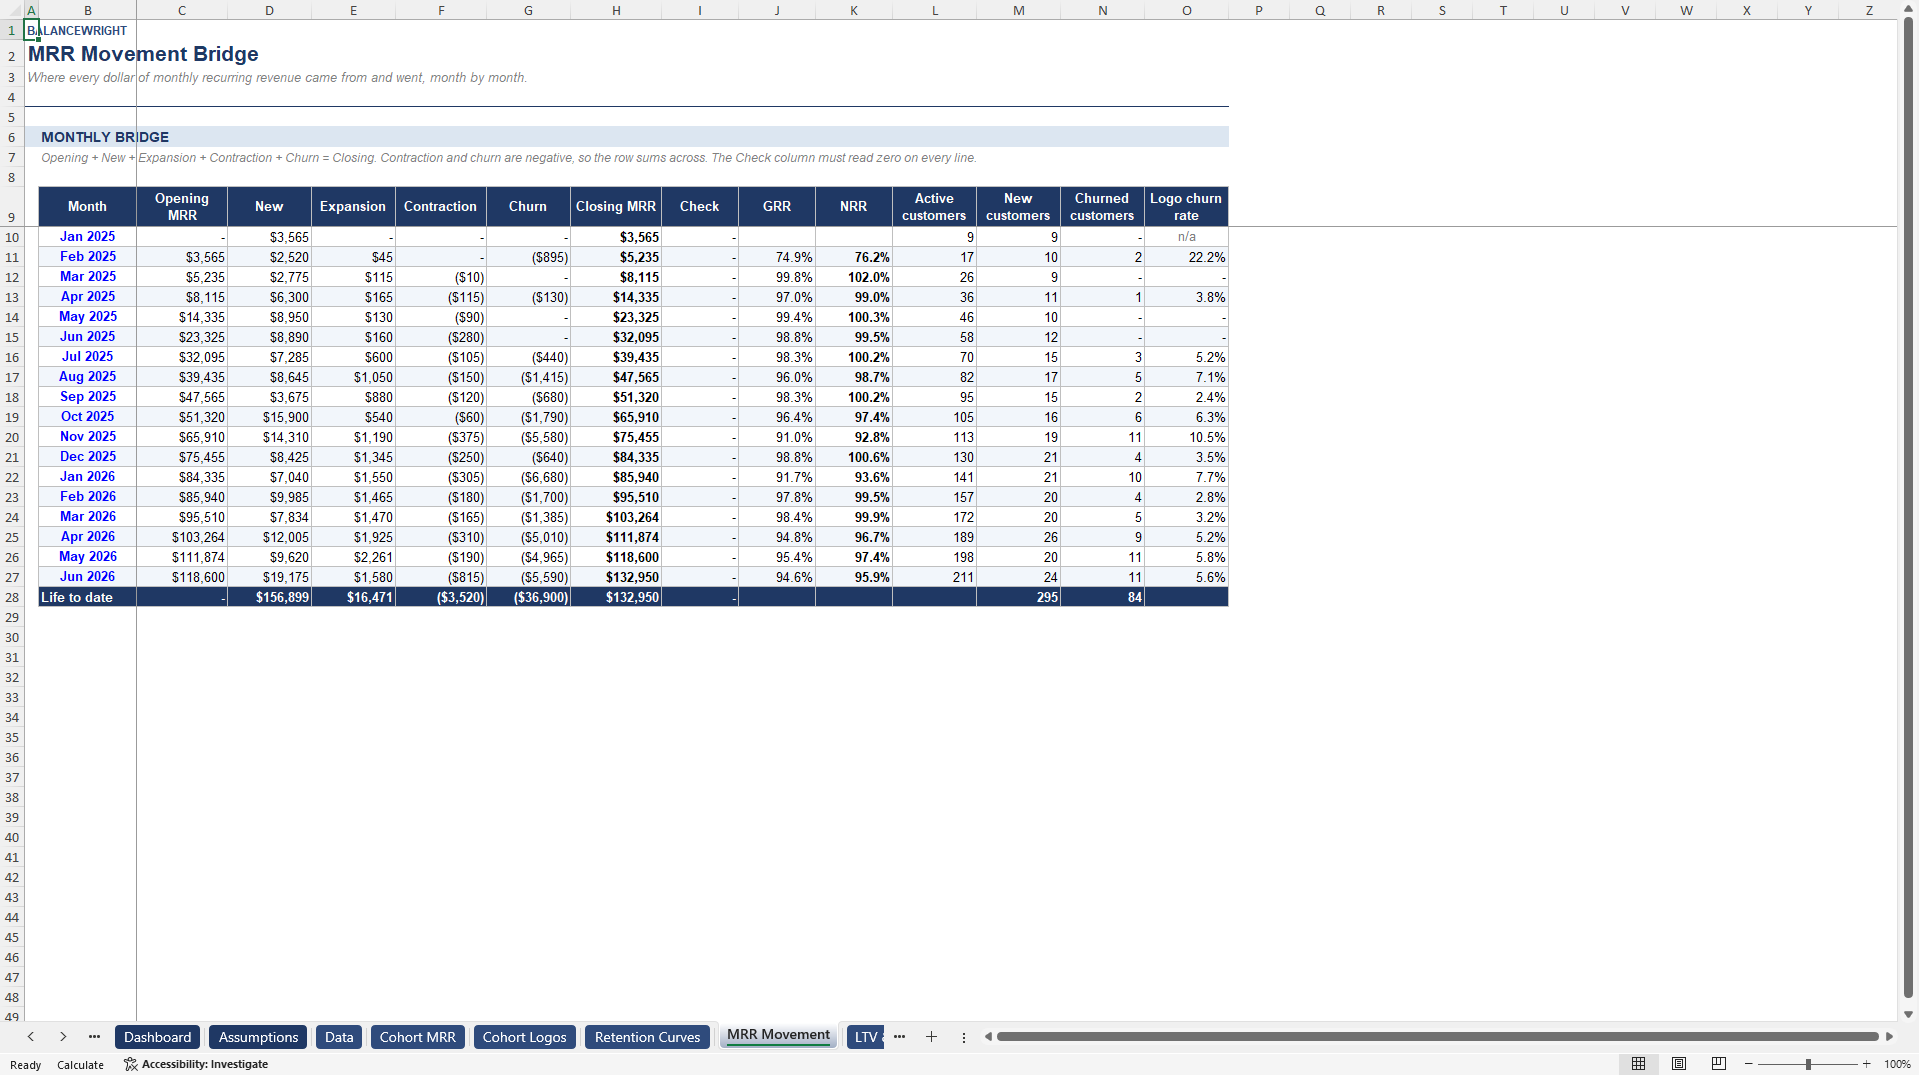
AN MRR MOVEMENT BRIDGE. Opening, new, expansion, contraction, churn and closing MRR for every month, with gross and net revenue retention alongside. A dedicated Check column proves the bridge ties on every single line, so nothing leaks silently between months.
UNIT ECONOMICS THAT SURVIVE SCRUTINY. Blended LTV, LTV to CAC and CAC payback, then the same calculation split by segment and by acquisition channel – each using its own observed churn rate and its own acquisition cost, because a single blended CAC hides the differences that actually drive decisions. LTV is discounted, not the naive ARPA-over-churn figure that overstates value.
A SCENARIO-DRIVEN FORECAST. Up to 24 months forward from your last actual month, with base, upside and downside cases switched by a single cell.
EIGHT INTEGRITY CHECKS. A separate tab that tests the bridge, the cohort reconciliation, the cohort assignment and five other things that are easy to get wrong. Every line must read PASS before you present a number. Most templates ask you to trust them; this one shows its working.
Everything is a live Excel formula – more than 13,700 of them. There are no macros, no add-ins, no external links, no password protection and no locked cells, so every calculation is open to inspection and the file opens identically in Excel, LibreOffice, Numbers and Google Sheets. It ships loaded with a realistic 295-customer, 18-month sample dataset so every tab works the moment you open it. Delete it and paste your own.
Written for RevOps and finance teams at subscription and SaaS companies, for the operating partners and analysts who have to underwrite them, and for consultants who would rather not rebuild a cohort model from scratch for every engagement.
The secondary document is a five-page PDF guide. It covers the exact data format the model expects, the calculation methodology behind every headline metric, a walkthrough of the eight integrity checks, and an honest account of what the model cannot do.
Got a question about the product? Email us at support@flevy.com or ask the author directly by using the "Ask the Author a Question" form. If you cannot view the preview above this document description, go here to view the large preview instead.
Source: Best Practices in Revenue Management, Subscription Excel: Subscription Cohort, Churn & Retention Analyzer (NRR/GRR) Excel (XLSX) Spreadsheet, Paweł Dudek, Balancewright
ABOUT THE AUTHOR

Balancewright is Paweł Dudek. The catalogue covers project finance, fund and waterfall structures, corporate three-statement forecasting, working capital, valuation and FP&A -- built as working models rather than formatted templates.
Every model is formula-driven end to end. No locked cells, no passwords, no macros and no external links, so any calculation can be inspected, adapted and
... [read more]
Ask the Author a Question
You must be logged in to contact the author.




























