
Subscription Box Business (Startup) 10-Year Financial Model – Excel XLSX
Excel (XLSX)
BENEFITS OF THIS DOWNLOADABLE EXCEL DOCUMENT
- Provides a framework for modeling subscriber growth, churn dynamics, and unit economics across a full 10-year subscription box business forecast.
- Delivers an investor-ready 3-statement financial model purpose-built for subscription box founders, DTC operators, and ecommerce growth teams.
- Enables complete financial visibility across acquisition costs, fulfillment margins, and recurring revenue -- from first subscriber to Series B.
SUBSCRIPTION EXCEL DESCRIPTION
Curated by McKinsey-trained Executives
🎁 Subscription Box Business – 10-Year Advanced Integrated 3-Statement Financial Model
Stop guessing. Start scaling. Build the exact financial infrastructure that venture-backed subscription box companies, DTC growth operators, and Series A-ready founders use to model subscriber growth, project cash burn, and walk into investor meetings with institutional confidence.
Whether you're a subscription box founder planning your next funding round, a DTC operator stress-testing your churn assumptions, an ecommerce investor underwriting a subscription brand acquisition, a CFO structuring your first formal financial plan, a growth marketer modeling CAC payback against LTV, or an accelerator mentor helping a cohort company build a defensible financial narrative – this fully integrated 3-Statement Financial Model gives you the exact analytical infrastructure to acquire subscribers, manage inventory, control burn, and grow recurring revenue with complete financial precision.
💡 What's Inside
This model covers every financial dimension of building and scaling a subscription box business – from your first 500 subscribers through a 10-year path to 60,000+ active customers, profitability, and venture-fundable unit economics. Built on Financial Modeling World Cup best practices, it's fully dynamic, cross-linked across 16 tabs, and ready to customize for your specific product category, pricing tier, acquisition channel mix, and investor requirements.
📥 Inputs
• 🎯 3-Tier Subscription Pricing Engine – Separate modeling for Basic, Premium, and VIP subscription plans, each with individual monthly price, subscriber mix percentage, and annual price increase assumption – plus a blended average price calculation and add-on revenue per subscriber layer – every dollar of revenue traced back to its plan tier and pricing assumption, fully configurable from a single Assumptions tab
• 📈 Subscriber Growth & Cohort Dynamics Engine – Month-by-month subscriber flow modeling across 36 monthly periods plus 7 annual periods, with separate new subscriber tracking across Paid Acquisition, Organic, and Referral channels – configurable monthly churn rate by stage (Year 1 / Years 2–3 / Year 4+), retention rate, referral multiplier, and organic growth compounding – ending subscriber count driving every revenue, COGS, and unit economics calculation automatically
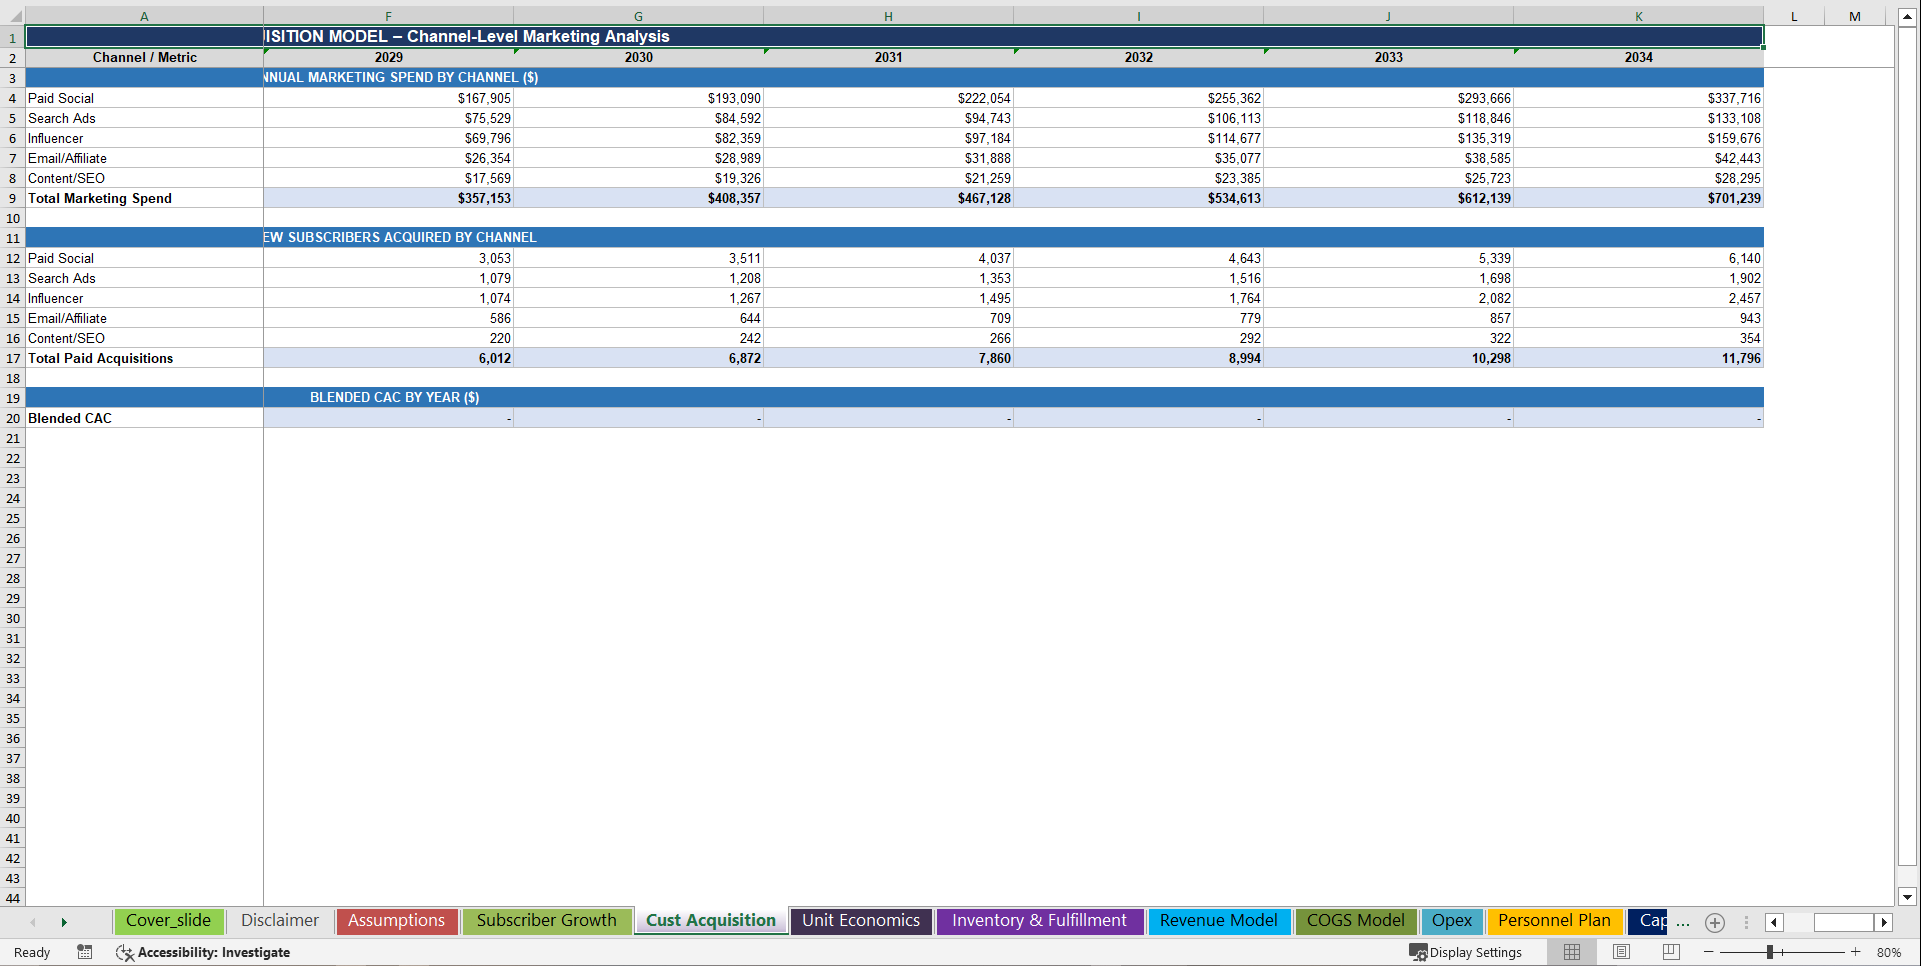
• 🔗 5-Channel Customer Acquisition Architecture – Paid Social (Facebook/Instagram/TikTok), Search Ads (Google/Bing), Influencer & Creator Marketing, Email & Affiliate, and Content/SEO – each with individual Year 1 monthly spend, channel-level CAC, and annual spend growth rate – blended CAC by year, total paid acquisitions by channel, and marketing efficiency tracked across all 10 years
• 📦 Per-Box COGS & Inventory Fulfillment Stack – Product Cost, Packaging, Shipping & Postage, and Fulfillment Labor modeled individually per box with separate annual cost inflation assumptions – total COGS per box, boxes shipped, gross margin percentage, inventory days on hand, accounts payable days, and working capital cycle fully reconciled – every dollar of cost traced to its operational root cause
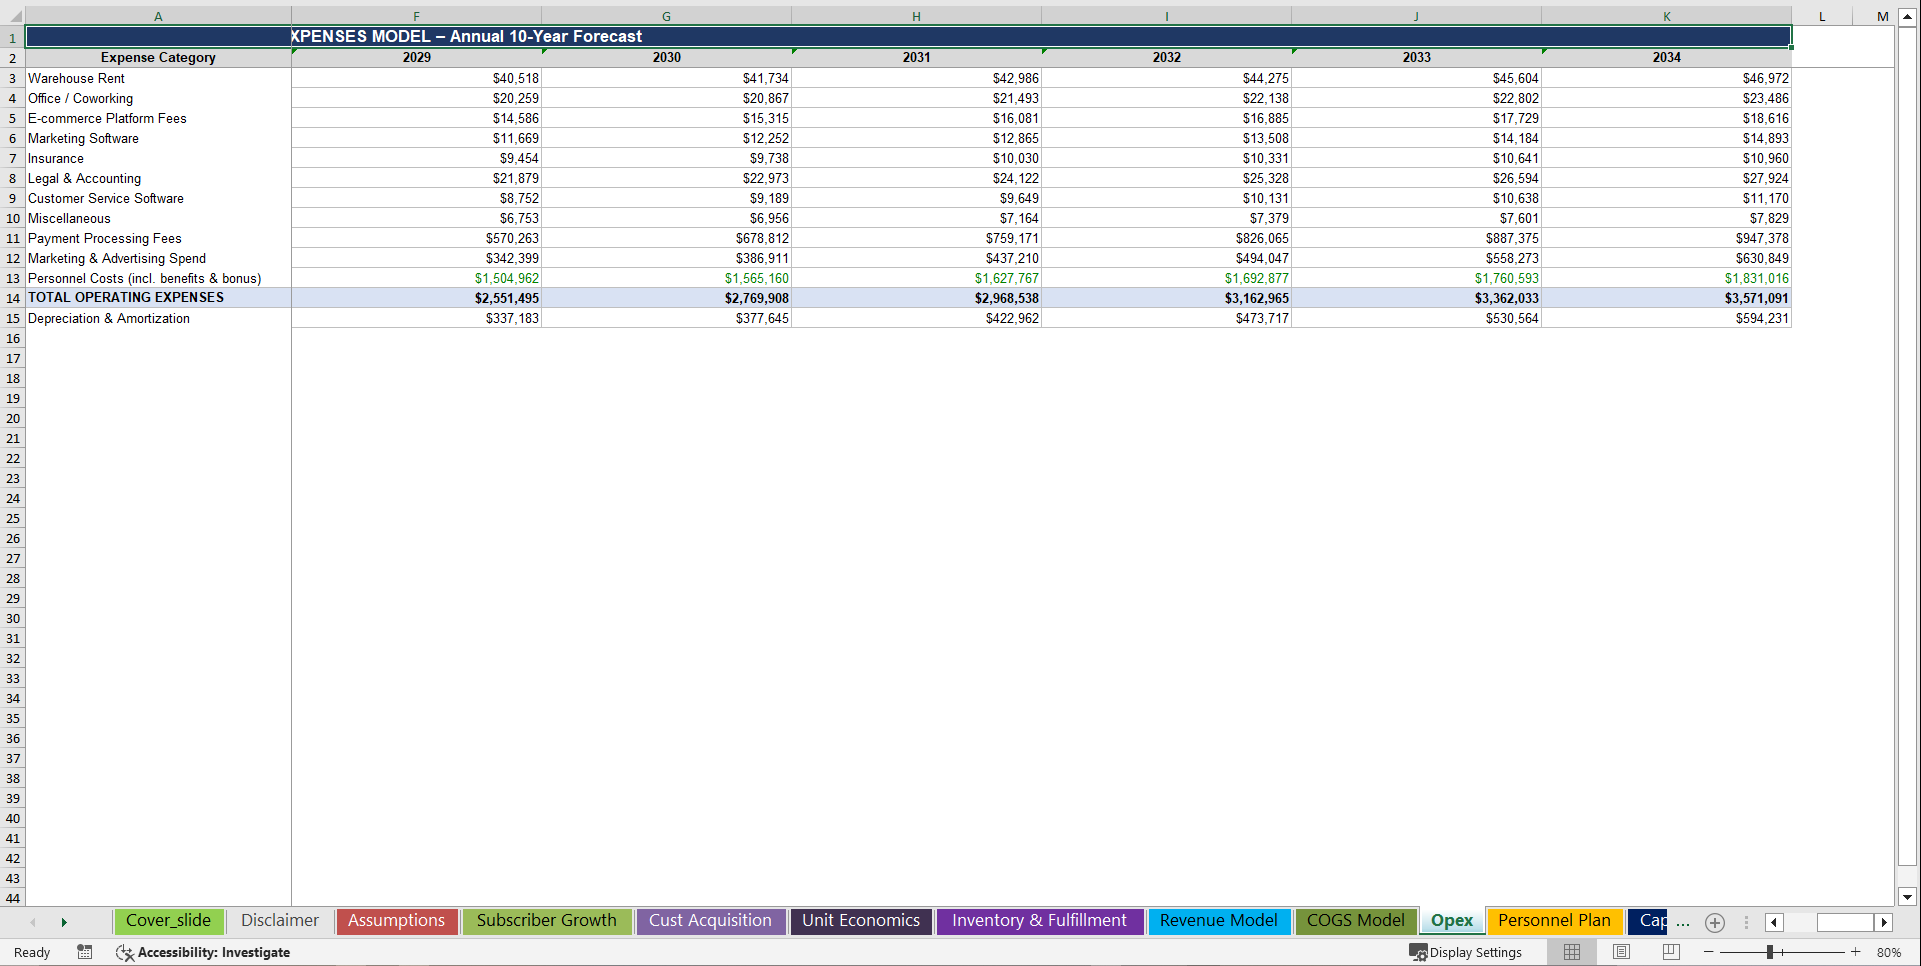
• 💼 Multi-Layer Operating Expense Architecture – Warehouse Rent, Office & Coworking, E-commerce Platform Fees, Marketing Software, Payment Processing (as % of revenue), Insurance, Legal & Accounting, Customer Service Software, and Miscellaneous – each line individually driven with its own Year 1 baseline and annual growth rate – plus variable Payment Processing tied directly to revenue – total OpEx, EBITDA, and operating leverage tracked across all 10 years
• 👥 17-Role Personnel Plan with Full Compensation Stack – CEO, COO, CFO, Supply Chain Manager, Fulfillment Manager, Warehouse Associates (×3), Head of Growth, Social Media Manager, Partnerships Manager, Content Marketer, Customer Support Lead, Support Agents (×2), Tech/Dev Lead, and Product Manager – each with individual hire year, base salary, 4% annual raise, 20% benefits load, and 8% bonus – total personnel cost, YoY headcount additions, and compensation growth tracked across all 10 years
• 🏗️ Equity & Debt Capital Structure – Founder Capital, Pre-Seed/Angel, Seed Round, Series A, and Series B modeled individually with raise amount and timing year – plus optional Startup Loan and Working Capital Credit Line with configurable interest rate and repayment schedule – cumulative capital raised, equity by round, and debt service modeled across all 10 years
• 🔒 Working Capital & Inventory Management Framework – Configurable inventory days on hand, accounts receivable days, accounts payable days, minimum cash buffer, and initial cash balance – working capital cycle fully integrated into the Cash Flow Statement indirect method – cash runway, burn rate, and liquidity position tracked annually
📤 Outputs
• 📊 10-Year Fully Integrated 3-Statement Financial Model – Income Statement, Balance Sheet, and Cash Flow Statement fully cross-linked and auto-balancing across all 10 years – change one assumption in the Assumptions tab and every statement updates instantly across all 16 tabs
• 🎯 Multi-Channel Subscriber Growth Model with Full Cohort Transparency – Monthly new subscriber projections broken across Paid, Organic, and Referral channels – churn and retention dynamics applied at the period level – ending subscriber count, net growth rate, and retention rate calculated every month for Years 1–3 and annually for Years 4–10
• 💼 Fully Integrated Income Statement with Full Margin Stack – Subscription Revenue, Add-On Revenue, Total Revenue, COGS broken to component level, Gross Profit, Gross Margin %, Personnel Costs, Marketing & Advertising, G&A, Technology & Platform, Total Operating Expenses, EBITDA, EBITDA Margin %, D&A, EBIT, Interest Expense, Pre-Tax Income, Income Tax, Net Income, and Net Income Margin – every line cross-linked and formula-driven
• 🏛️ Institutional-Grade Balance Sheet with Working Capital Integration – Cash & Cash Equivalents (linked from Cash Flow), Accounts Receivable, Inventory, Prepaid & Other Current Assets, Net PP&E, Intangible Assets – Accounts Payable, Accrued Liabilities, Deferred Revenue, Current Debt, Long-Term Debt – Paid-In Capital, Retained Earnings, Total Equity – auto-balancing check row confirming assets equal liabilities plus equity across all 10 years
• 🔄 Cash Flow Statement – Full Indirect Method – Net Income, D&A add-back, working capital movements across AR/Inventory/AP, Cash from Operations – CapEx and technology investment, Cash from Investing – equity raises by round, debt drawn and repaid, Cash from Financing – Net Change in Cash, Beginning Cash, Ending Cash reconciled to Balance Sheet with zero variance
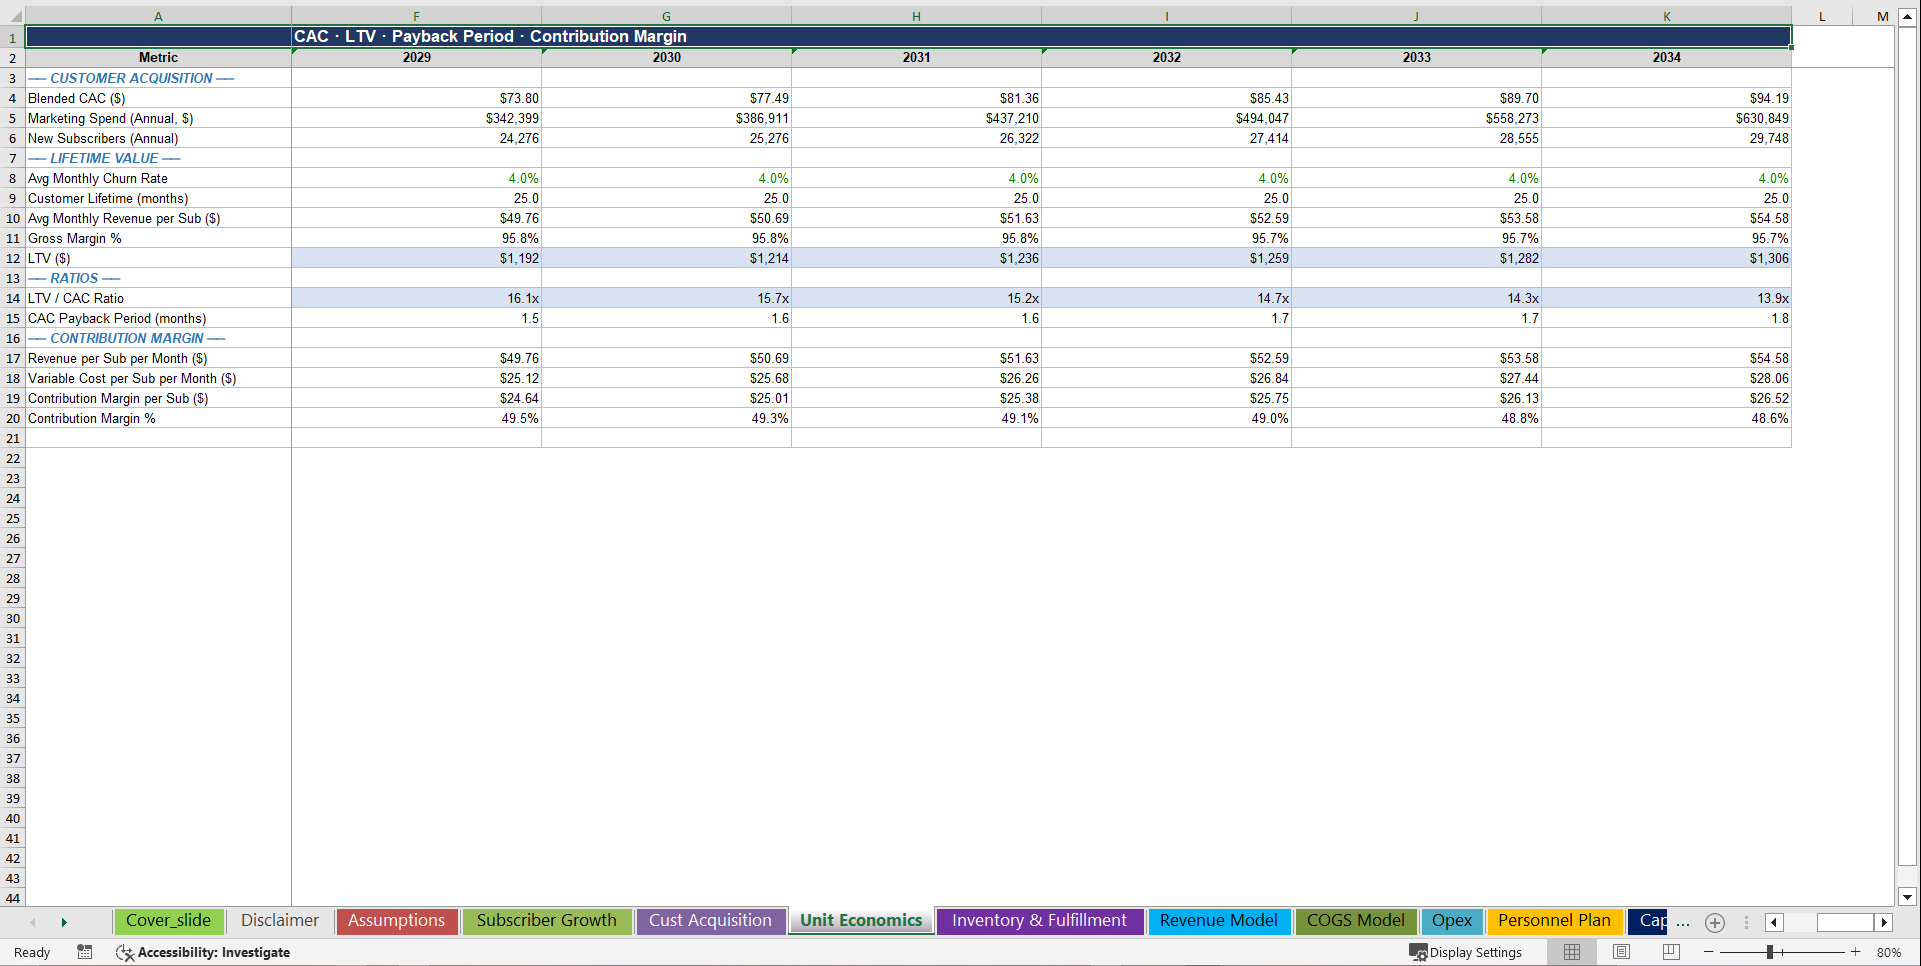
• 📦 Unit Economics Engine – Blended CAC by year, Customer Lifetime (1/churn), LTV calculated as Revenue × Gross Margin × Lifetime, LTV/CAC Ratio, CAC Payback Period in months, Revenue per Sub per Month, Variable Cost per Sub, Contribution Margin per Sub, and Contribution Margin % – all 10 years, all formula-driven
• 📐 Sensitivity & Scenario Analysis – 7×7 churn rate vs. subscription price matrix showing Year 5 revenue across 49 scenarios – 7×7 CAC vs. gross margin matrix showing LTV/CAC ratio across 49 scenarios – color-scaled green/red heat maps for instant at-a-glance risk assessment – plus Bear / Base / Bull scenario definitions with 7 configurable parameters
• 📊 Executive Dashboard with 6 Live Charts & 12 KPI Cards – Subscriber Growth line chart, Revenue vs. Gross Profit bar chart, EBITDA & Net Income bar chart, CAC vs. LTV line chart, Gross Margin % trend line, and Monthly Churn Rate trend line – plus 12 KPI cards covering Year 1/5/10 Subscribers, Year 1/5/10 ARR, Year 1 CAC, Year 5 LTV, LTV/CAC Ratio, Gross Margin, EBITDA Margin, and Year 10 Net Income – all auto-updating from a single Assumptions tab
🏆 Why This Model Stands Out
✅ Fully integrated across 16 tabs – every sheet talks to every other sheet. Change the churn rate in Assumptions and the entire model updates instantly across subscriber growth, revenue, COGS, unit economics, the income statement, balance sheet, cash flow, and the executive dashboard
✅ Investor and board-ready – structured and formatted to answer the exact questions venture capital investors, angel syndicates, accelerator partners, and ecommerce growth boards ask on day one: What is the LTV/CAC ratio? What is the CAC payback period? When does the business reach EBITDA breakeven? What is the subscriber count at Series A?
✅ Subscription box industry realistic – built around how subscription businesses actually generate and protect revenue: churn compressing as cohorts mature, CAC efficiency improving as organic and referral channels scale, gross margin expanding as supplier negotiations improve with volume, and EBITDA inflecting as fixed operating leverage kicks in – not generic SaaS metrics recycled into a box business template
✅ Institutional color-coding throughout – blue inputs, black formulas, green cross-sheet links – Financial Modeling World Cup color conventions applied throughout, so any investor, CFO, board member, or due diligence analyst can open it and immediately trace every number to its source and audit every formula without a guide
✅ Fully unlocked – no protected sheets, no black-box formulas, no hidden logic. Every assumption is visible. Every formula is auditable. Own it, customize it, present it to any venture capital firm, angel investor, accelerator partner, strategic acquirer, or financial advisor with complete confidence
📋 Model Structure – 16 Sheets
• Assumptions – Every input centralized: 80+ individually configurable drivers covering all 3 subscription tiers, churn and retention rates, 5 acquisition channels, per-box COGS components, 9 OpEx categories, 17-role personnel plan, capital raise schedule, debt terms, working capital thresholds, and scenario parameters – all blue-coded for instant editing
• Subscriber Growth – 36 monthly + 7 annual periods; beginning/new (paid + organic + referral)/churned/ending subscriber flow with churn rate, net growth rate, and retention rate calculated every period
• Customer Acquisition Model – 5-channel marketing spend schedule, channel-level CAC, annual paid acquisitions by channel, blended CAC by year, and total marketing efficiency tracked across all 10 years
• Unit Economics – CAC, Customer Lifetime, LTV, LTV/CAC ratio, CAC Payback Period, contribution margin per subscriber, and contribution margin % across all 10 years
• Inventory & Fulfillment Model – Boxes shipped, COGS per box, total COGS, average inventory on hand, inventory turnover, accounts payable, days payable outstanding, and gross margin % annually
• Revenue Model – Active subscribers (avg), blended monthly price, subscription revenue, add-on revenue, and total revenue – monthly for Years 1–3 and annual for Years 4–10
• COGS Model – Product cost, packaging, shipping, and fulfillment labor per box with cost inflation – total COGS, COGS per box, and gross margin % monthly for Years 1–3 and annual for Years 4–10
• Operating Expenses – 9-category OpEx with individual baseline and growth rates, payment processing tied to revenue, marketing spend, and personnel costs linked from Personnel Plan – total OpEx and D&A annually
• Personnel Plan – 17-role org chart across Leadership, Operations, Marketing, Customer Experience, and Technology – individual hire year, base salary, annual raise, benefits, and bonus – total headcount and compensation cost across all 10 years
• Capital Raise Model – 5 equity funding rounds individually timed and sized, cumulative capital raised, and equity deployment by year
• Debt Schedule – Startup loan draw, annual repayment schedule, interest expense, and ending debt balance across all 10 years
• Income Statement – Full P&L from Total Revenue through Net Income with Gross Margin %, EBITDA Margin %, and Net Income Margin % – 10-year annual view
• Balance Sheet – Full asset, liability, and equity stack with auto-balancing check confirming financial integrity across all 10 years
• Cash Flow Statement – Full indirect method with working capital movements, CapEx, equity raises, debt service, and ending cash reconciled to Balance Sheet – 10-year annual view
• Sensitivity Analysis – Two 7×7 color-scaled heat maps plus 3-scenario definitions with 7 configurable parameters each
• Executive Dashboard – 6 live charts + 12 KPI cards auto-updating from a single Assumptions tab
Key Words:
Strategy & Transformation, Growth Strategy, Strategic Planning, Strategy Frameworks, Innovation Management, Pricing Strategy, Core Competencies, Strategy Development, Business Transformation, Marketing Plan Development, Product Strategy, Breakout Strategy, Competitive Advantage, Mission, Vision, Values, Strategy Deployment & Execution, Innovation, Vision Statement, Core Competencies Analysis, Corporate Strategy, Product Launch Strategy, BMI, Blue Ocean Strategy, Breakthrough Strategy, Business Model Innovation, Business Strategy Example, Corporate Transformation, Critical Success Factors, Customer Segmentation, Customer Value Proposition, Distinctive Capabilities, Enterprise Performance Management, KPI, Key Performance Indicators, Market Analysis, Market Entry Example, Market Entry Plan, Market Intelligence, Market Research, Market Segmentation, Market Sizing, Marketing, Michael Porter's Value Chain, Organizational Transformation, Performance Management, Performance Measurement, Platform Strategy, Product Go-to-Market Strategy, Reorganization, Restructuring, SWOT, SWOT Analysis, Service 4.0, Service Strategy, Service Transformation, Strategic Analysis, Strategic Plan Example, Strategy Deployment, Strategy Execution, Strategy Frameworks Compilation, Strategy Methodologies, Strategy Report Example, Value Chain, Value Chain Analysis, Value Innovation, Value Proposition, Vision Statement, Corporate Strategy, Business Development, Business plan pdf, business plan, PDF, Business Plan DOC, Business Plan Template, PPT, Market strategy playbook, strategic market planning, competitive analysis tools, market segmentation frameworks, growth strategy templates, product positioning strategy, market execution toolkit, strategic alignment playbook, KPI and OKR frameworks, business growth strategy guide, cross-functional strategy templates, market risk management, market strategy PowerPoint doc, guide, ebook, e-book ,McKinsey Change Playbook, Organizational change management toolkit, Change management frameworks 2025, Influence model for change, Change leadership strategies, Behavioral change in organizations, Change management PowerPoint templates, Transformational leadership in change, supply chain KPIs, supply chain KPI toolkit, supply chain PowerPoint template, logistics KPIs, procurement KPIs, inventory management KPIs, supply chain performance metrics, manufacturing KPIs, supply chain dashboard, supply chain strategy KPIs, reverse logistics KPIs, sustainability KPIs in supply chain, financial supply chain KPIs, warehouse KPIs, digital supply chain KPIs, 1200 KPIs, supply chain scorecard, KPI examples, supply chain templates, Corporate Finance SOPs, Finance SOP Excel Template, CFO Toolkit, Finance Department Procedures, Financial Planning SOPs, Treasury SOPs, Accounts Payable SOPs, Accounts Receivable SOPs, General Ledger SOPs, Accounting Policies Template, Internal Controls SOPs, Finance Process Standardization, Finance Operating Procedures, Finance Department Excel Template, FP&A Process Documentation, Corporate Finance Template, Finance SOP Toolkit, CFO Process Templates, Accounting SOP Package, Tax Compliance SOPs, Financial Risk Management Procedures.
NOTE: Our digital products are sold on an "as is" basis, making returns and refunds unavailable post-download. Please preview and inquire before purchasing. Please contact us before purchasing if you have any questions! This policy aligns with the standard Flevy Terms of Usage.
Got a question about the product? Email us at support@flevy.com or ask the author directly by using the "Ask the Author a Question" form. If you cannot view the preview above this document description, go here to view the large preview instead.
Source: Best Practices in Subscription, Integrated Financial Model Excel: Subscription Box Business (Startup) 10-Year Financial Model Excel (XLSX) Spreadsheet, SB Consulting
ABOUT THE AUTHOR
SB Consulting is dedicated to empowering businesses to communicate their ideas with impact. This consulting firm specializes in teaching organizations how to create effective corporate and management presentations. With training from top-tier global consulting firms, including McKinsey, BCG, and Porsche Consulting, extensive expertise in presentation design and ... [read more]
Ask the Author a Question
You must be logged in to contact the author.
