 Click main image to view in full screen.
Startup Financial Model with Cap Table and Scenarios – Excel XLSX
Excel (XLSX)


BENEFITS OF THIS DOWNLOADABLE EXCEL DOCUMENT
- Builds a 36-month three-statement plan that balances every month.
- Shows runway, burn, break-even month and the funding you still need.
- Tracks dilution across up to 5 equity rounds and 3 loans in a built-in cap table.
ENTREPRENEURSHIP EXCEL DESCRIPTION
A 36-month three-statement financial model for early-stage companies that need a credible plan for investors, banks or their own board. It connects revenue, hiring, operating costs, assets, working capital, equity and debt into an income statement, cash flow statement and balance sheet that checks to zero every month.
What is included
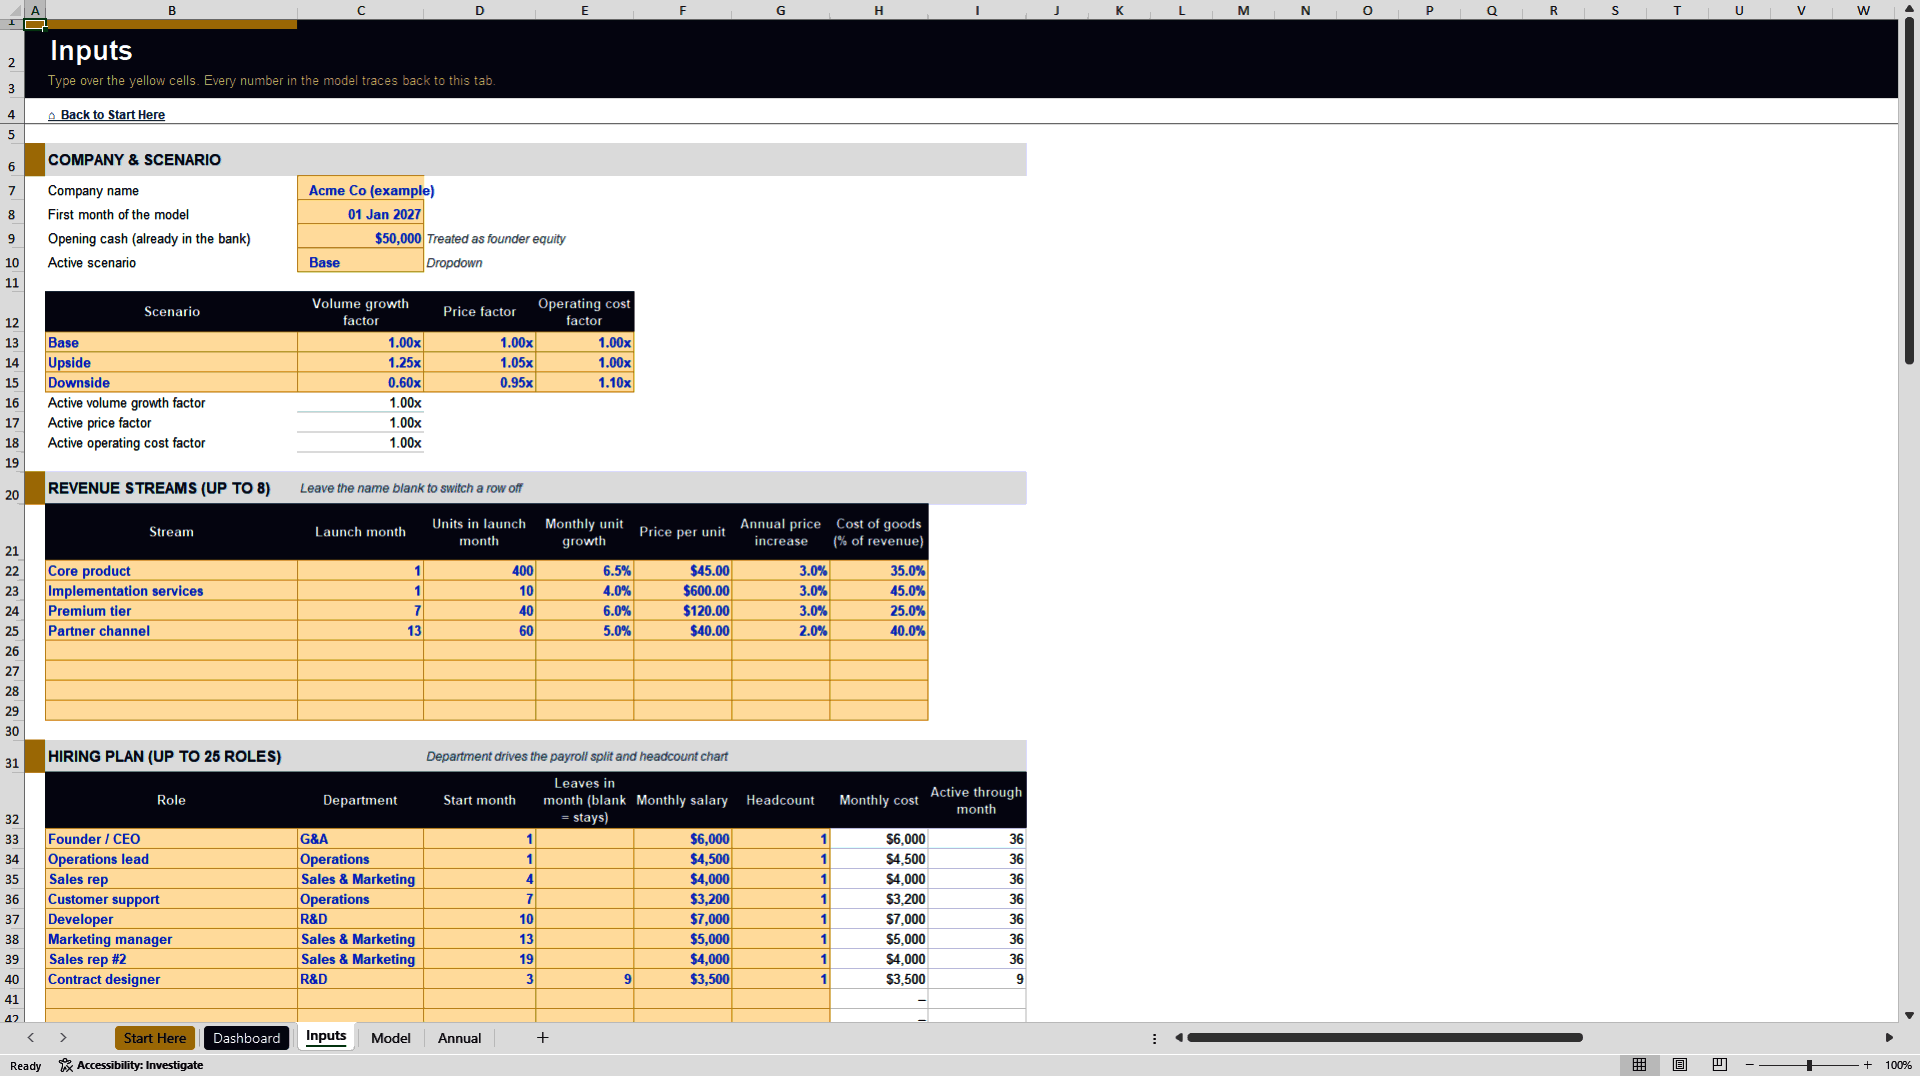
Revenue: up to 8 revenue streams, each with its own launch month, units, growth, pricing and cost of goods.
Team: a hiring plan for up to 25 roles across 4 departments with salary, start month and the month a role ends, plus payroll taxes and benefits.
Costs and assets: 12 operating cost lines and up to 6 depreciating assets, plus receivables, inventory and payables.
Funding: a cap table for up to 5 equity rounds with pre-money, post-money, investor share and founders' stake after each round, and up to 3 loans.
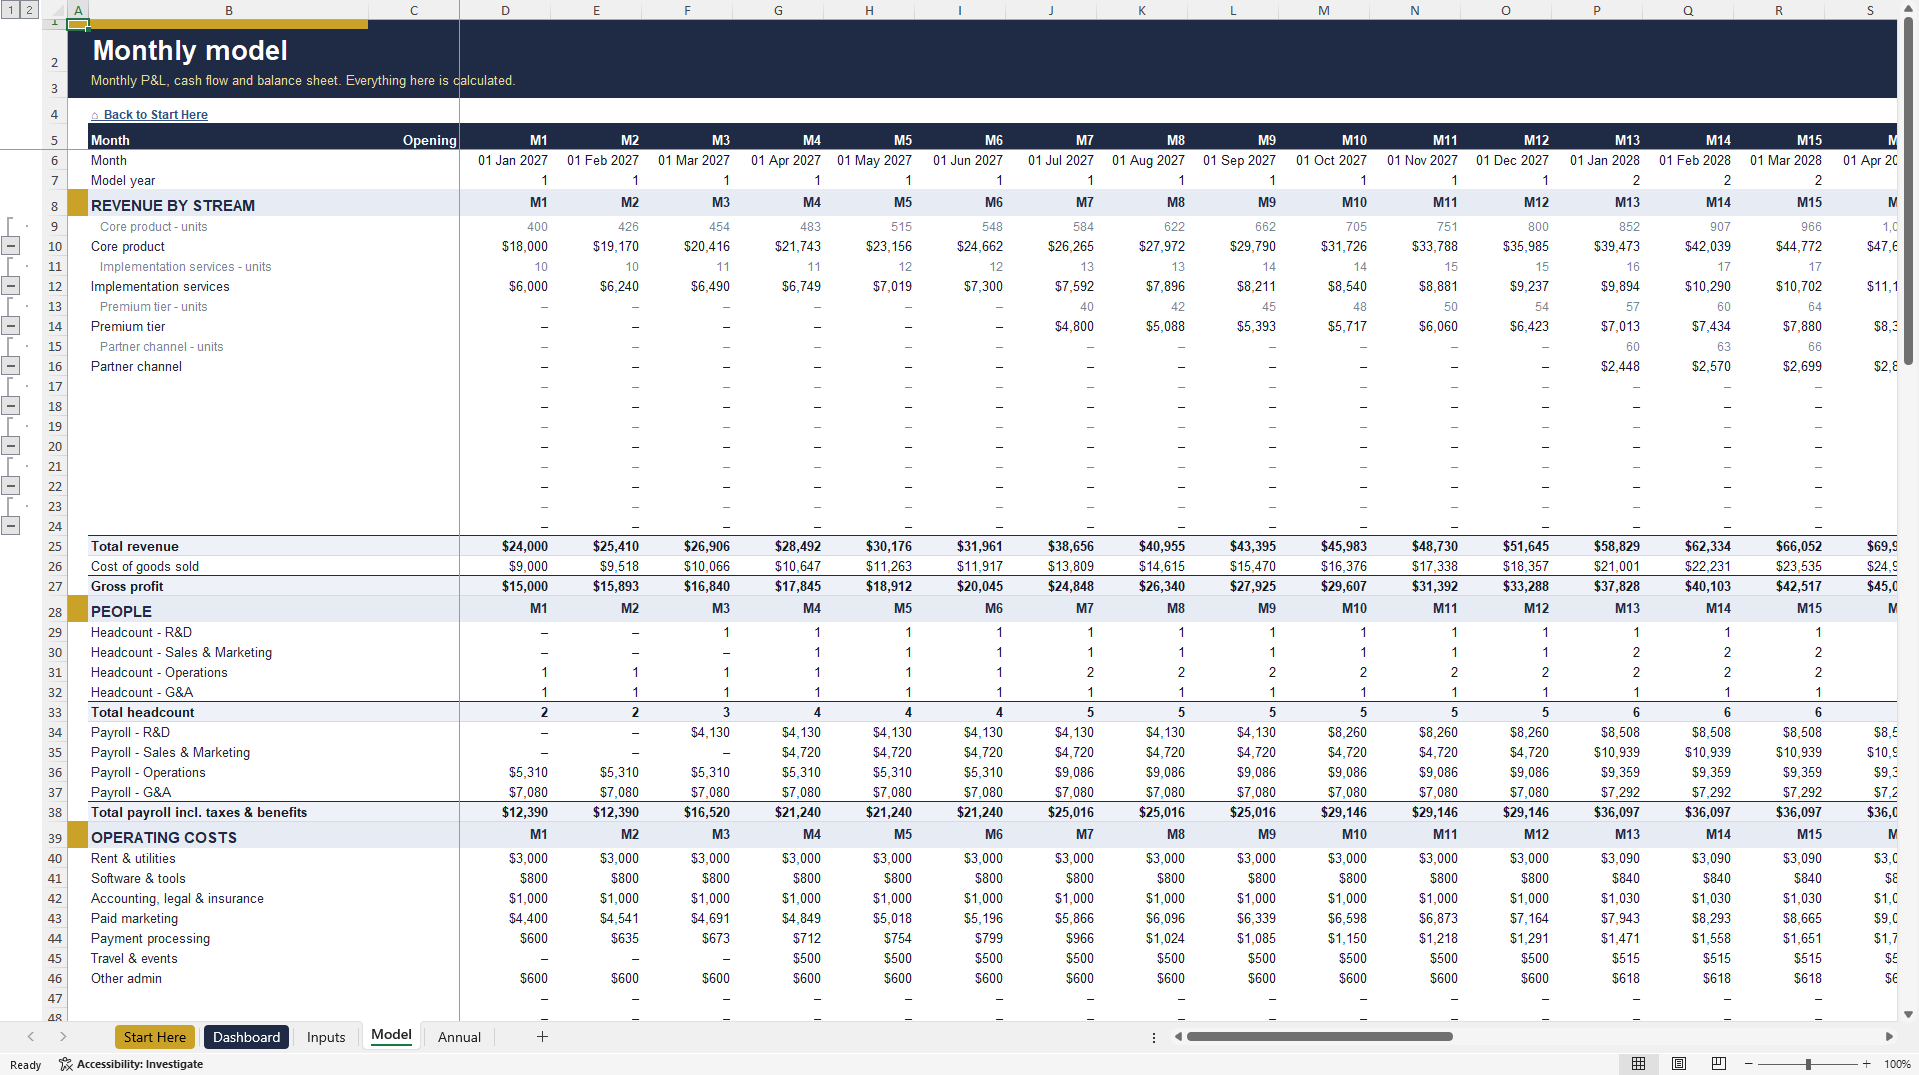
Monthly model: revenue by stream, headcount and payroll by department, a full P&L from revenue to net income, working capital, cash flow and balance sheet.
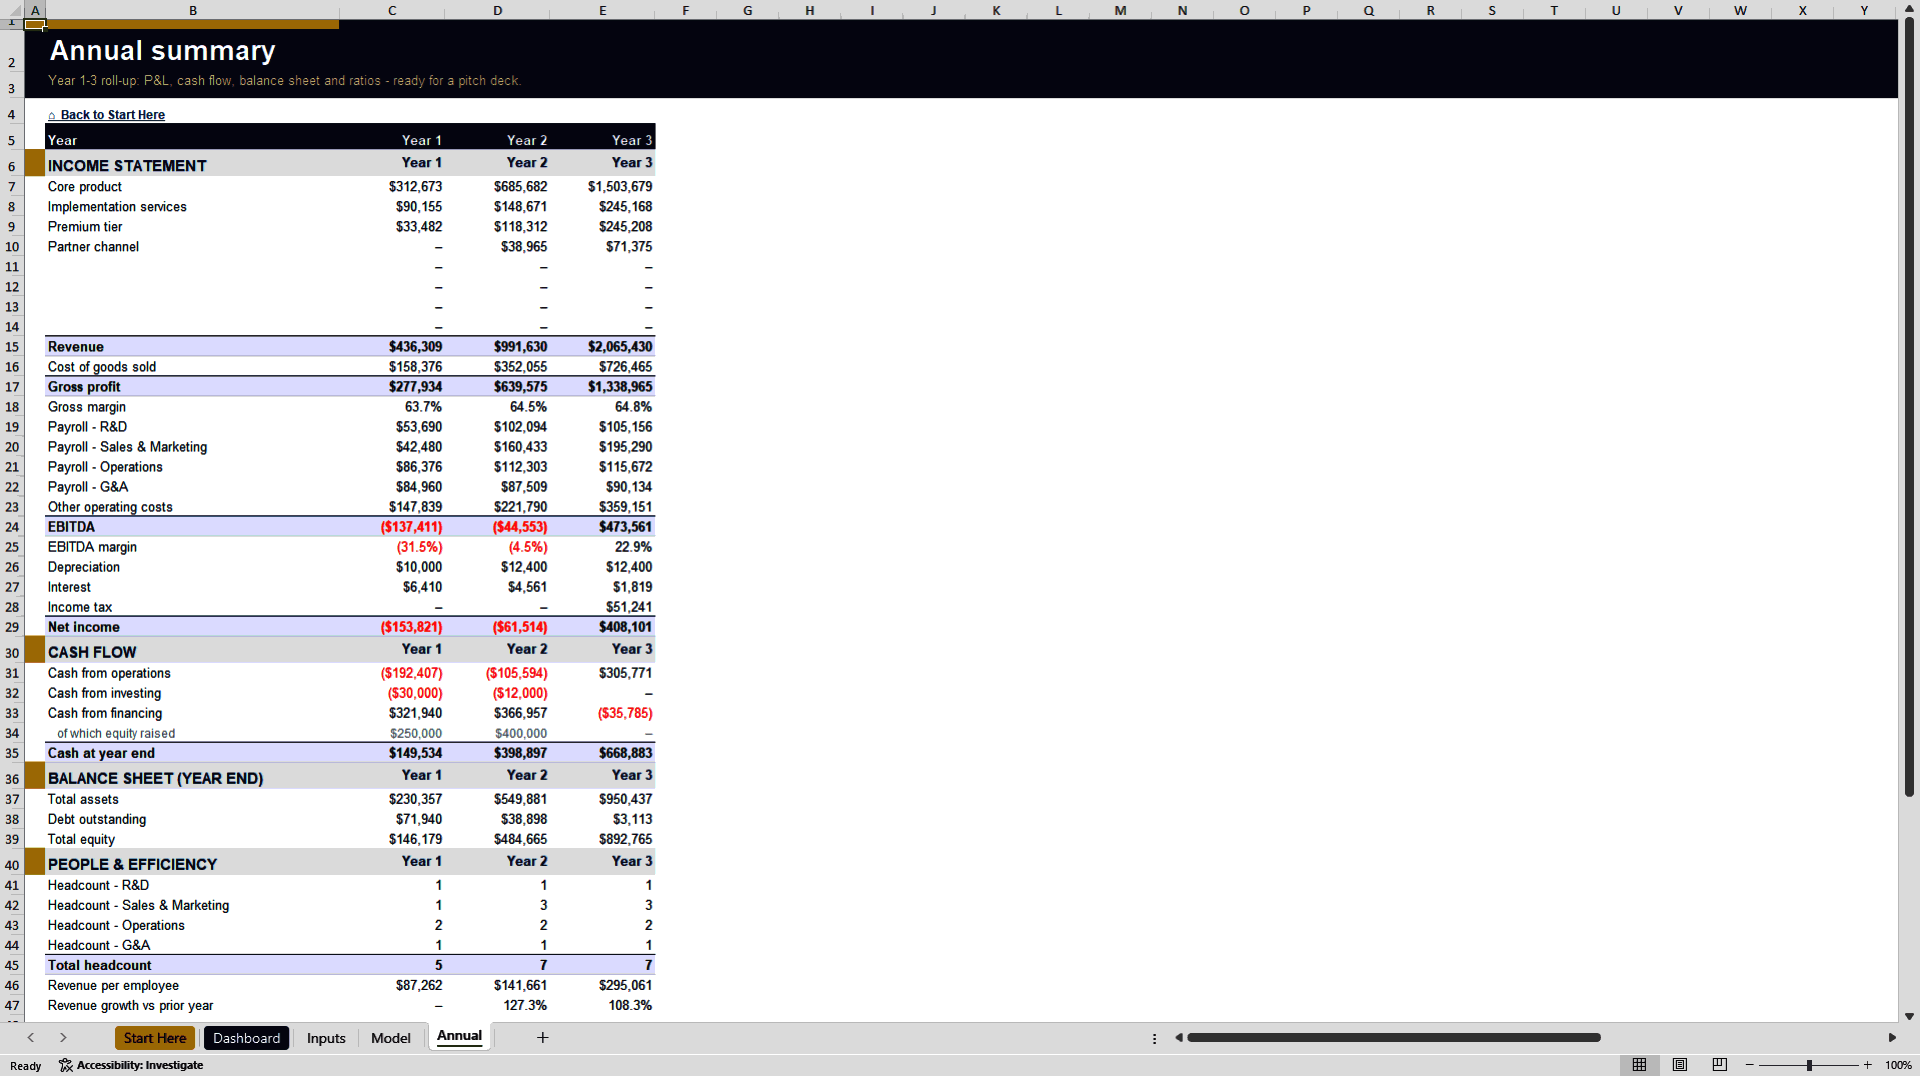
Annual summary: an investor-ready Year 1 to Year 3 view.
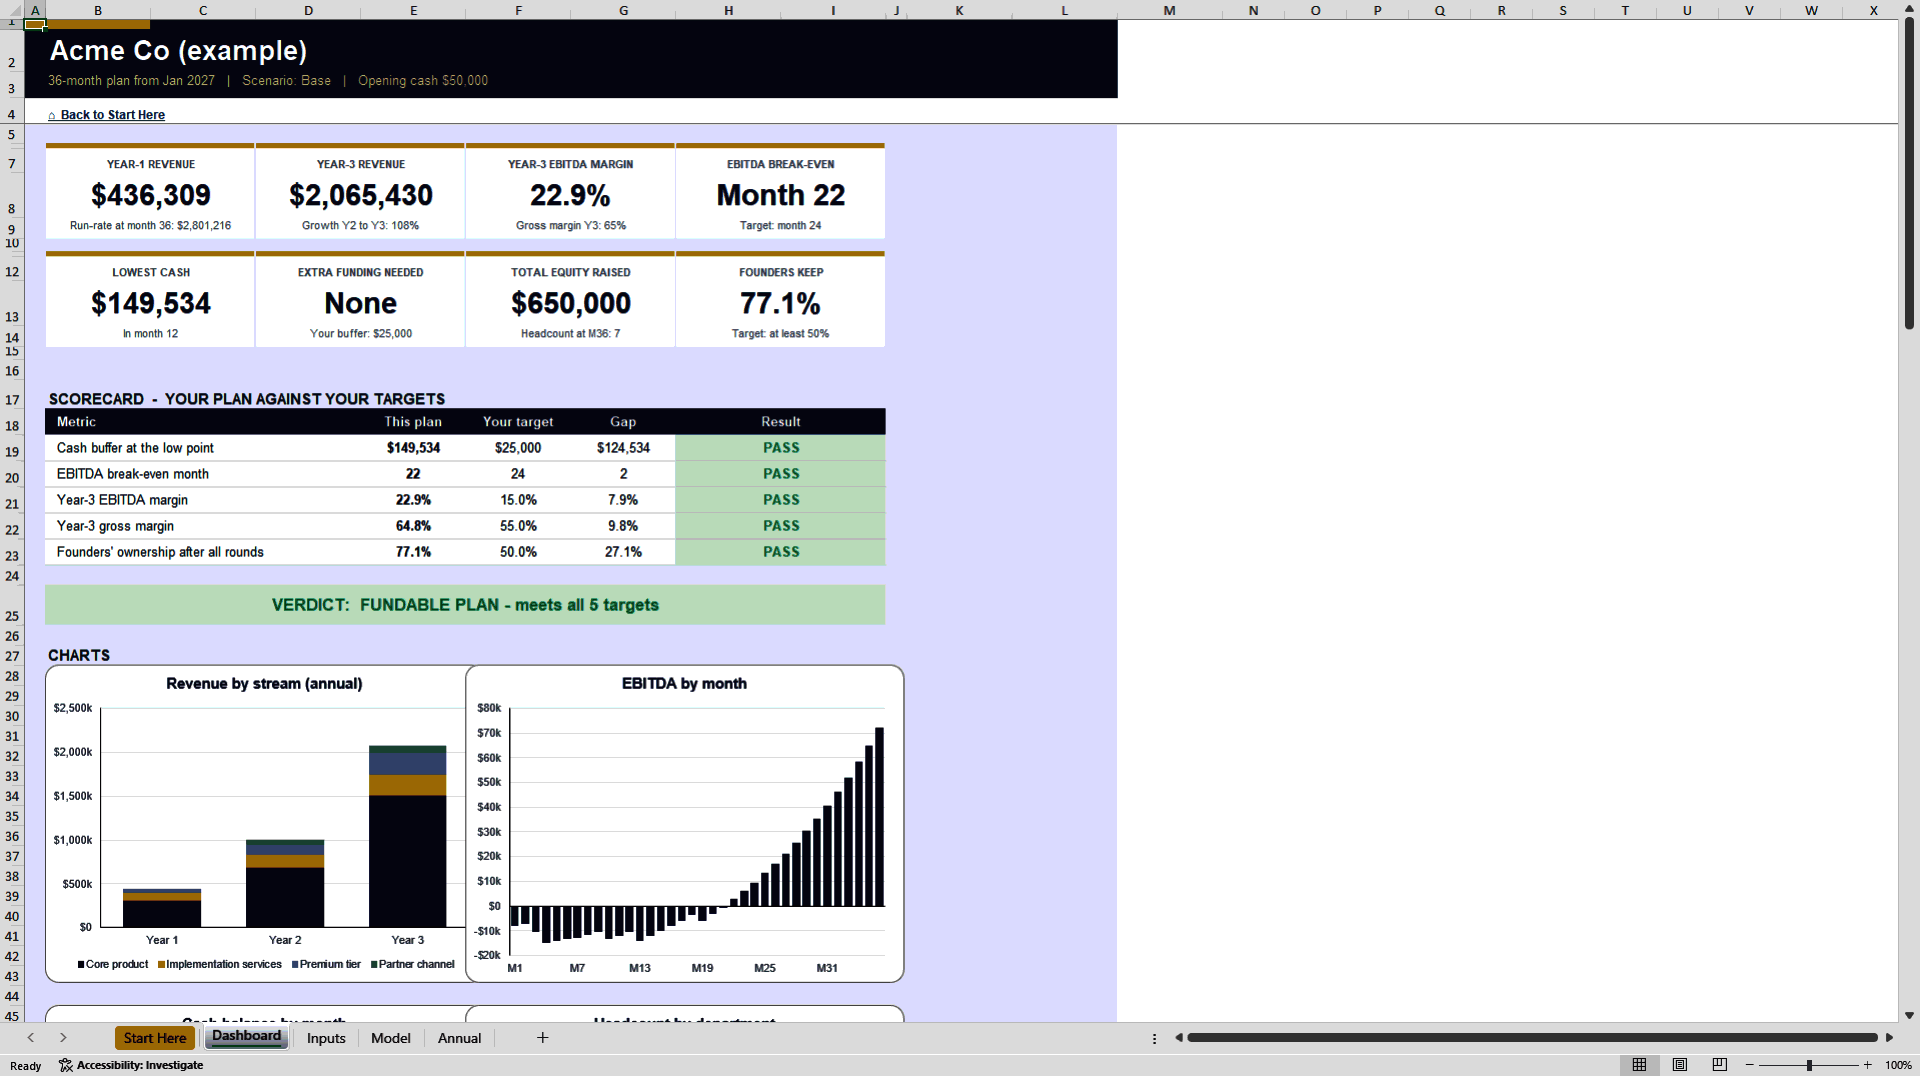
Dashboard: runway, burn, break-even month, lowest cash point, funding gap, a 5-point scorecard against your targets, a verdict and 4 charts.
How to use it
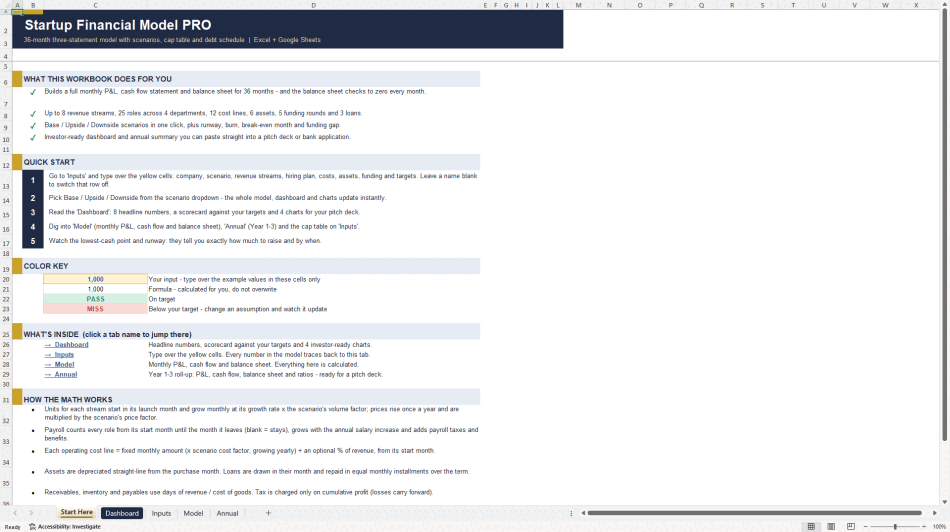
1. Open the Start Here tab: a three-step quick start, a color key and a clickable list of every sheet.
2. Replace the example values in the yellow input cells with your own. Everything else is calculated, and formulas are left visible so you can audit every step.
3. Read the Dashboard. Every number on it traces back to an input, and the scorecard compares the plan with the targets you set.
4. Switch between the Base, Upside and Downside scenarios to see what really drives the result.
Technical notes
The model is a single .xlsx workbook for Microsoft Excel 2016 or newer and Microsoft 365 on Windows and Mac. It also works in Google Sheets. There are no macros, add-ins, external links or locked cells, and it is set up to print one page wide. It ships with a complete worked example so you can see how everything fits together before entering your own numbers.
Quality: the workbook is generated from code and must pass automated tests against hand-calculated cases with zero formula errors, and it is opened and recalculated in Microsoft Excel before release. We use AI-assisted tooling in our build and testing process; the structure, logic and checks are designed and reviewed by us.
This is a planning and analysis tool, not financial, tax, legal or investment advice.
Got a question about the product? Email us at support@flevy.com or ask the author directly by using the "Ask the Author a Question" form. If you cannot view the preview above this document description, go here to view the large preview instead.
Source: Best Practices in Entrepreneurship, Integrated Financial Model Excel: Startup Financial Model with Cap Table and Scenarios Excel (XLSX) Spreadsheet, ModelDesk
ABOUT THE AUTHOR

ModelDesk builds financial models in Excel for real estate investors, founders and small-business owners: multifamily underwriting, startup and SaaS three-statement models, restaurant and food truck business plans, and contractor estimating.
Every model follows the same rules. You only type into clearly marked input cells; everything else is calculated with visible formulas, and every result
... [read more]
Ask the Author a Question
You must be logged in to contact the author.