
Search Fund & Holdco Model with LP/GP Waterfall   Excel template (XLSX)
$95.00

Search Fund & Holdco Model with LP/GP Waterfall (Excel template (XLSX)) Preview Image
Log in to unlock full preview.
Search Fund & Holdco Model with LP/GP Waterfall (Excel template (XLSX)) Preview Image
Arrow   Click main image to view in full screen. Unlock all 9 preview images:   Login Register

Search Fund & Holdco Model with LP/GP Waterfall – Excel XLSX

Excel (XLSX) + supplemental PDF

$95.00
Acquisition-grade models built the way a lender underwrites: SDE/NOI rebuilt from the seller's P&L, a DSCR test against the covenant, and a sourced benchmark for every assumption. Formula-audited across multiple engines before release.
Add to Cart


Immediate download
Fully editable Excel
Free lifetime updates

BENEFITS OF THIS DOWNLOADABLE EXCEL DOCUMENT

  1. Model several acquisitions in one vehicle, including the search phase and the capital calls a single-deal model leaves out.
  2. Compare the deal-by-deal and whole-of-fund waterfalls on the same cash flows, with and without a clawback.
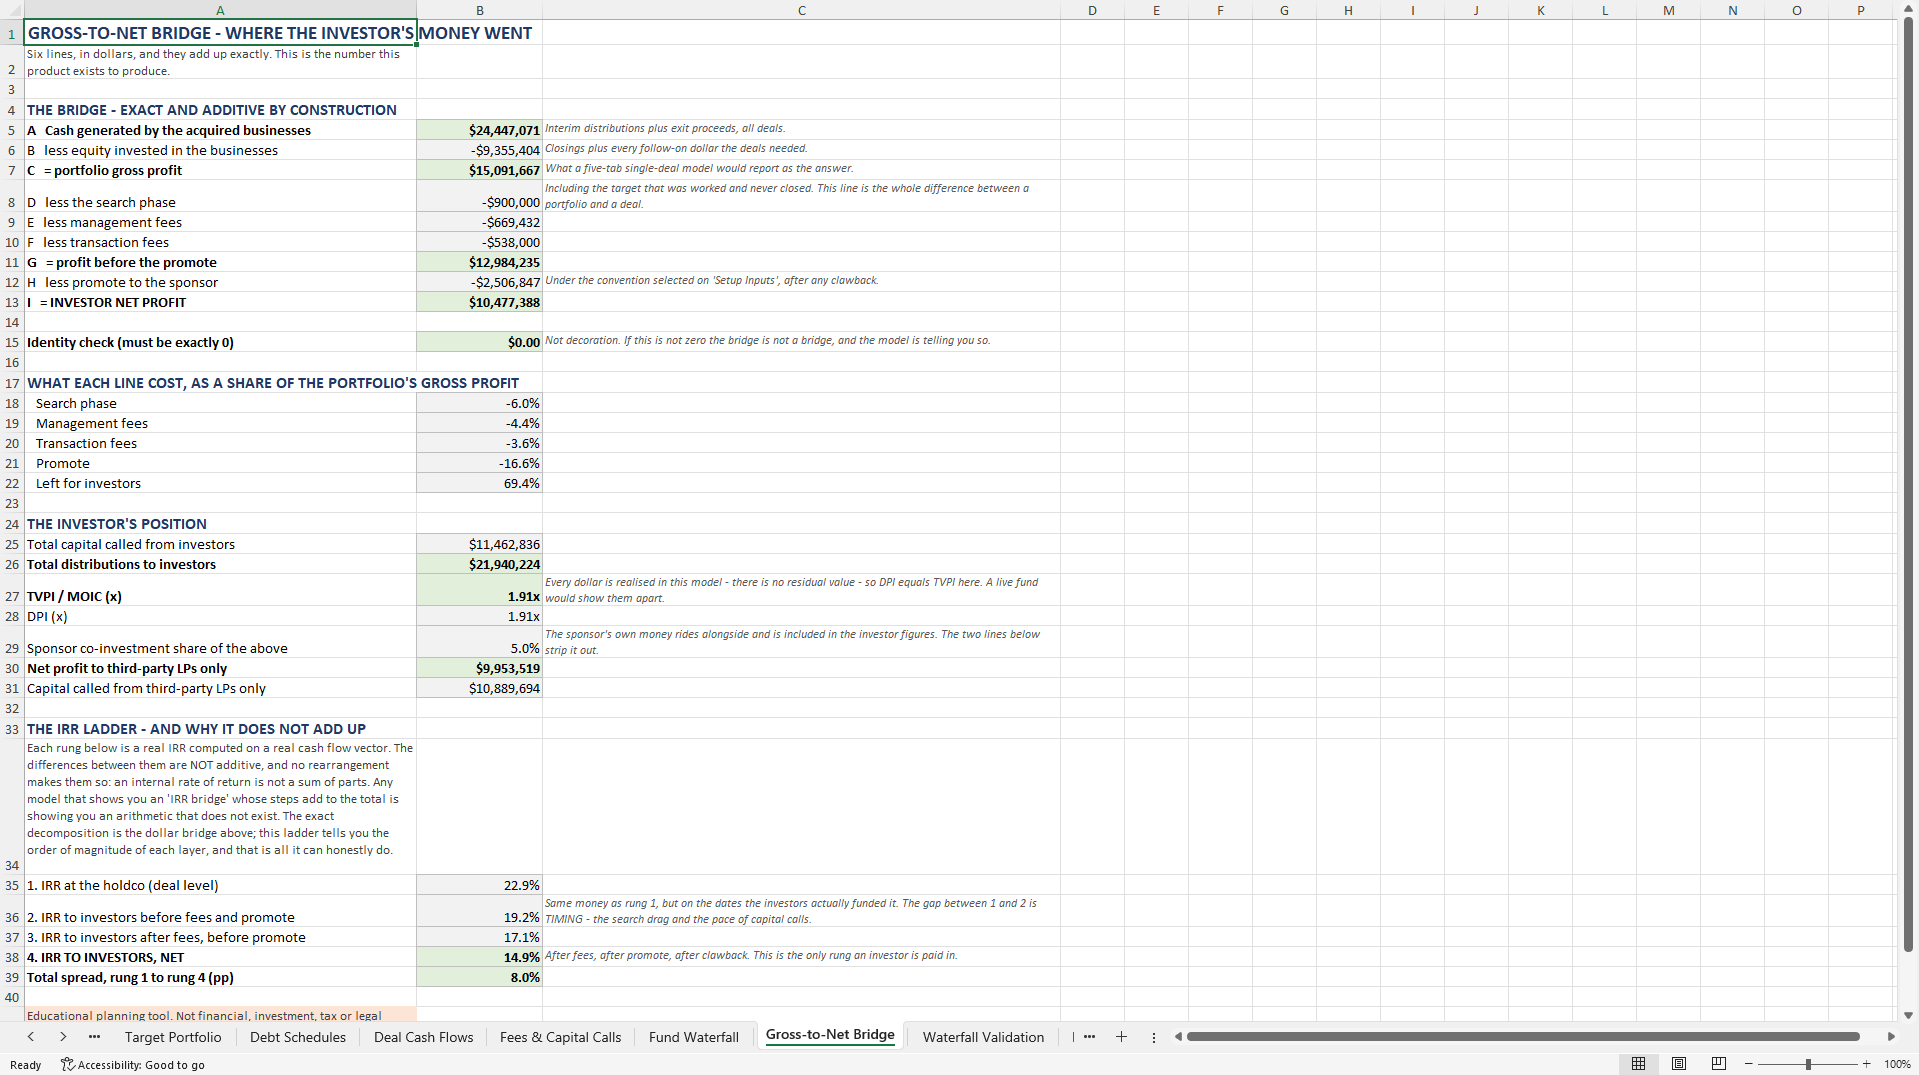
  3. Read an exact dollar bridge from the portfolio gross profit to the investor net profit, line by line.

M&A (MERGERS & ACQUISITIONS) EXCEL DESCRIPTION

Search Fund & Holdco Model with LP/GP Waterfall is an Excel template (XLSX) with a supplemental PDF document available for immediate download upon purchase.

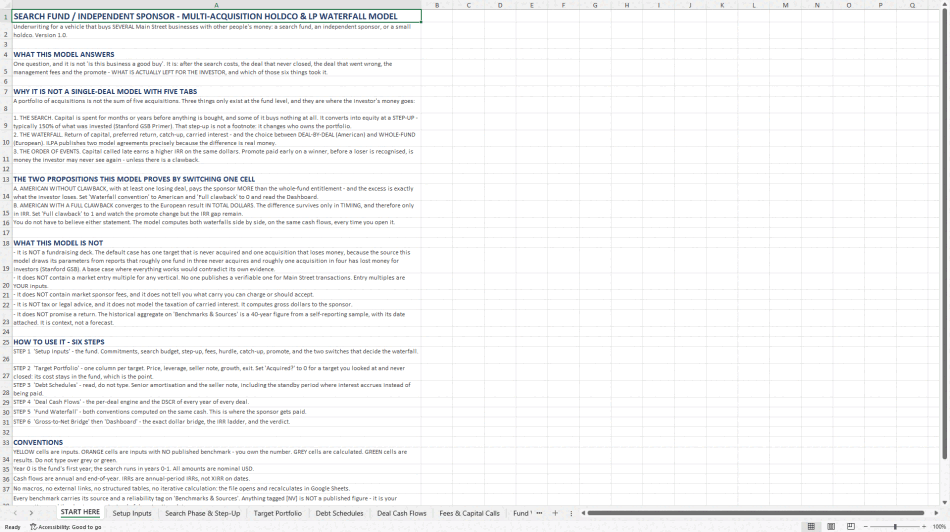
You can underwrite one acquisition on a single sheet: price, debt, cash flow, coverage, exit. Do it five times and you still have not modelled a fund, because three things exist only above the deal level and they are exactly where the investor's money goes.

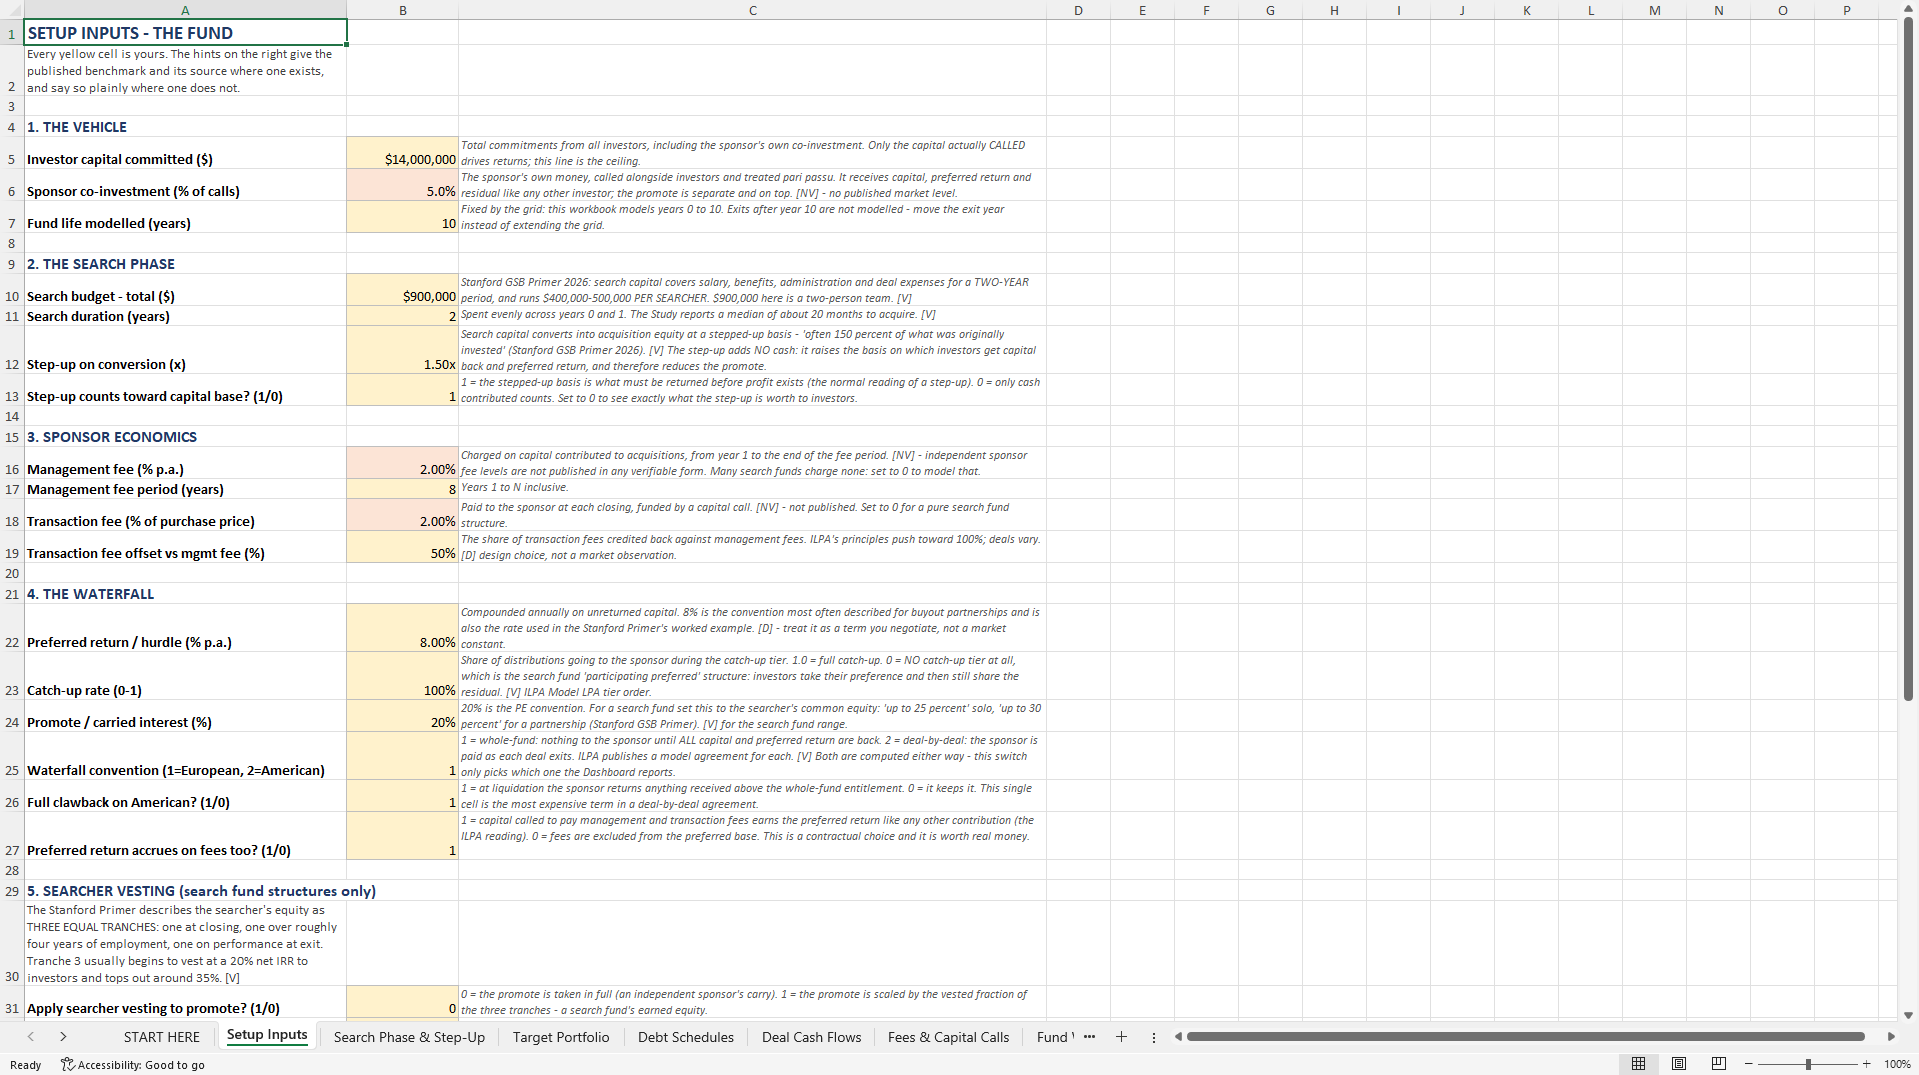
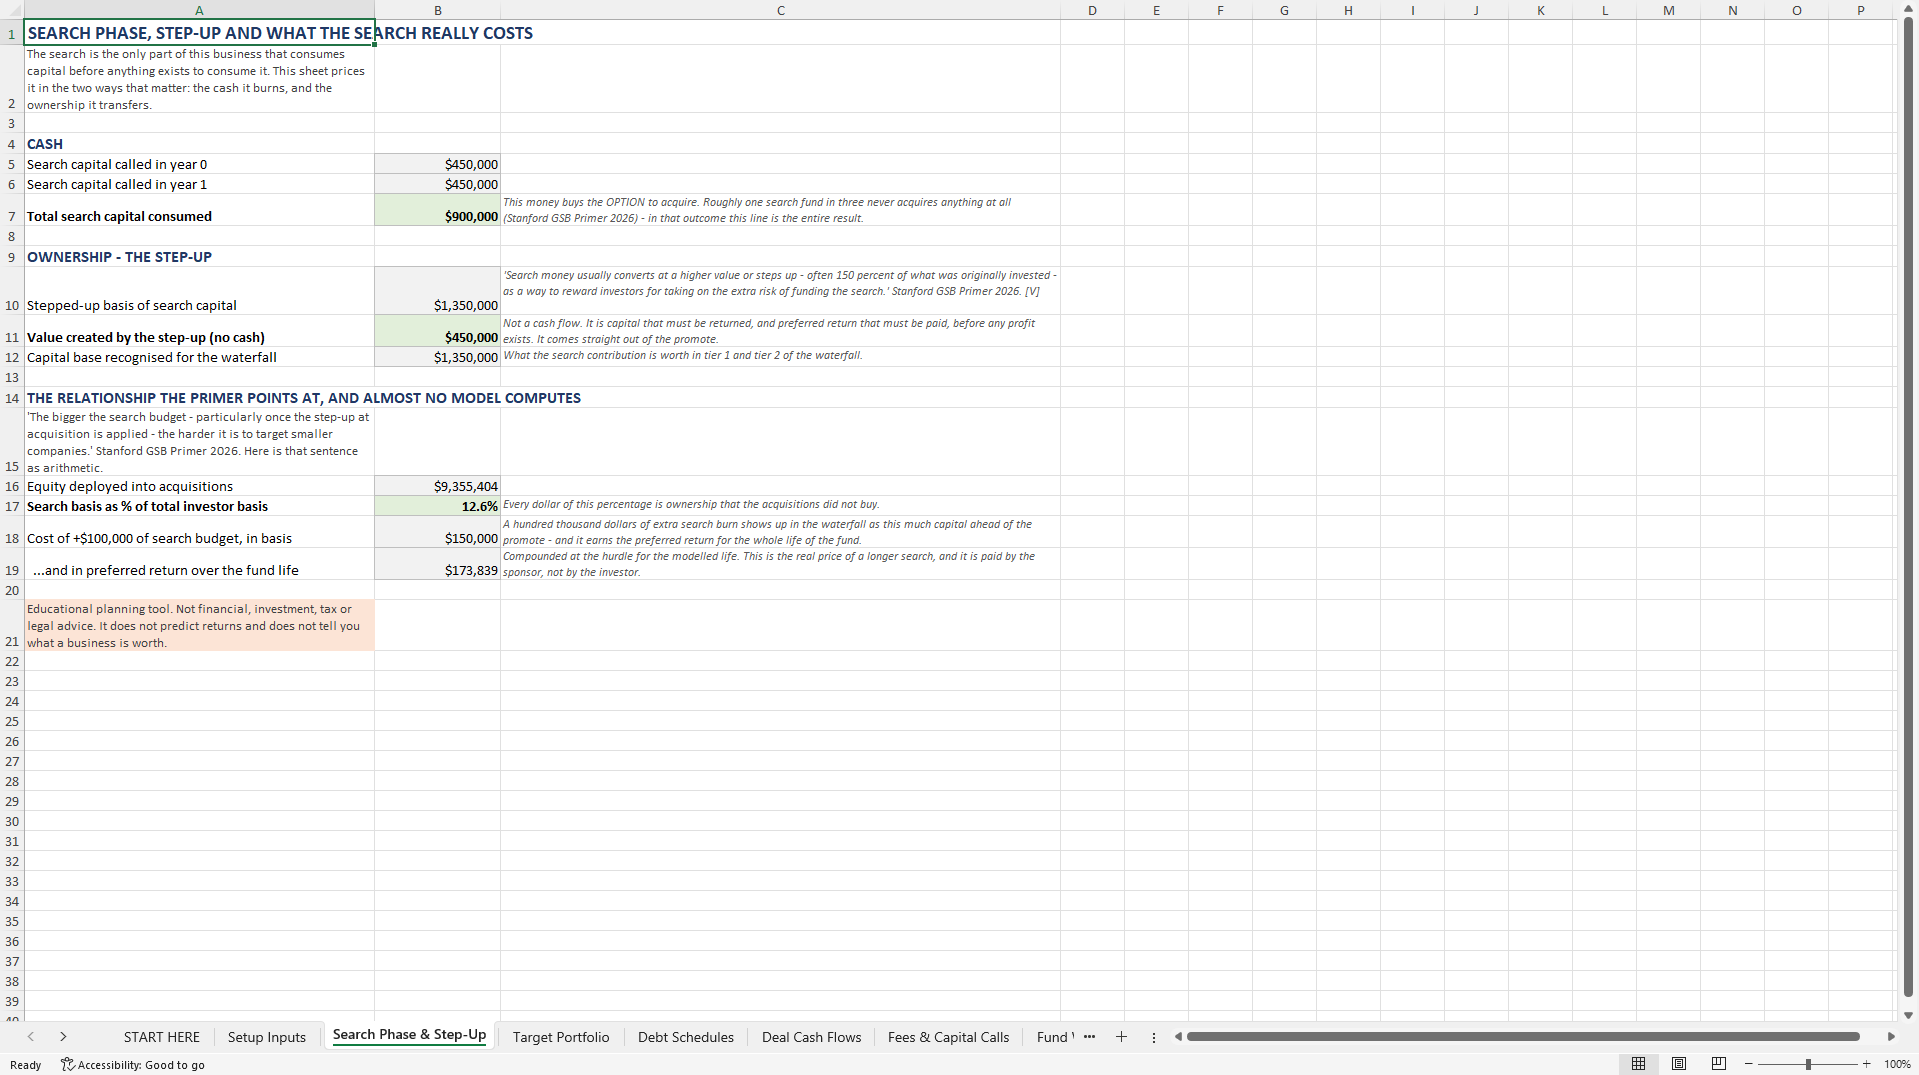
The search. Capital is spent for years before anything is bought, and some of it buys nothing at all. It then converts into equity at a step-up, typically 150 percent of what was originally invested, which is capital and preferred return standing in front of the promote. Switch the step-up off in the model and watch the sponsor's carry rise: that difference is what it is worth.

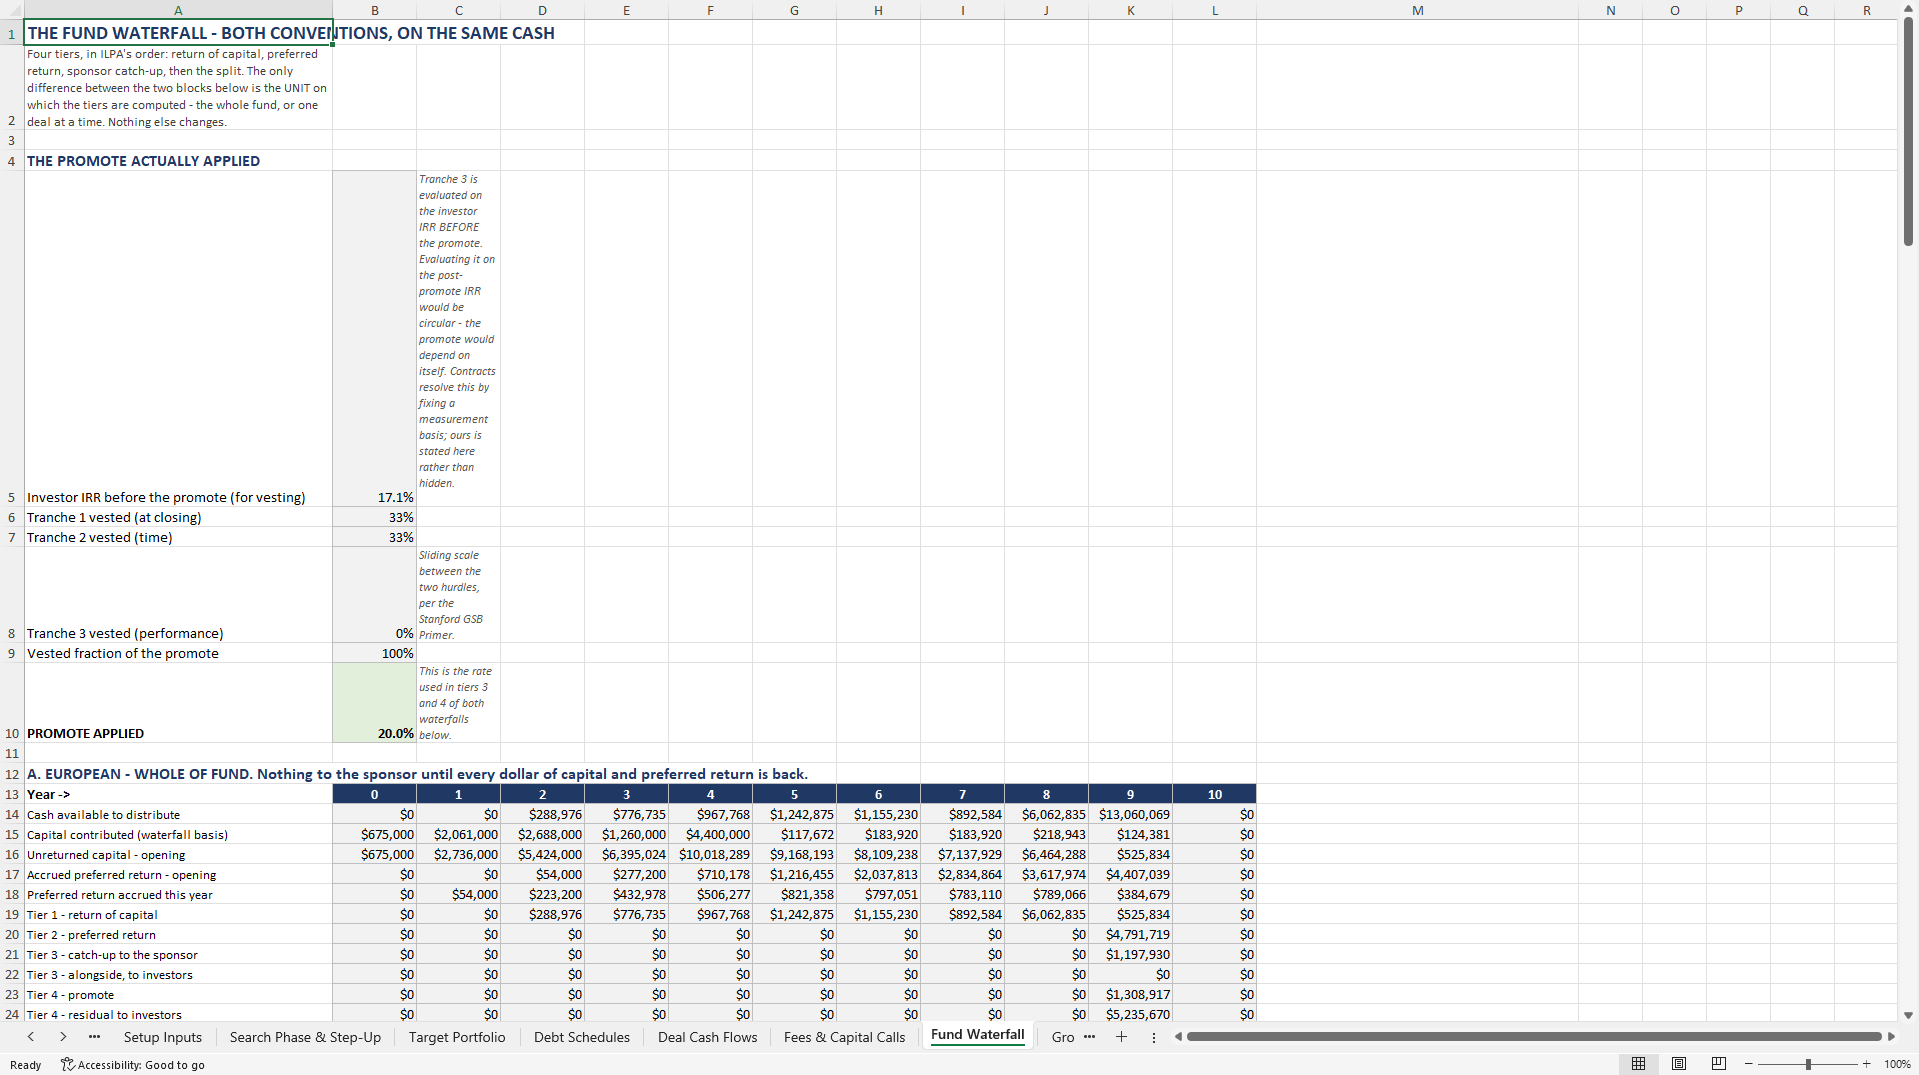
The waterfall. Return of capital, preferred return, catch-up, promote. Both conventions are computed on the same cash, every time the file recalculates: whole-of-fund (European) and deal-by-deal (American), with a clawback switch.

The order of events. Capital called late earns more on the same dollars. A promote paid early on a winner, before a loser is recognised, may never come back.

Two propositions you can test rather than take on trust. Deal-by-deal without a clawback, with one losing deal in the portfolio, pays the sponsor more than the whole-fund entitlement, and the excess is precisely what the investors lose. Deal-by-deal with a full clawback converges to the whole-fund result in total dollars, leaving a difference that survives only in timing and therefore only in the rate of return. Both are computed side by side in the default case.

The output is a bridge, in dollars, that adds up exactly: cash generated by the businesses, less the equity invested in them, less the search phase, less management fees, less transaction fees, less the promote, leaving the investor's net profit. In the default portfolio the businesses earn 22.9 percent at the deal level and the investor is paid 14.9 percent net. The bridge tells you which of the five costs produced the 8.0 points of spread, and the identity check on the sheet reads zero. Beside it is a return ladder, presented without pretending the rungs add up, because an internal rate of return is not a sum of parts.

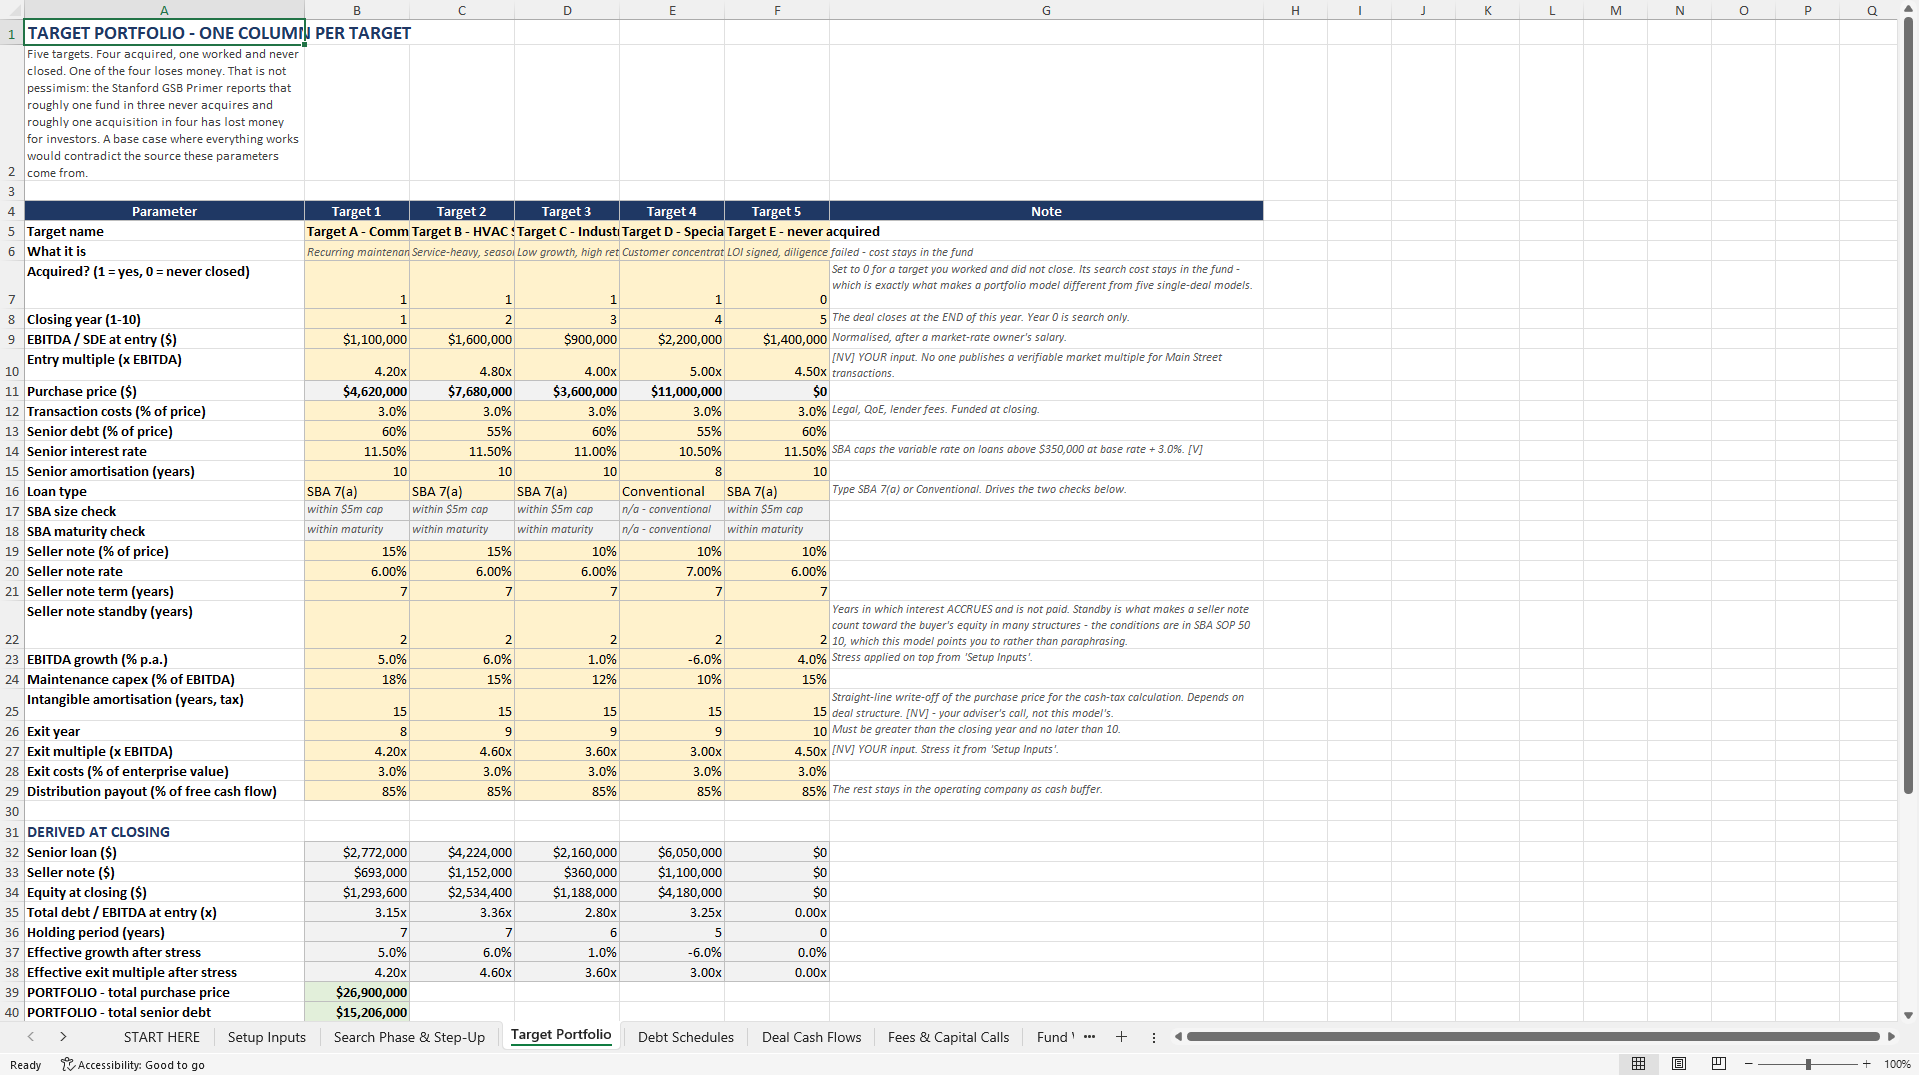
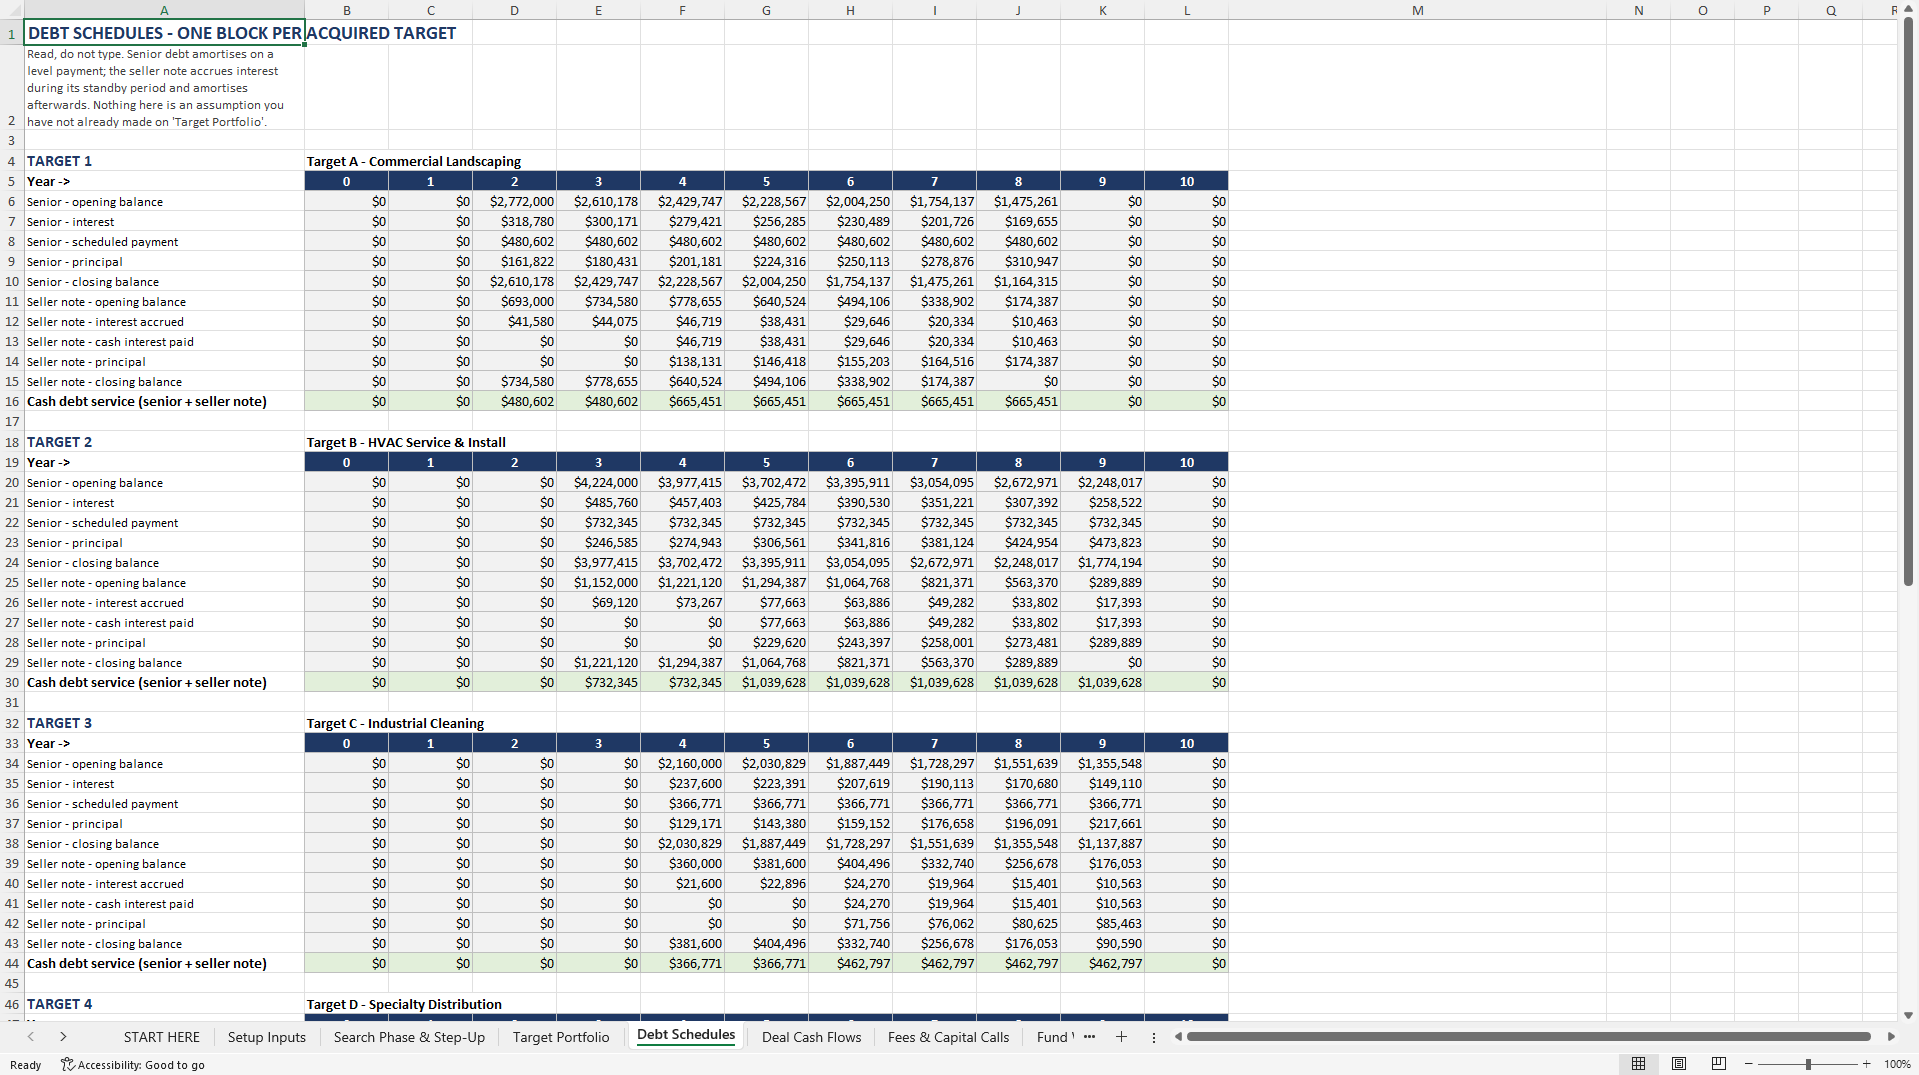
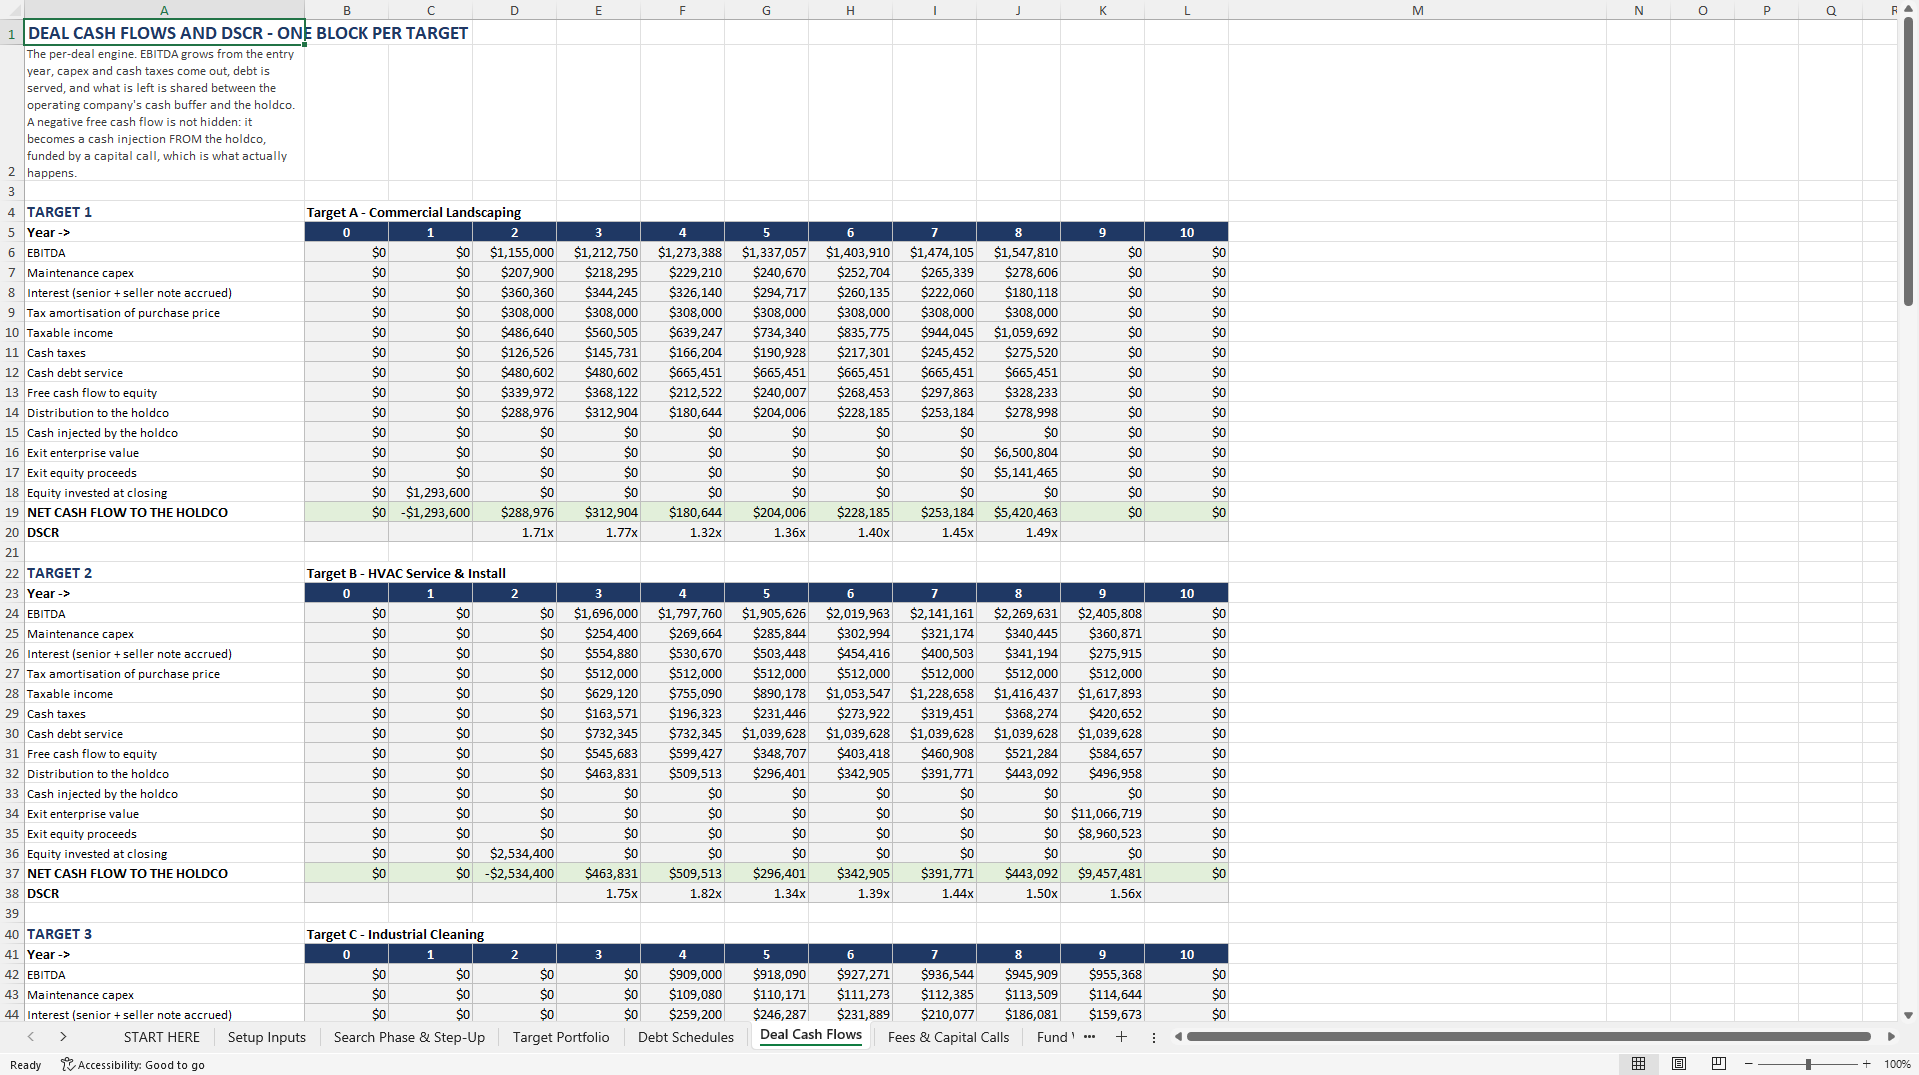
At the deal level: five targets, each with its own entry multiple, senior debt, growth, capex, cash taxes, exit and coverage ratio; a seller note with a standby period where interest accrues instead of being paid; and the published SBA 7(a) caps checked against your inputs, being the five million dollar maximum loan, the 75 percent guaranty and the ten-year maximum maturity outside real estate. Amortising acquisition debt over twenty-five years makes almost any price work on paper, and for a goodwill deal that financing does not exist.

The search fund structure is modelled rather than approximated: the two-stage capital raise, the step-up on conversion, and the searcher's equity in three tranches, one at closing, one vesting over four years of employment, and one on performance hurdles that begin at a 20 percent net return to investors and top out around 35 percent.

The default case is deliberately uneven. Four acquisitions and one target that is worked and never closed. One of the four returns 0.51 times the equity it absorbed, with a minimum debt service coverage ratio of 0.91, which is the arithmetic way of saying the business did not cover its own debt and the holding company had to. That is not pessimism: the published record says roughly one search fund in three never acquires, and roughly one acquisition in four has lost money for investors. Exit multiples are at or below entry multiples on every deal, because multiple expansion is the assumption that flatters every model that makes it.

The waterfall engine reproduces a published worked example to within the rounding of the printed text, and the comparison sits on its own sheet so you can check it rather than trust it.

Twelve worksheets and almost three thousand formulas. Excel and Google Sheets, no macros, no external links, no iterative calculation. The accompanying PDF is a seven-page user guide that walks through the search step-up, the debt caps, the four waterfall tiers, the searcher's vesting tranches and how to read the bridge.

This is an educational planning tool. It is not financial, investment, tax or legal advice, it does not predict returns, and it does not tell you what a business is worth.

Got a question about the product? Email us at support@flevy.com or ask the author directly by using the "Ask the Author a Question" form. If you cannot view the preview above this document description, go here to view the large preview instead.

Source: Best Practices in M&A (Mergers & Acquisitions), Integrated Financial Model Excel: Search Fund & Holdco Model with LP/GP Waterfall Excel (XLSX) Spreadsheet, ProformaWorks


$95.00
Acquisition-grade models built the way a lender underwrites: SDE/NOI rebuilt from the seller's P&L, a DSCR test against the covenant, and a sourced benchmark for every assumption. Formula-audited across multiple engines before release.
Add to Cart
  

ABOUT THE AUTHOR

Author image
Author: ProformaWorks
Additional documents from author: 9

ProformaWorks builds acquisition-grade financial models for Main Street and lower-middle-market businesses - the kind of deal financed with an SBA 7(a) loan or a small commercial facility.

Every model answers one question: does this deal pencil at the bank? That means SDE or NOI rebuilt from the seller's own numbers, the add-backs a lender will and will not accept, a debt-service ... [read more]

Ask the Author a Question

You must be logged in to contact the author.

Click here to log in Click here register

Did you know?
The average daily rate of a McKinsey consultant is $6,625 (not including expenses). The average price of a Flevy document is $65.



Trusted by over 10,000+ Client Organizations
Since 2012, we have provided business templates to over 10,000 businesses and organizations of all sizes, from startups and small businesses to the Fortune 100, in over 130 countries.
AT&T GE Cisco Intel IBM Coke Dell Toyota HP Nike Samsung Microsoft Astrazeneca JP Morgan KPMG Walgreens Walmart 3M Kaiser Oracle SAP Google E&Y Volvo Bosch Merck Fedex Shell Amgen Eli Lilly Roche AIG Abbott Amazon PwC T-Mobile Broadcom Bayer Pearson Titleist ConEd Pfizer NTT Data Schwab


Read Customer Testimonials

 
"FlevyPro has been a brilliant resource for me, as an independent growth consultant, to access a vast knowledge bank of presentations to support my work with clients. In terms of RoI, the value I received from the very first presentation I downloaded paid for my subscription many times over! The "

– Roderick Cameron, Founding Partner at SGFE Ltd
 
"The wide selection of frameworks is very useful to me as an independent consultant. In fact, it rivals what I had at my disposal at Big 4 Consulting firms in terms of efficacy and organization."

– Julia T., Consulting Firm Owner (Former Manager at Deloitte and Capgemini)
 
"[Flevy] produces some great work that has been/continues to be of immense help not only to myself, but as I seek to provide professional services to my clients, it gives me a large "tool box" of resources that are critical to provide them with the quality of service and outcomes they are expecting."

– Royston Knowles, Executive with 50+ Years of Board Level Experience
 
"I have found Flevy to be an amazing resource and library of useful presentations for lean sigma, change management and so many other topics. This has reduced the time I need to spend on preparing for my performance consultation. The library is easily accessible and updates are regularly provided. A wealth of great information."

– Cynthia Howard RN, PhD, Executive Coach at Ei Leadership
 
"If you are looking for great resources to save time with your business presentations, Flevy is truly a value-added resource. Flevy has done all the work for you and we will continue to utilize Flevy as a source to extract up-to-date information and data for our virtual and onsite presentations!"

– Debbi Saffo, President at The NiKhar Group
 
"My FlevyPro subscription provides me with the most popular frameworks and decks in demand in today’s market. They not only augment my existing consulting and coaching offerings and delivery, but also keep me abreast of the latest trends, inspire new products and service offerings for my practice, and educate me "

– Bill Branson, Founder at Strategic Business Architects
 
"As a small business owner, the resource material available from FlevyPro has proven to be invaluable. The ability to search for material on demand based our project events and client requirements was great for me and proved very beneficial to my clients. Importantly, being able to easily edit and tailor "

– Michael Duff, Managing Director at Change Strategy (UK)
 
"I am extremely grateful for the proactiveness and eagerness to help and I would gladly recommend the Flevy team if you are looking for data and toolkits to help you work through business solutions."

– Trevor Booth, Partner, Fast Forward Consulting


Customers Also Like These Documents

Explore Templates on Related Management Topics


Your Recently Viewed Documents
Download our FREE Strategy & Transformation Framework Templates

Download our free compilation of 50+ Strategy & Transformation slides and templates. Frameworks include McKinsey 7-S, Balanced Scorecard, Disruptive Innovation, BCG Curve, and many more.