

Private Equity (PE) Fund Financial Projection Model – Excel XLSX
Excel (XLSX) + Excel (XLSX)
VIDEO DEMO
PRIVATE EQUITY EXCEL DESCRIPTION
PURPOSE OF MODEL
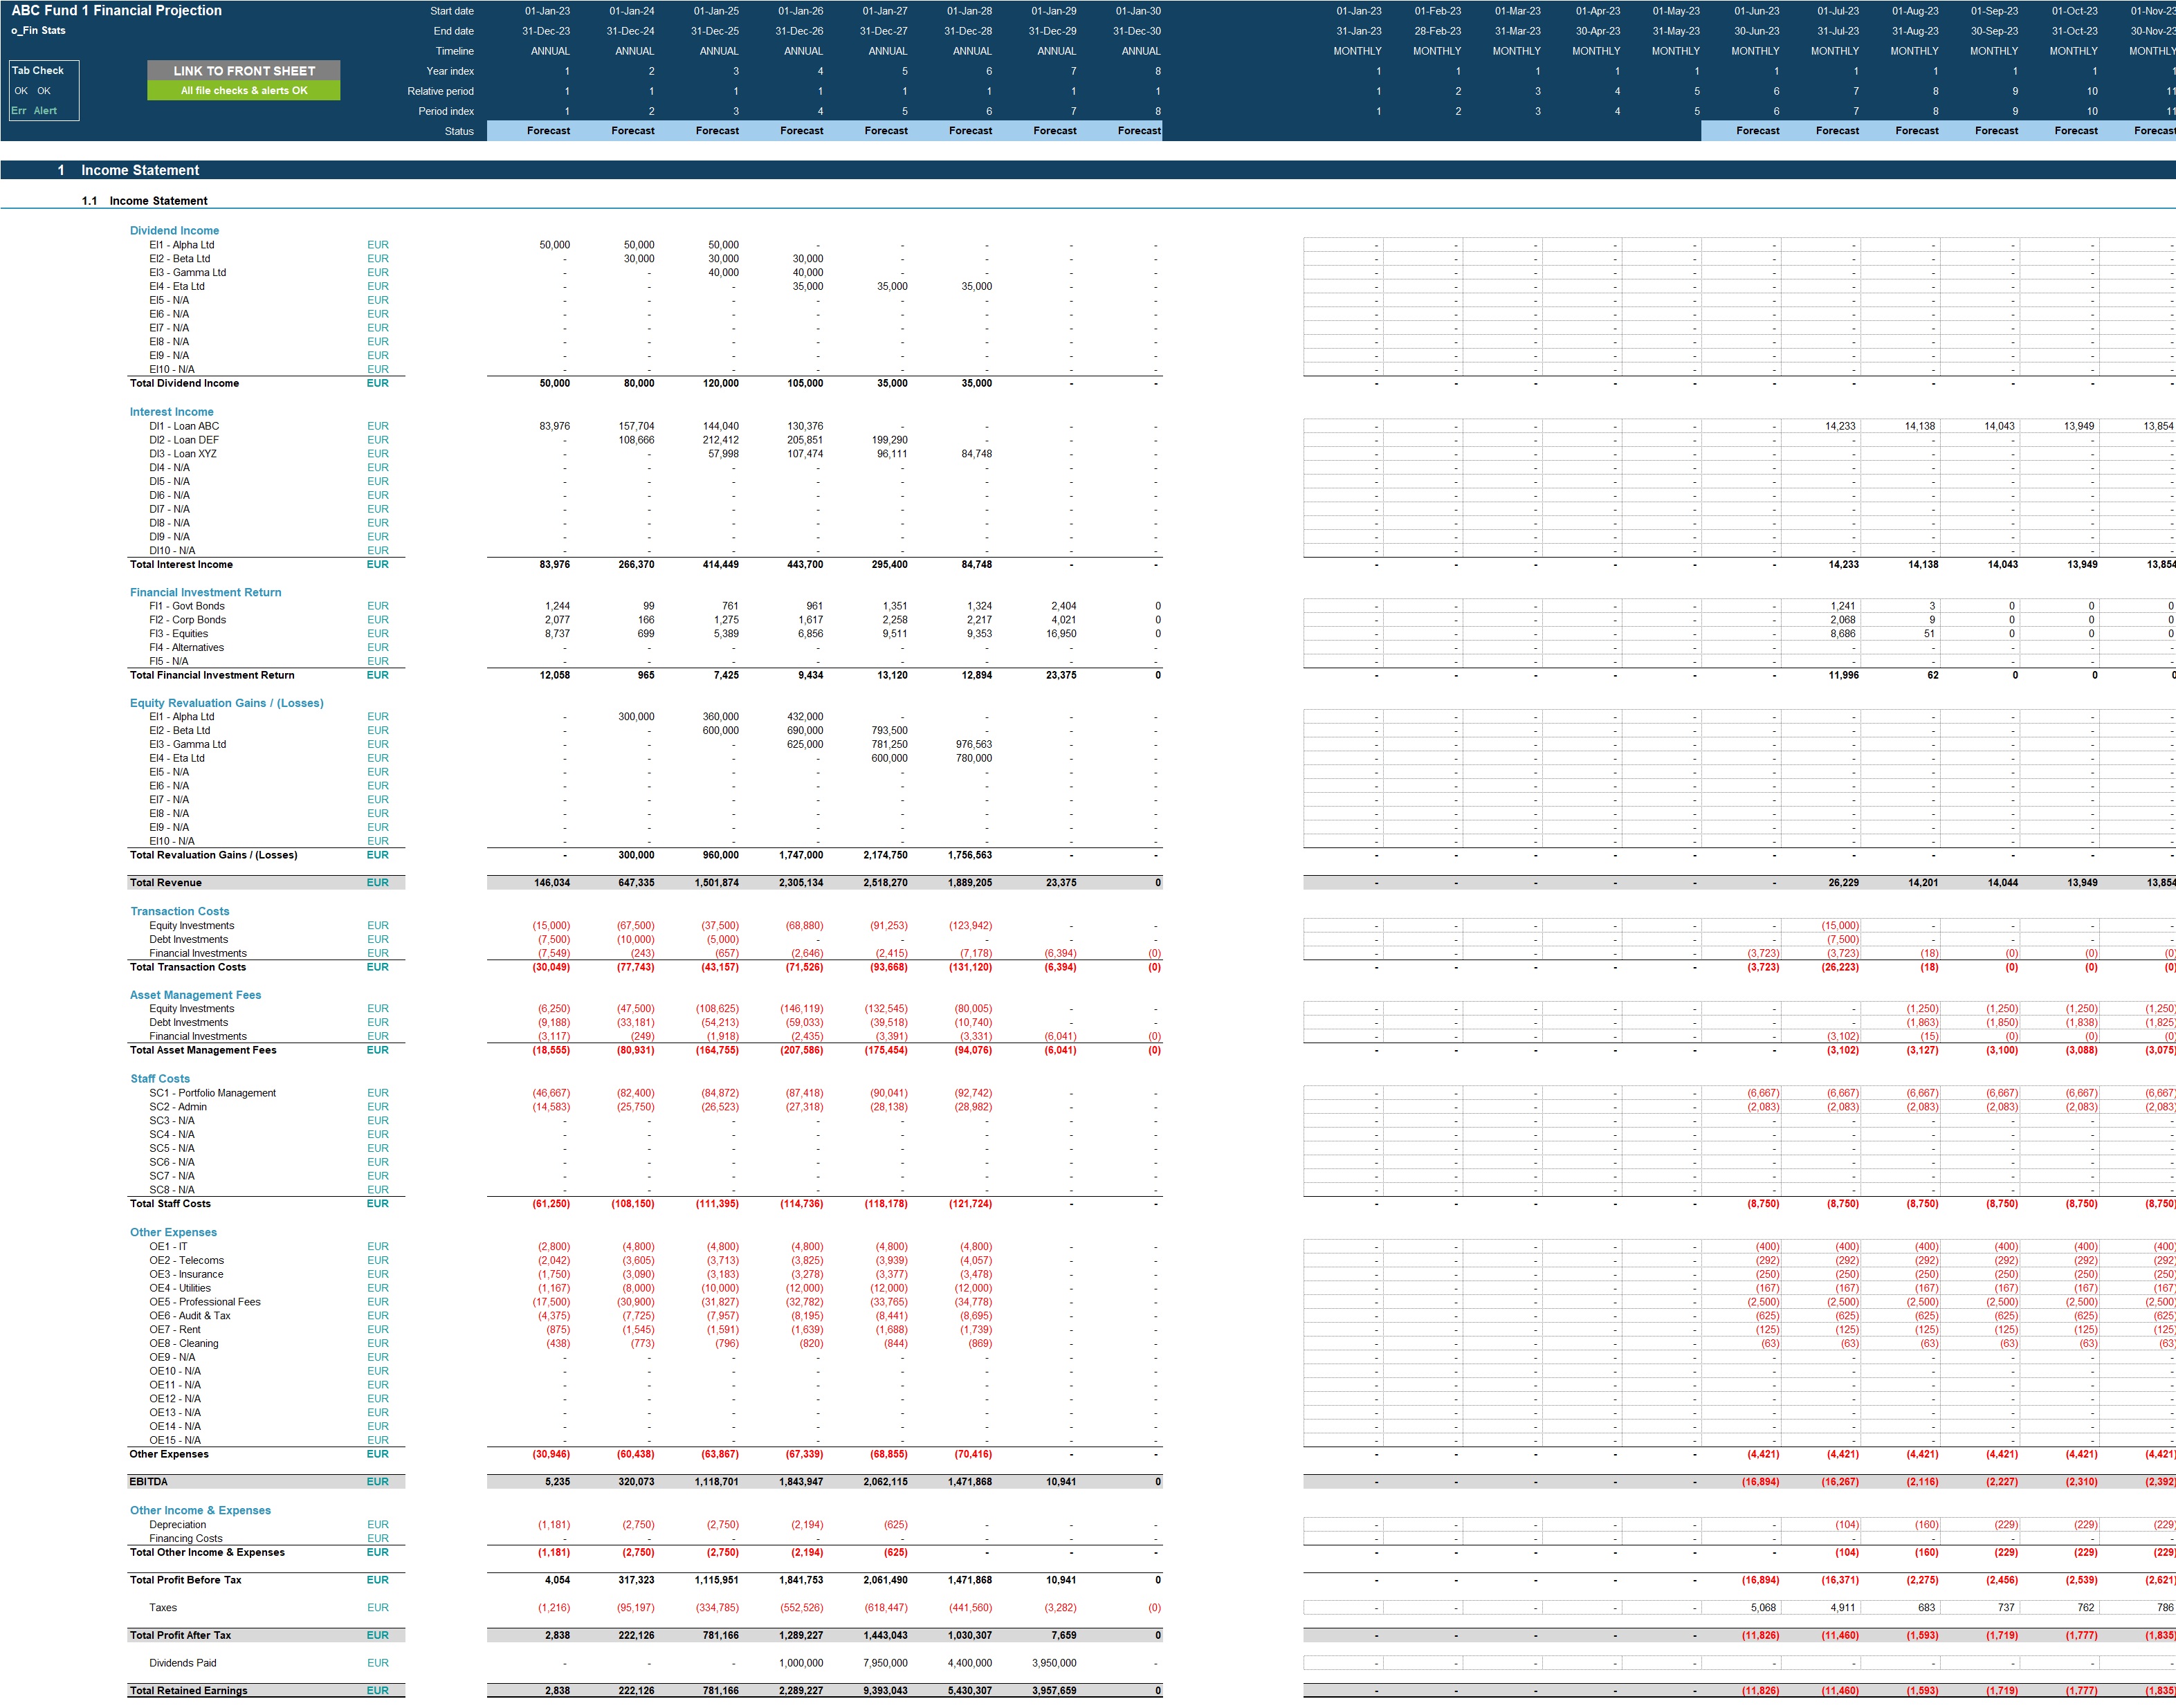
Highly versatile and user-friendly Excel model for the preparation a of a private equity fund three statement (Income Statement, Balance Sheet and Cash flow Statement) financial projection with a monthly timeline of up to 8 years. The model includes calculations for the distribution of funds between the Limited Partner (‘LP') and General Partner (‘GP') with waterfall assumptions including equity contribution splits, LP hurdle rates, GP catch up provisions and carried interest.
The model is highly flexible enabling the user to model up to 10 different underlying equity investments generating dividend income, realised and un/realised gains and losses and up to 10 different debt investments generating interest income. It also enables the user to model other financial instruments (money market, bonds, equities, alternatives etc), transaction fees, asset management fees, staff costs, operating expenses, fixed assets and borrowings.
KEY OUTPUTS
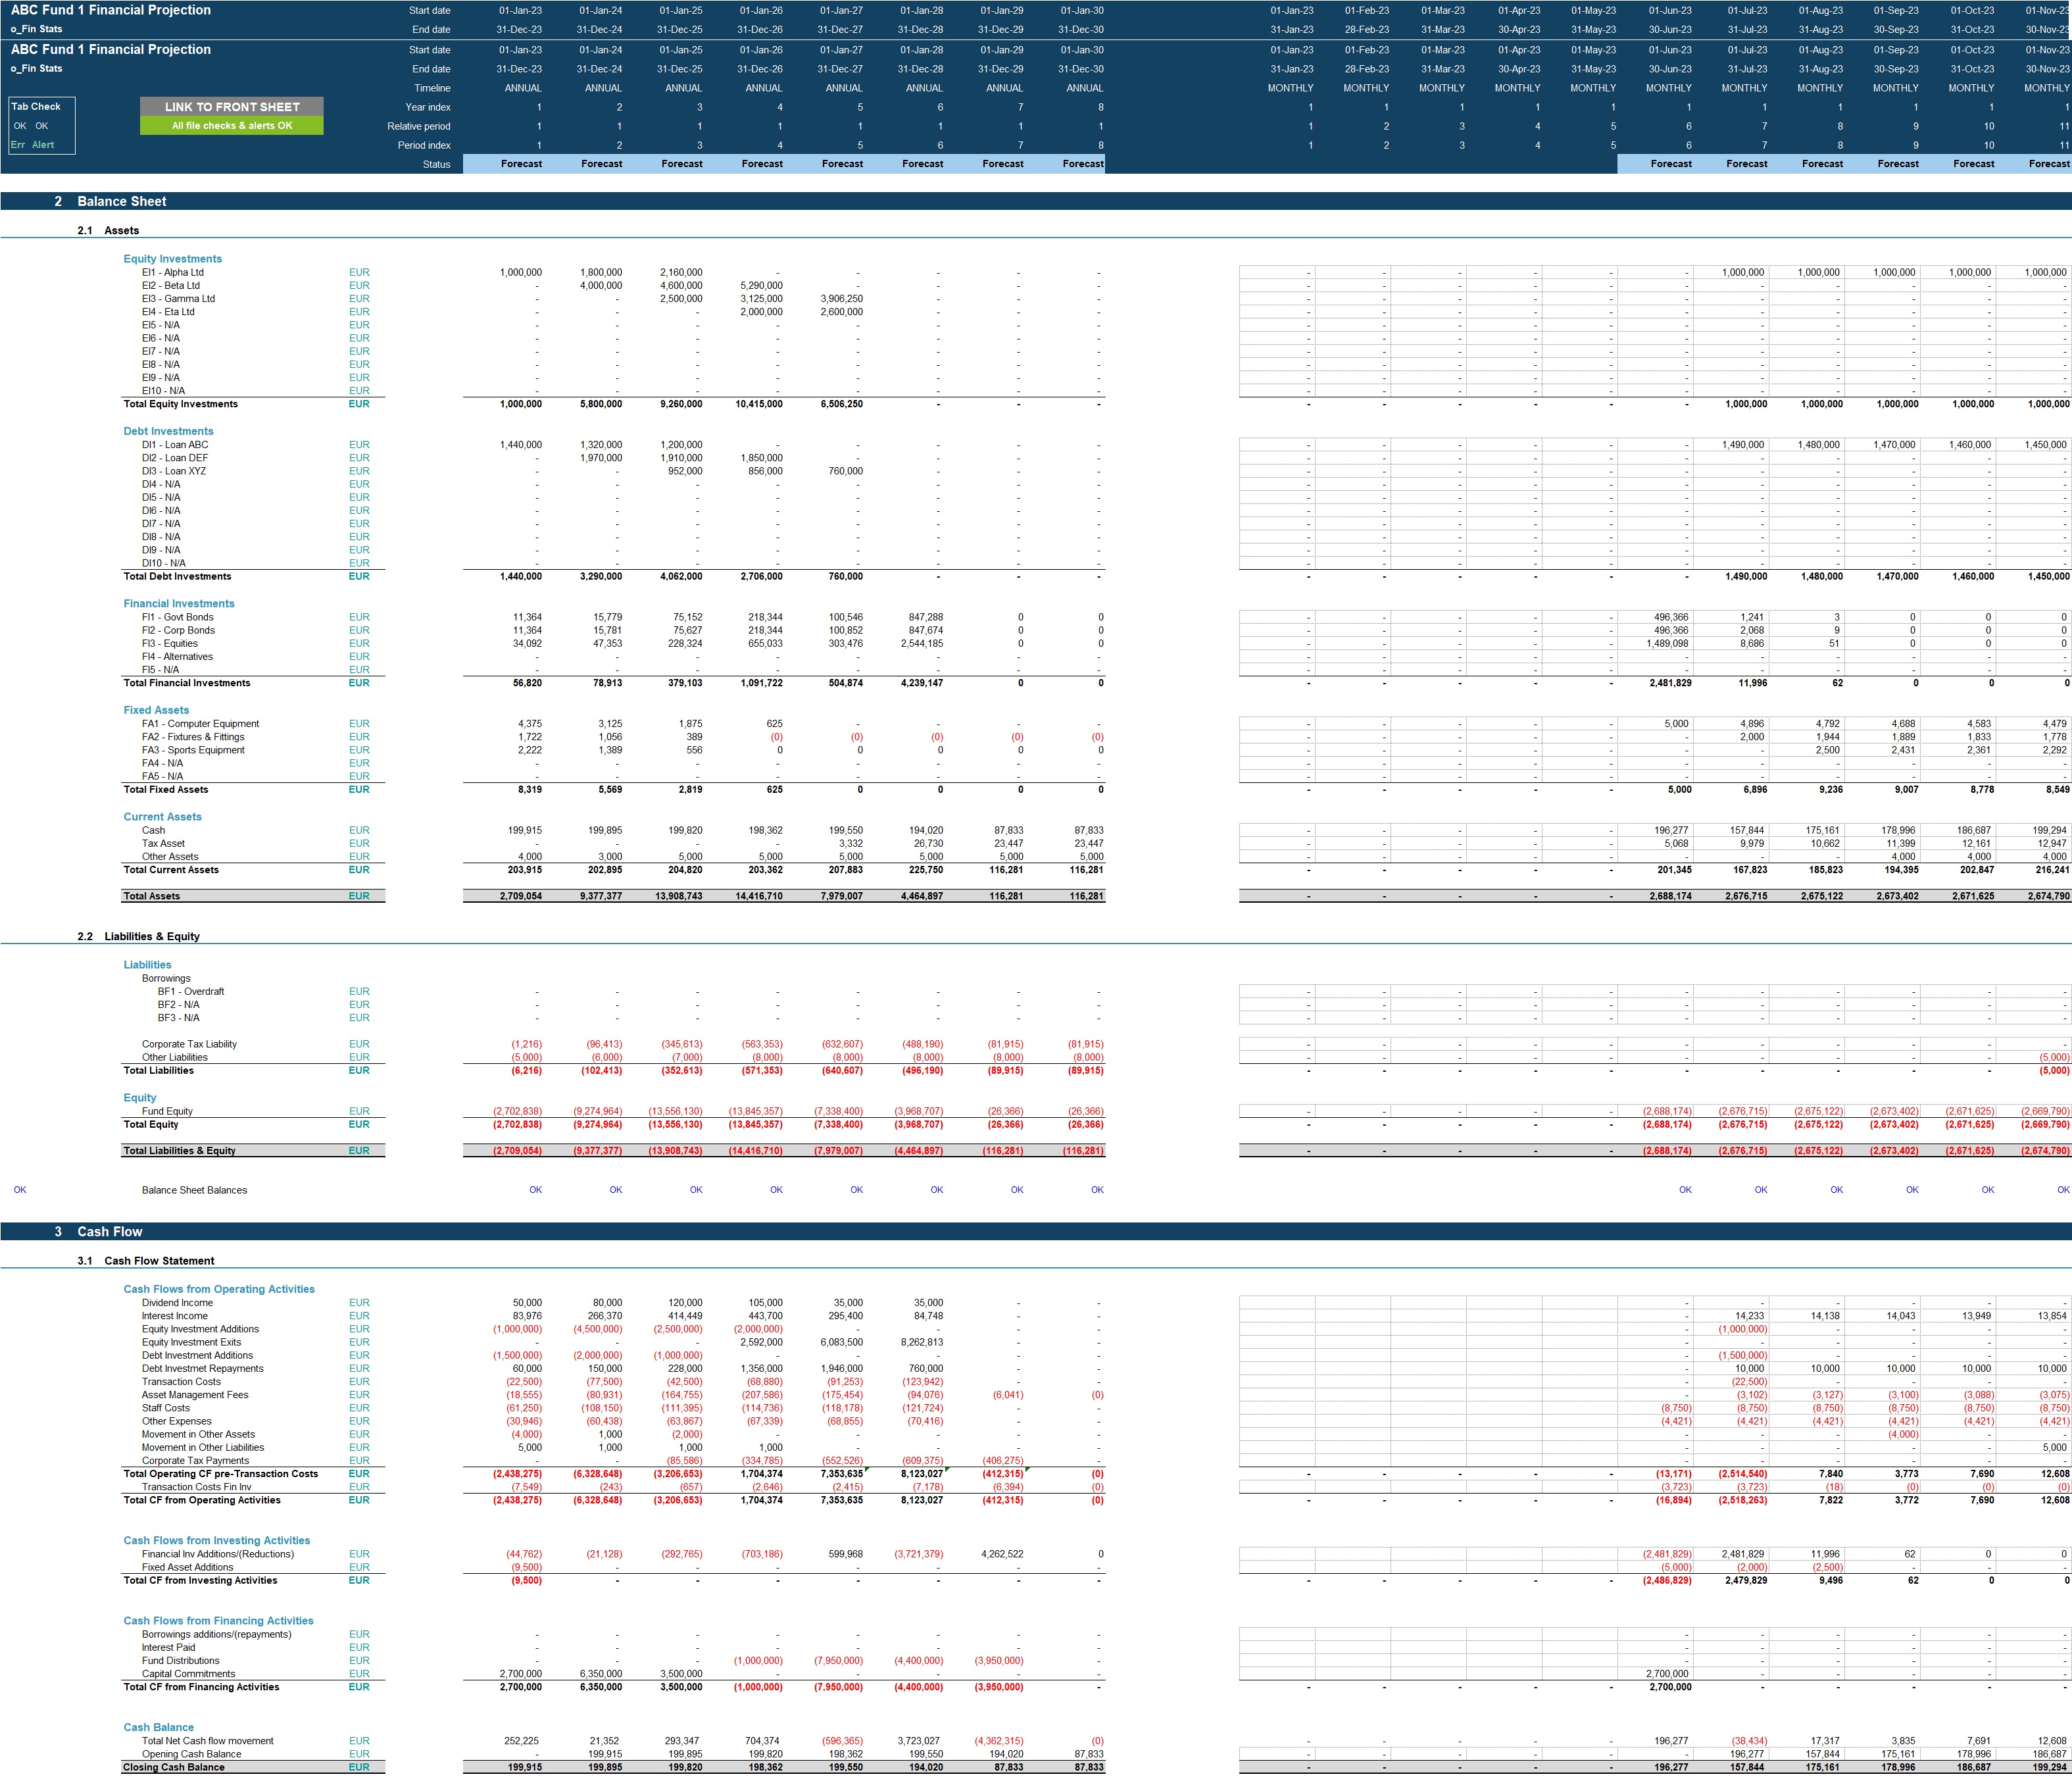
• Projected full financial statements (Income Statement, Balance Sheet and Cash flow Statement) presented on a monthly basis across up 8 years and summarised on an annual basis.
• Dashboard with:
• Summarised projected Income Statement and Balance Sheet;
• List of key ratios including average investment return, average profit margins, average return on assets and equity and average debt to equity ratio;
• Bar charts summarising income statement and Balance Sheet projections;
• Waterfall of fund distributions
• IRR on total fund basis and for GP and LP
• IRR and net cash flows by equity and debt investment
• Multiples of invested capital (MOIC)
• Charts presenting total assets under management, NAV plus distributions, investment income and cumulative investment return by month
KEY INPUTS
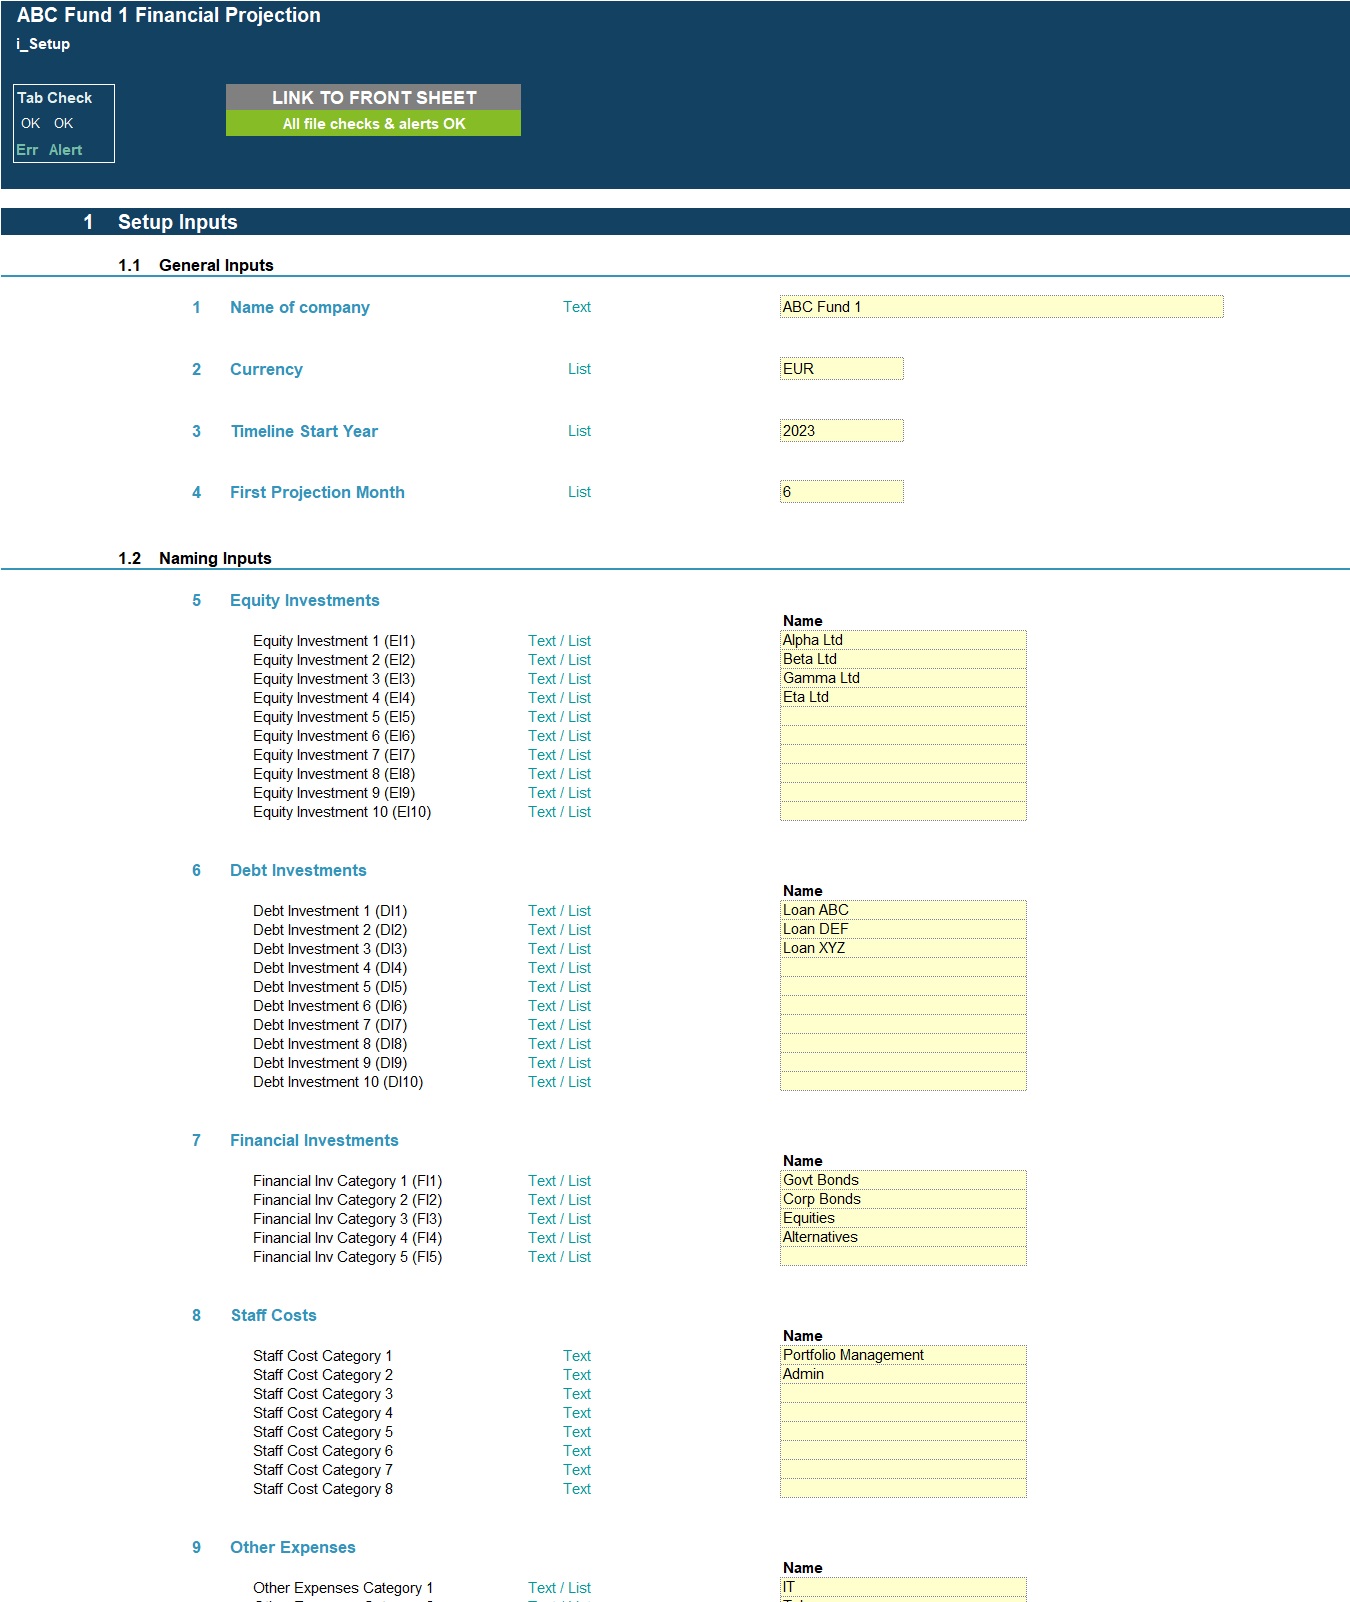
Setup Inputs:
• Name of business;
• Currency;
• First projection year and month;
• Naming for equity investments, debt investments, financial investments, staff costs, other expenses, financial investments, fixed assets and borrowings.
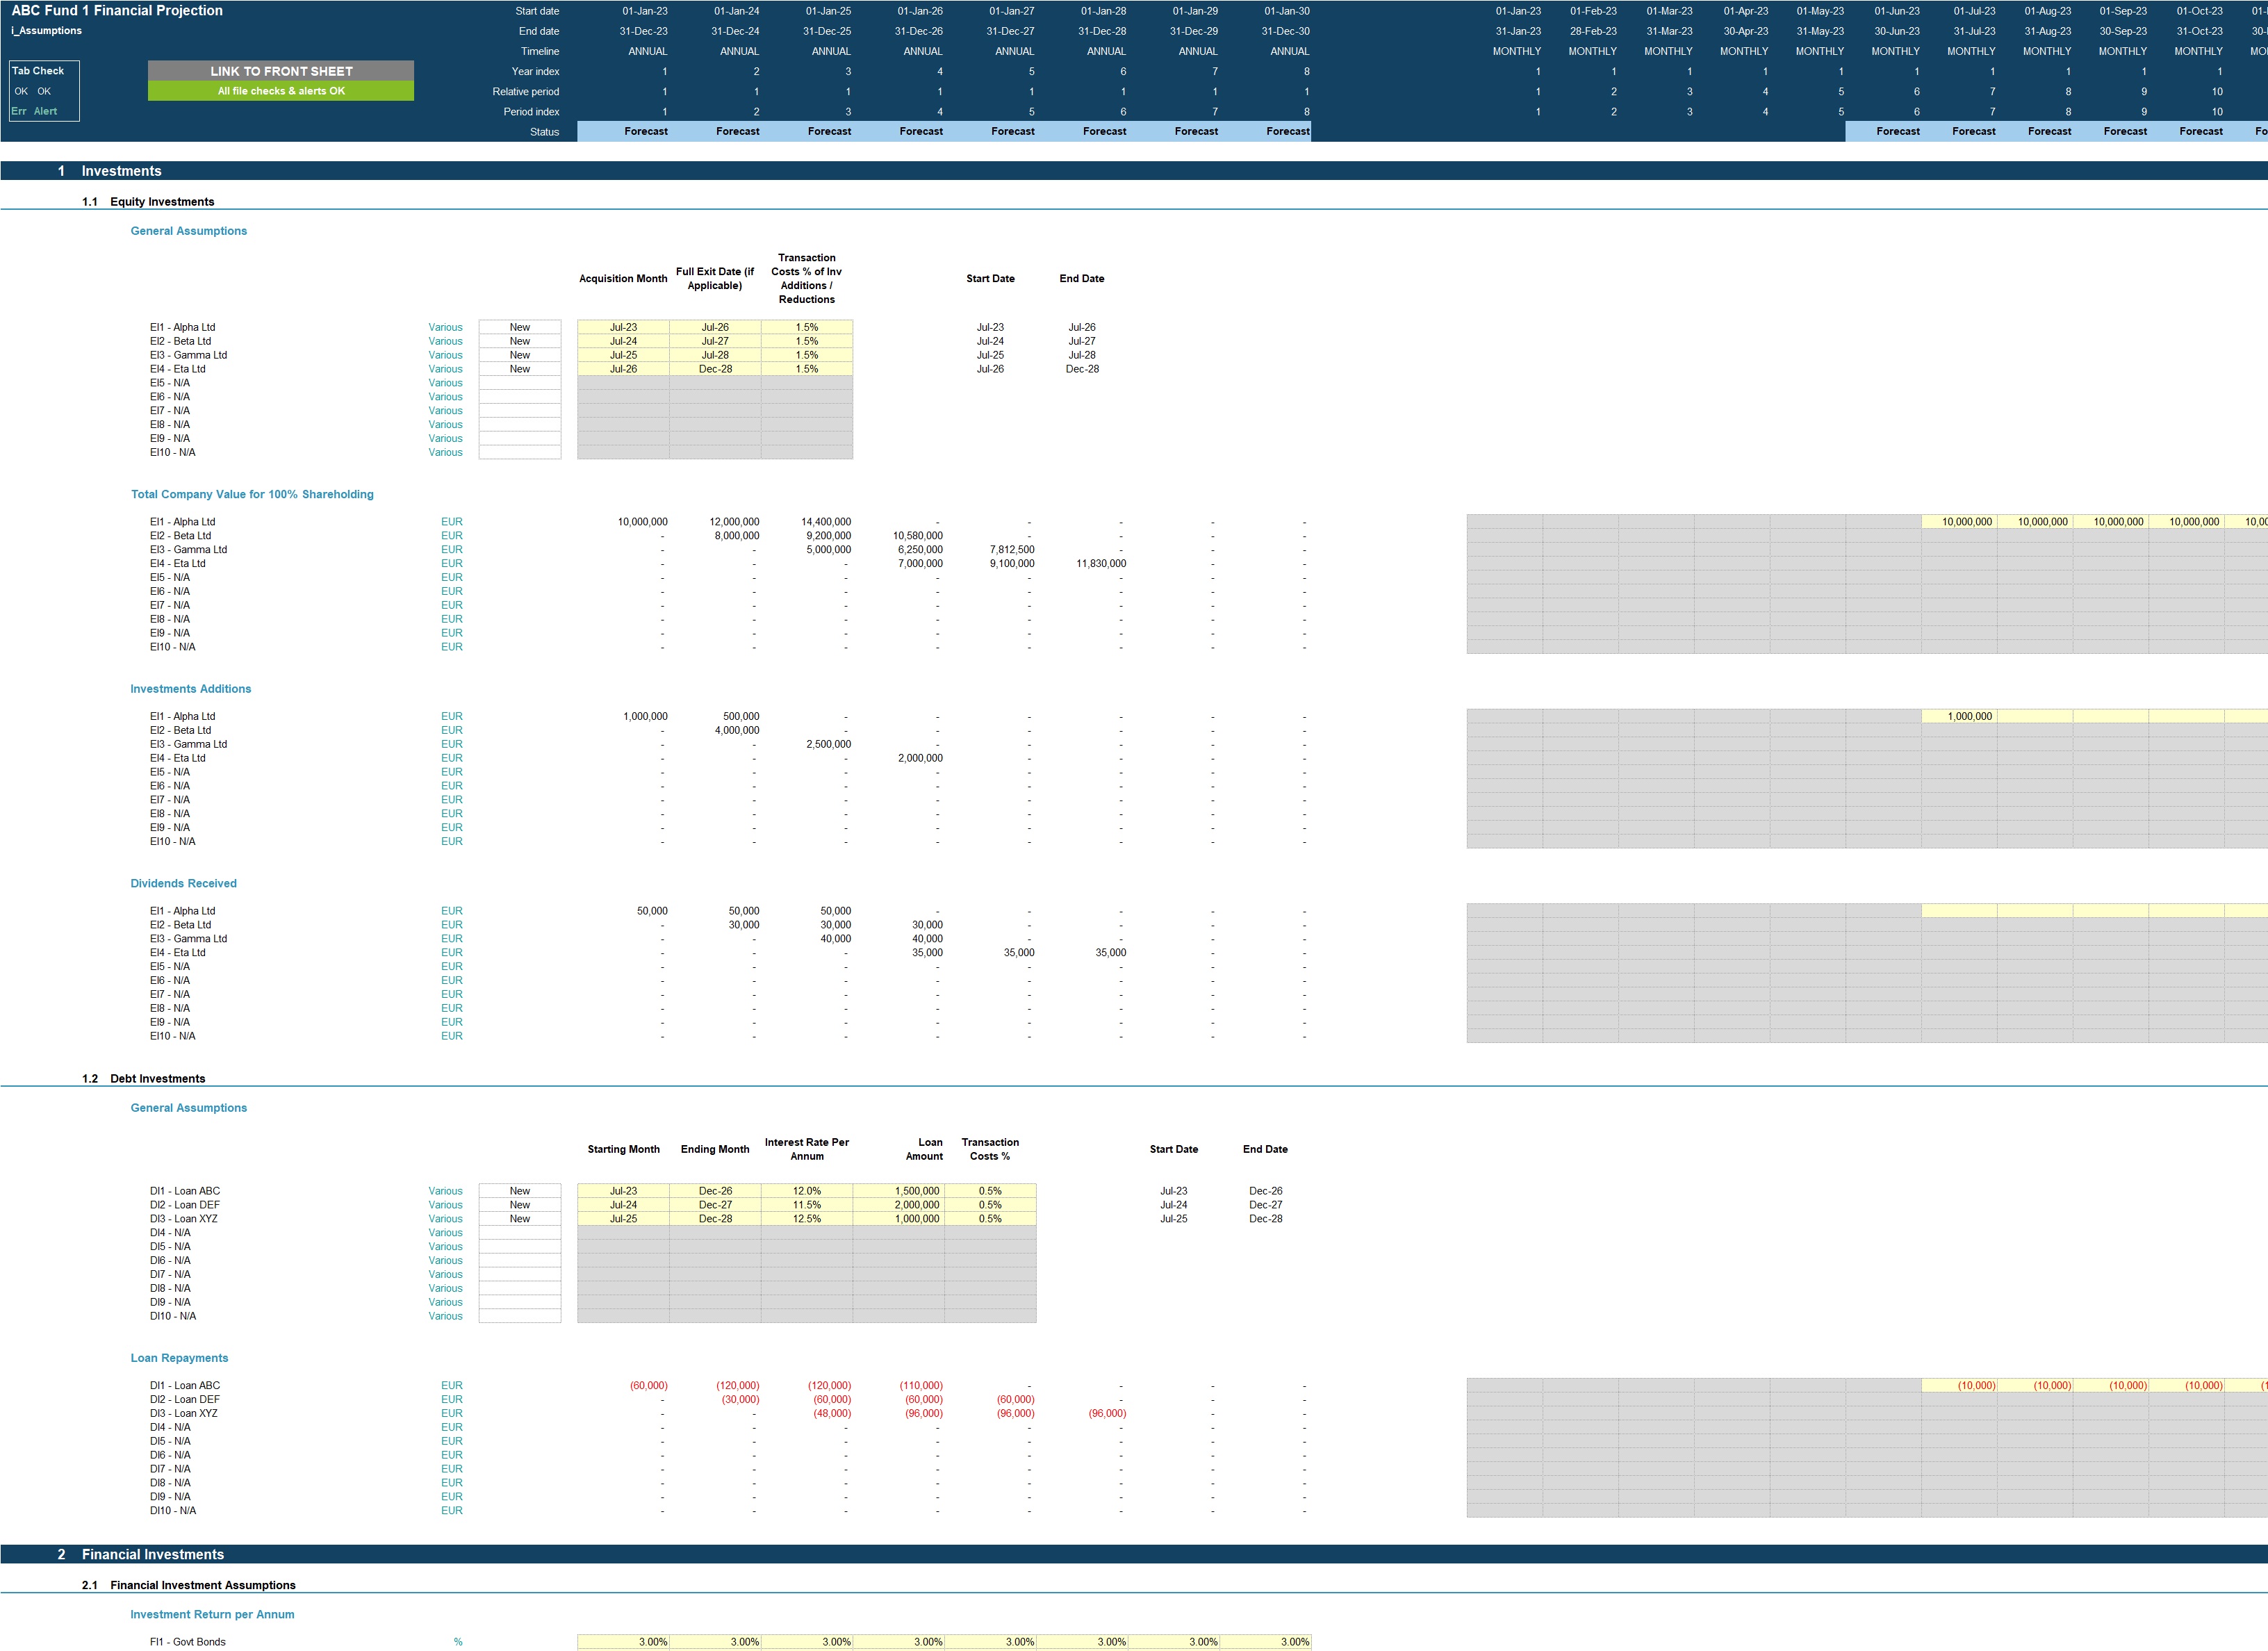
Projection Inputs:
• Equity Investments:
• Acquisition and exit month
• Portfolio company valuation
• Investment additions
• Transaction cost %
• Dividends received
• Debt Investments:
• Starting and maturity month
• Interest rate per annum
• Loan amount
• Transaction cost %
• Loan repayments
• Financial Investment Assumptions
• Investment Return per Annum;
• Target Cash Balances;
• Investment Allocation percentages;
• Transaction cost %;
• Other cost inputs including
• Staff costs;
• Other operating costs;
• Corporate tax inputs including rate and payment periods;
• Fixed Assets including addition amounts and useful life;
• Borrowings including addition/redemption amounts and interest rate;
• Capital contributions and distributions;
• Distribution waterfall assumptions:
• GP and LP equity contribution splits
• LP hurdle rates
• GP catch up provisions and carried interest
• GP and LP excess return splits
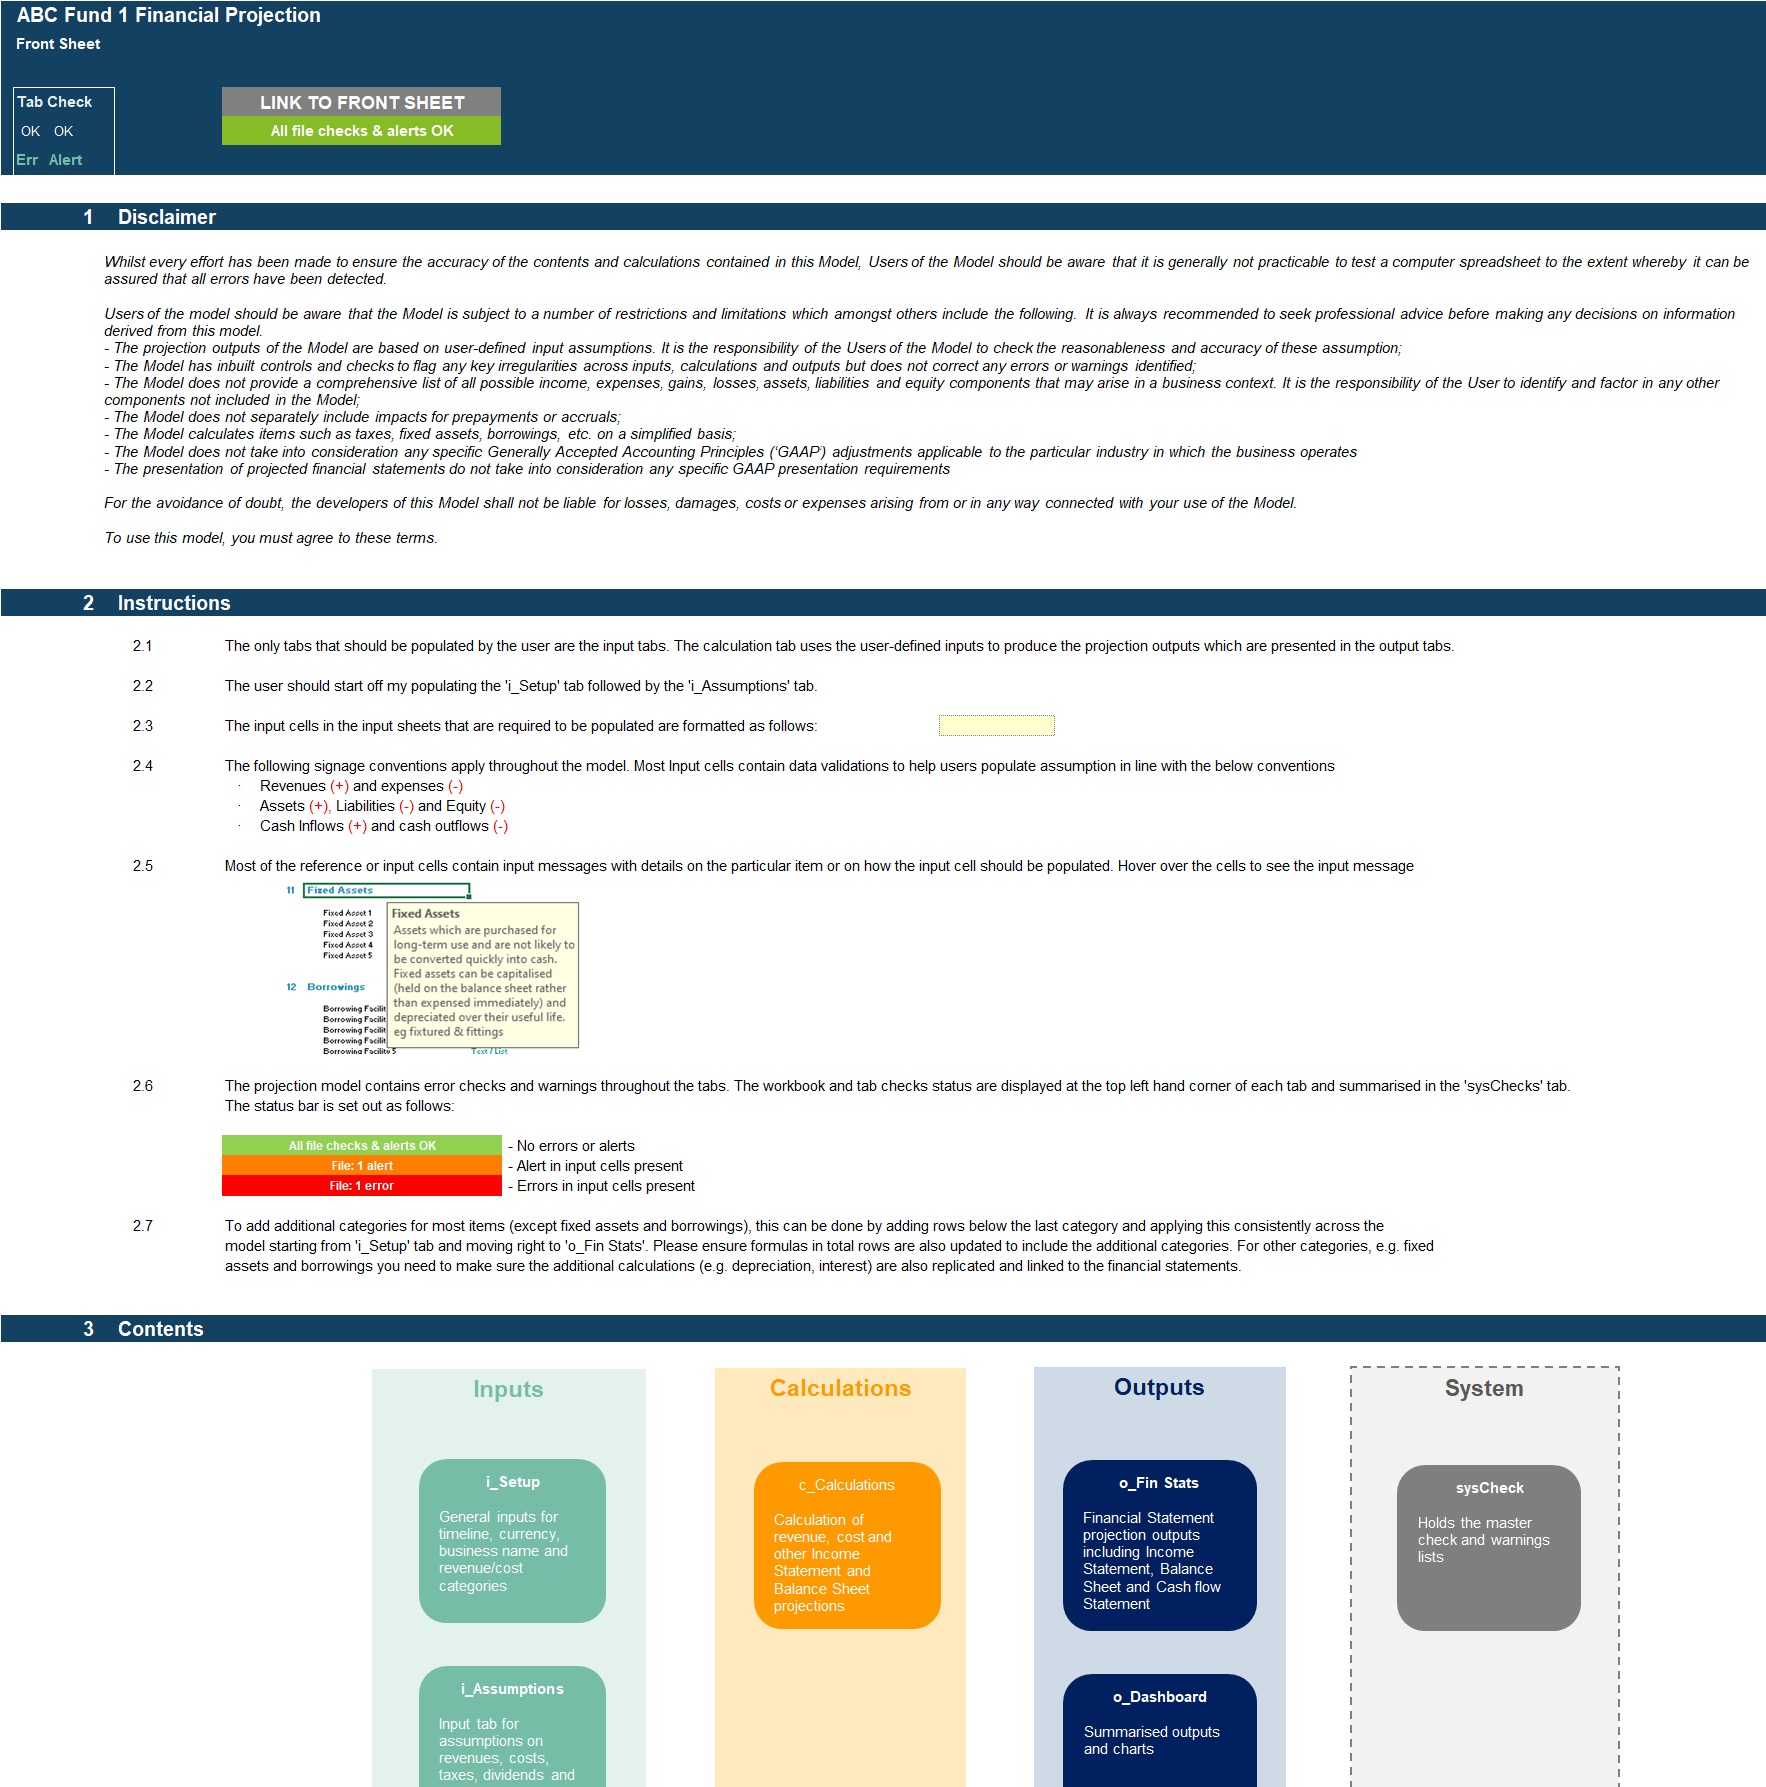
MODEL STRUCTURE
The model comprises of 7 tabs split into input ('i_'), calculation ('c_'), output ('o_') and system tabs. The tabs to be populated by the user are the input tabs ('i_Setup' and 'i_Assumptions'). The calculation tab uses the user-defined inputs to calculate and produce the projection outputs which are presented in 'o_Fin Stats' and ‘o_Dashboard' tabs.
System tabs include:
• A 'Front Sheet' containing a disclaimer, instructions and contents;
• A Checks dashboard containing a summary of checks by tab.
KEY FEATURES
Other key features of this model include the following:
• The model follows best practice financial modelling guidelines and includes instructions, checks and input validations;
• The model is not password protected and can be modified as required following download;
• The model includes an 8-year timeline split on a monthly basis and summarised on an annual basis;
• The model allows for the following number of underlying categories for each line item (these can be easily expanded if required):
• Equity investments – 10 investments
• Debt investments – 10 investments
• Financial Investments – 5 categories
• Staff costs – 8 categories;
• Other expenses – 15 categories;
• Fixed Assets – 5 categories;
• Borrowings – 3 facilities;
• Apart from projecting revenue and costs the model includes the possibility to model, financial investments, fixed assets, borrowings, corporate tax and distribution waterfall.
• Fund details, currency, starting projection period are fully customisable;
• Revenue, cost, fixed asset and Borrowing category descriptions are fully customisable;
• The model includes instructions, checks and input validations to help ensure input fields are populated accurately;
• The model includes a checks dashboard which summarises all the checks included in the various tabs making it easier to identify any errors.
This model provides a comprehensive framework for analyzing and projecting the financial performance of private equity investments. Users can easily customize inputs to reflect their unique investment strategies, ensuring accurate forecasting and insightful decision-making.
Got a question about the product? Email us at support@flevy.com or ask the author directly by using the "Ask the Author a Question" form. If you cannot view the preview above this document description, go here to view the large preview instead.
TOPIC FAQ
What core inputs are required to run a private equity fund financial projection model?
Core inputs include setup fields (name, currency, start month), equity and debt investment schedules (acquisition/exit months, valuations, loan amounts, interest rates, transaction cost %), financial investment assumptions, staff and operating costs, fixed assets, borrowings, tax rates, capital contributions and distribution waterfall assumptions. These cover equity and debt inputs and distribution parameters such as LP hurdle rates.How are distribution waterfalls modelled in PE fund financial projections?
Distribution waterfalls allocate proceeds between LP and GP via defined splits: initial capital contributions, LP hurdle rates, GP catch-up provisions, carried interest and excess-return splits. A PE projection model typically calculates cumulative cashflows and applies those waterfall rules to produce GP/LP allocations and a distribution waterfall schedule.What standard outputs should I expect from a PE fund projection workbook?
Expect monthly Income Statement, Balance Sheet and Cash Flow projections (summarised annually), dashboards showing key ratios, charts of AUM/NAV, IRR for fund, GP and LP, IRR and net cash flows by investment, and MOIC metrics. These outputs are typically presented across a monthly timeline of up to 8 years.How many underlying investments and expense categories can a typical PE model manage?
A robust PE model supports multiple categories; this model specifically handles up to 10 equity investments, 10 debt investments, 5 financial investment categories, 8 staff cost categories, 15 other expense categories, 5 fixed asset categories, and 3 borrowing facilities.What features should I look for to reduce setup time when buying a projection model?
Look for prebuilt input tabs (e.g., i_Setup, i_Assumptions), clear Front Sheet instructions, input validations, and a Checks dashboard summarising errors by tab; these elements speed configuration and validation. Flevy's Private Equity (PE) Fund Financial Projection Model includes these features and a Checks dashboard.How flexible are downloadable PE projection models for customization and audit?
Flexibility depends on protection and structure; models that are not password protected and provide editable category descriptions, customizable dates/currency, and open calculation tabs allow modification and audit. The referenced model is not password protected and allows full customization of categories and projection settings.Which finance roles use PE fund models and what activities do they perform with them?
PE analysts build monthly three-statement projections and calculate investment-level IRR; fund managers run scenario analyses and forecast NAV/AUM; investor relations teams prepare dashboards for LP reporting; CFOs manage cashflow planning and borrowing schedules—typically producing IRR, MOIC and waterfall distributions.How do model checks and validations improve projection reliability in PE models?
Integrated checks and input validations catch missing or inconsistent inputs, while a Checks dashboard summarises reconciliation items by tab to speed troubleshooting. Using structured checks reduces manual errors and supports auditability; the model includes a Checks dashboard summarising all checks by tab.Source: Best Practices in Private Equity, Integrated Financial Model Excel: Private Equity (PE) Fund Financial Projection Model Excel (XLSX) Spreadsheet, Projectify
ABOUT THE AUTHOR
We are financial modelling professionals, accountants and CFA charterholders with experience working within Deloitte supporting clients with their financial planning and decision support needs. Our aim is to provide robust and easy-to-use financial models that follow good practice financial modelling guidelines and assist individuals and businesses with key financial planning and analysis ... [read more]
Ask the Author a Question
You must be logged in to contact the author.
