
 Click main image to view in full screen. Unlock all 9 preview images:
Private Equity Fund Model (European & American Waterfall, GP Clawback) – Excel XLSX
Excel (XLSX)


BENEFITS OF THIS DOWNLOADABLE EXCEL DOCUMENT
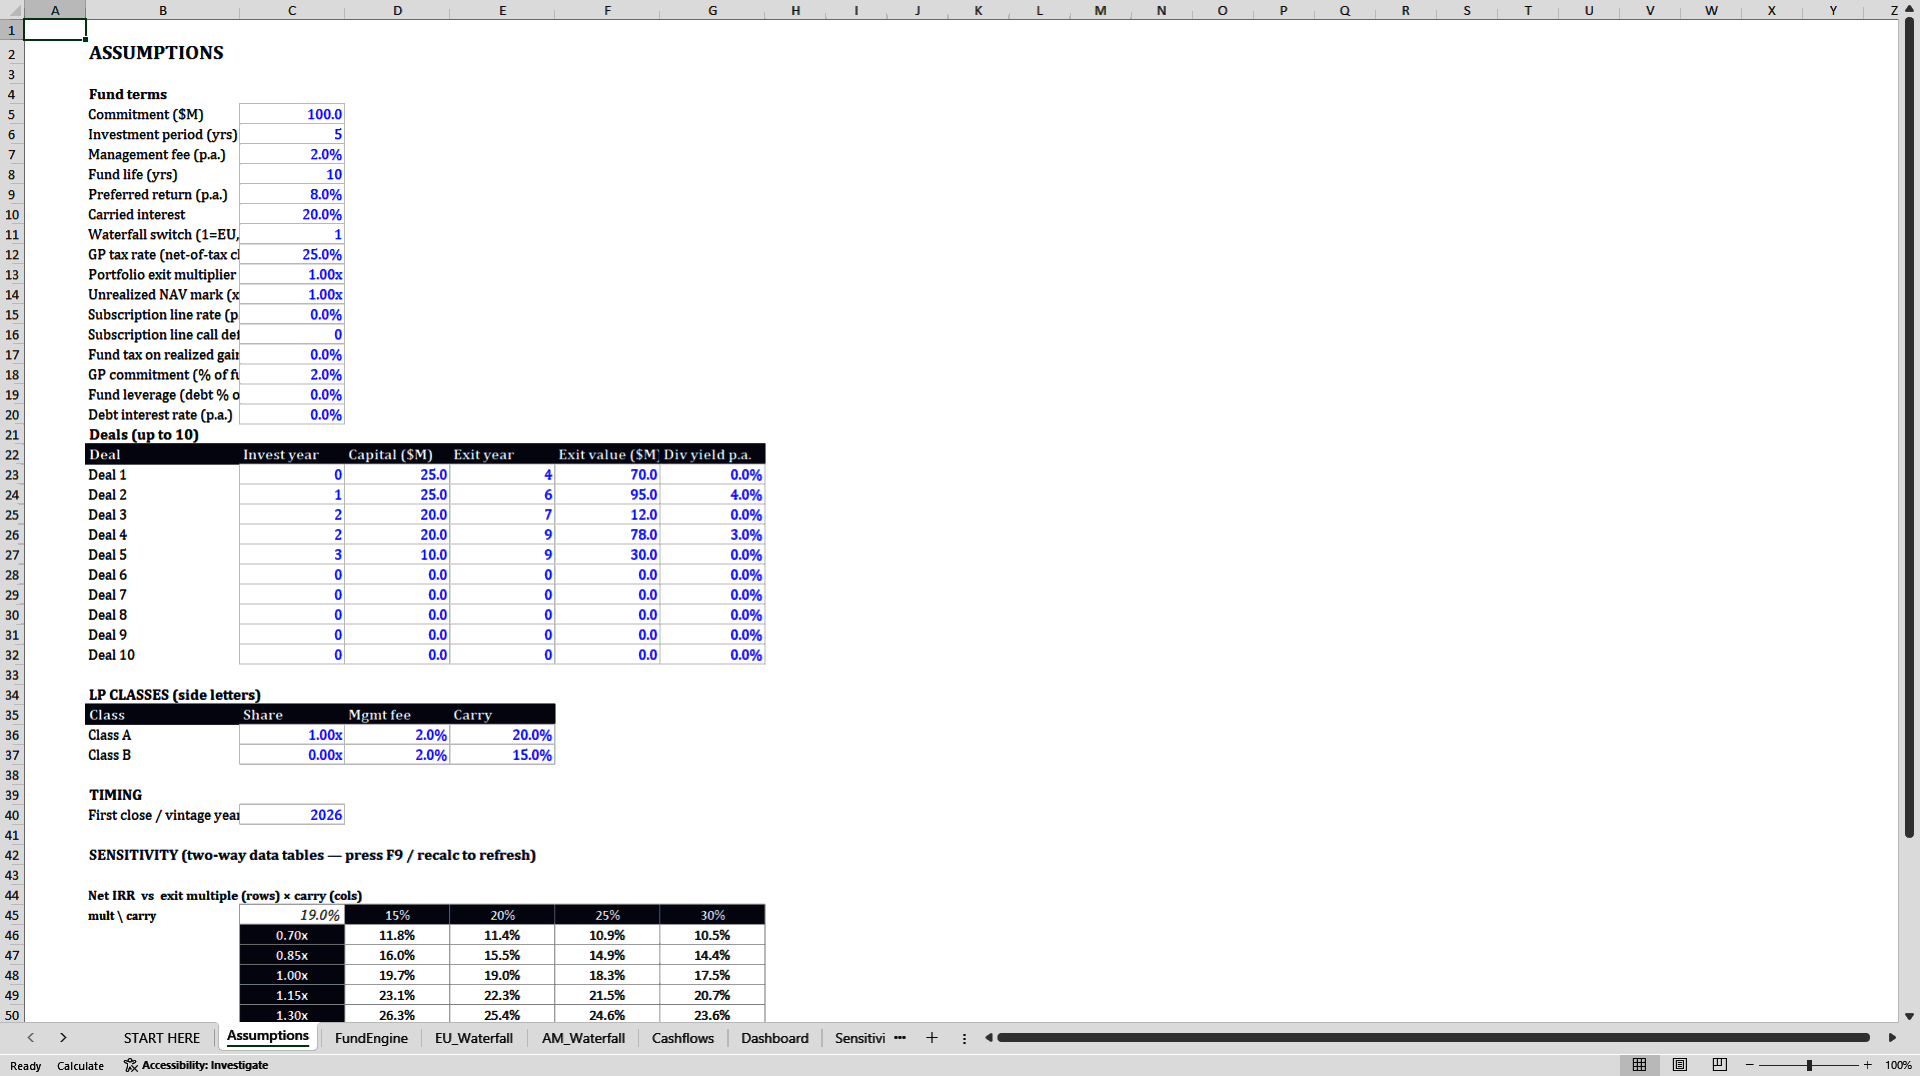
- Compare European and American waterfall economics on the same deal set from one cell (Assumptions C11).
- Calculates the American-waterfall GP clawback at fund end, gross and net of tax.
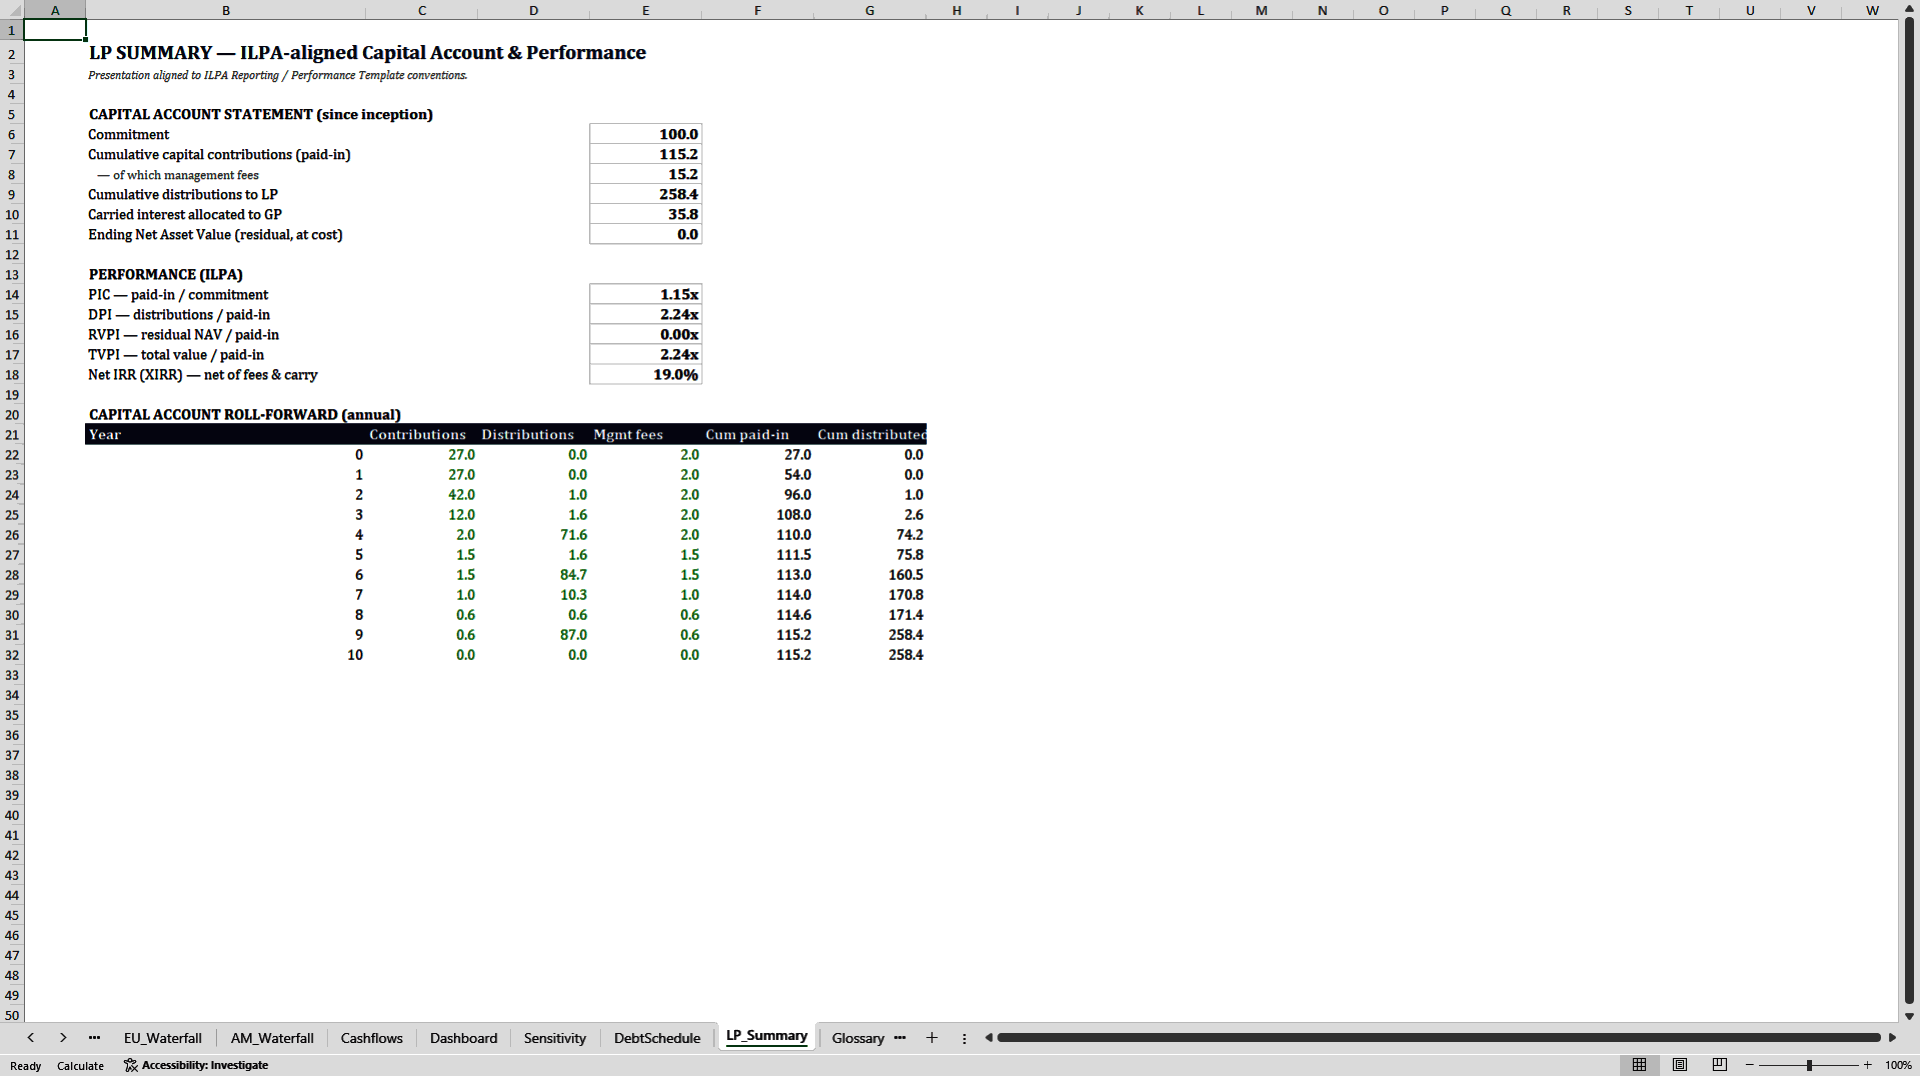
- ILPA-style LP capital account, multi-class LP allocations, and an 8-check reconciliation panel.
PRIVATE EQUITY EXCEL DESCRIPTION
Most fund models pick a waterfall and build around it: European (whole-fund) or American (deal-by-deal), never both. Comparing the two live economics on the same deals means building or buying a second file. This workbook keeps a single deal table and one set of LP/GP terms, and a single cell on Assumptions (C11: 1 = European, 2 = American) recomputes GP carry, LP distributions, and the American-only GP clawback.
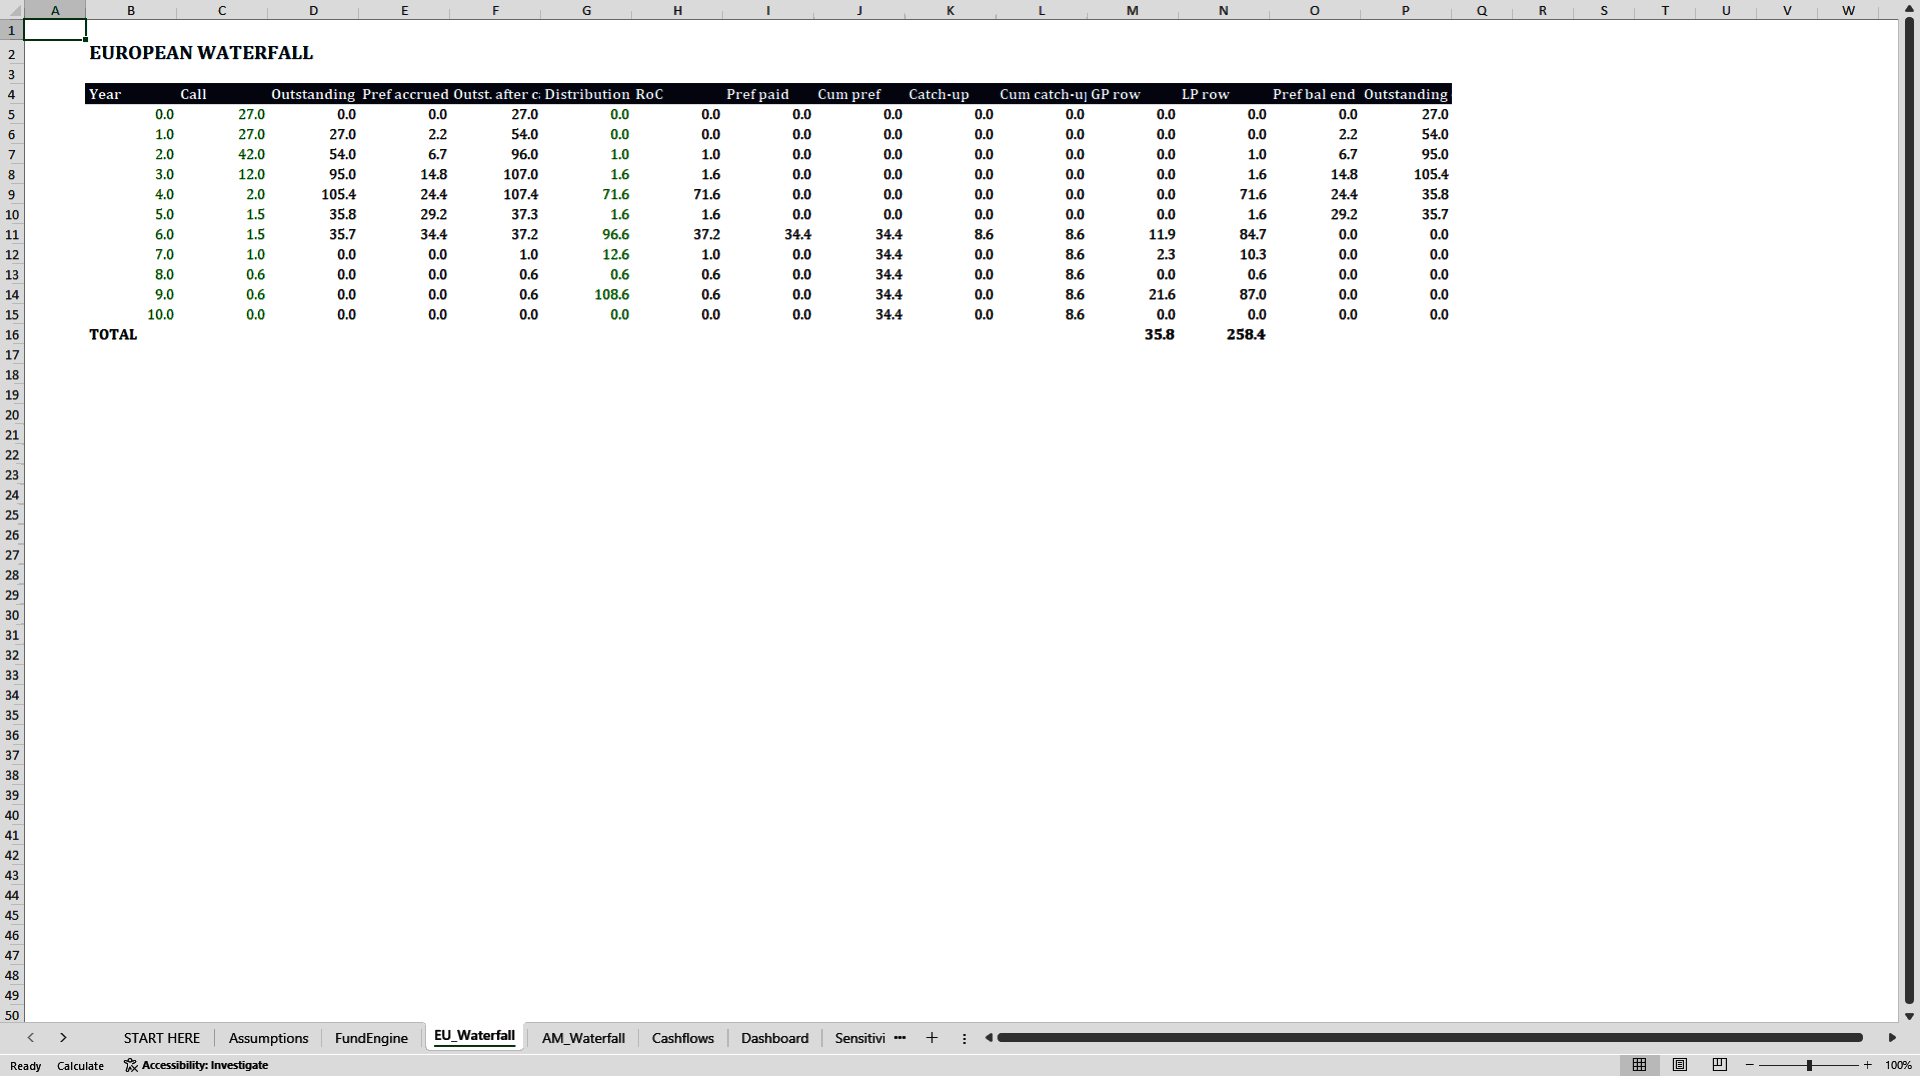
The switch matters because European and American waterfalls pay carried interest at different points in the fund's life. Under an American waterfall, a GP paid early on strong deals can end up owing money back to LPs if later deals underperform: that's the clawback, and a model built around only one waterfall type can't show it. Showing it without splitting gross from net-of-tax also understates what the GP actually owes after tax. Both structures are legitimate, get chosen at fund formation, and move real dollars between LP and GP on an identical set of deals.
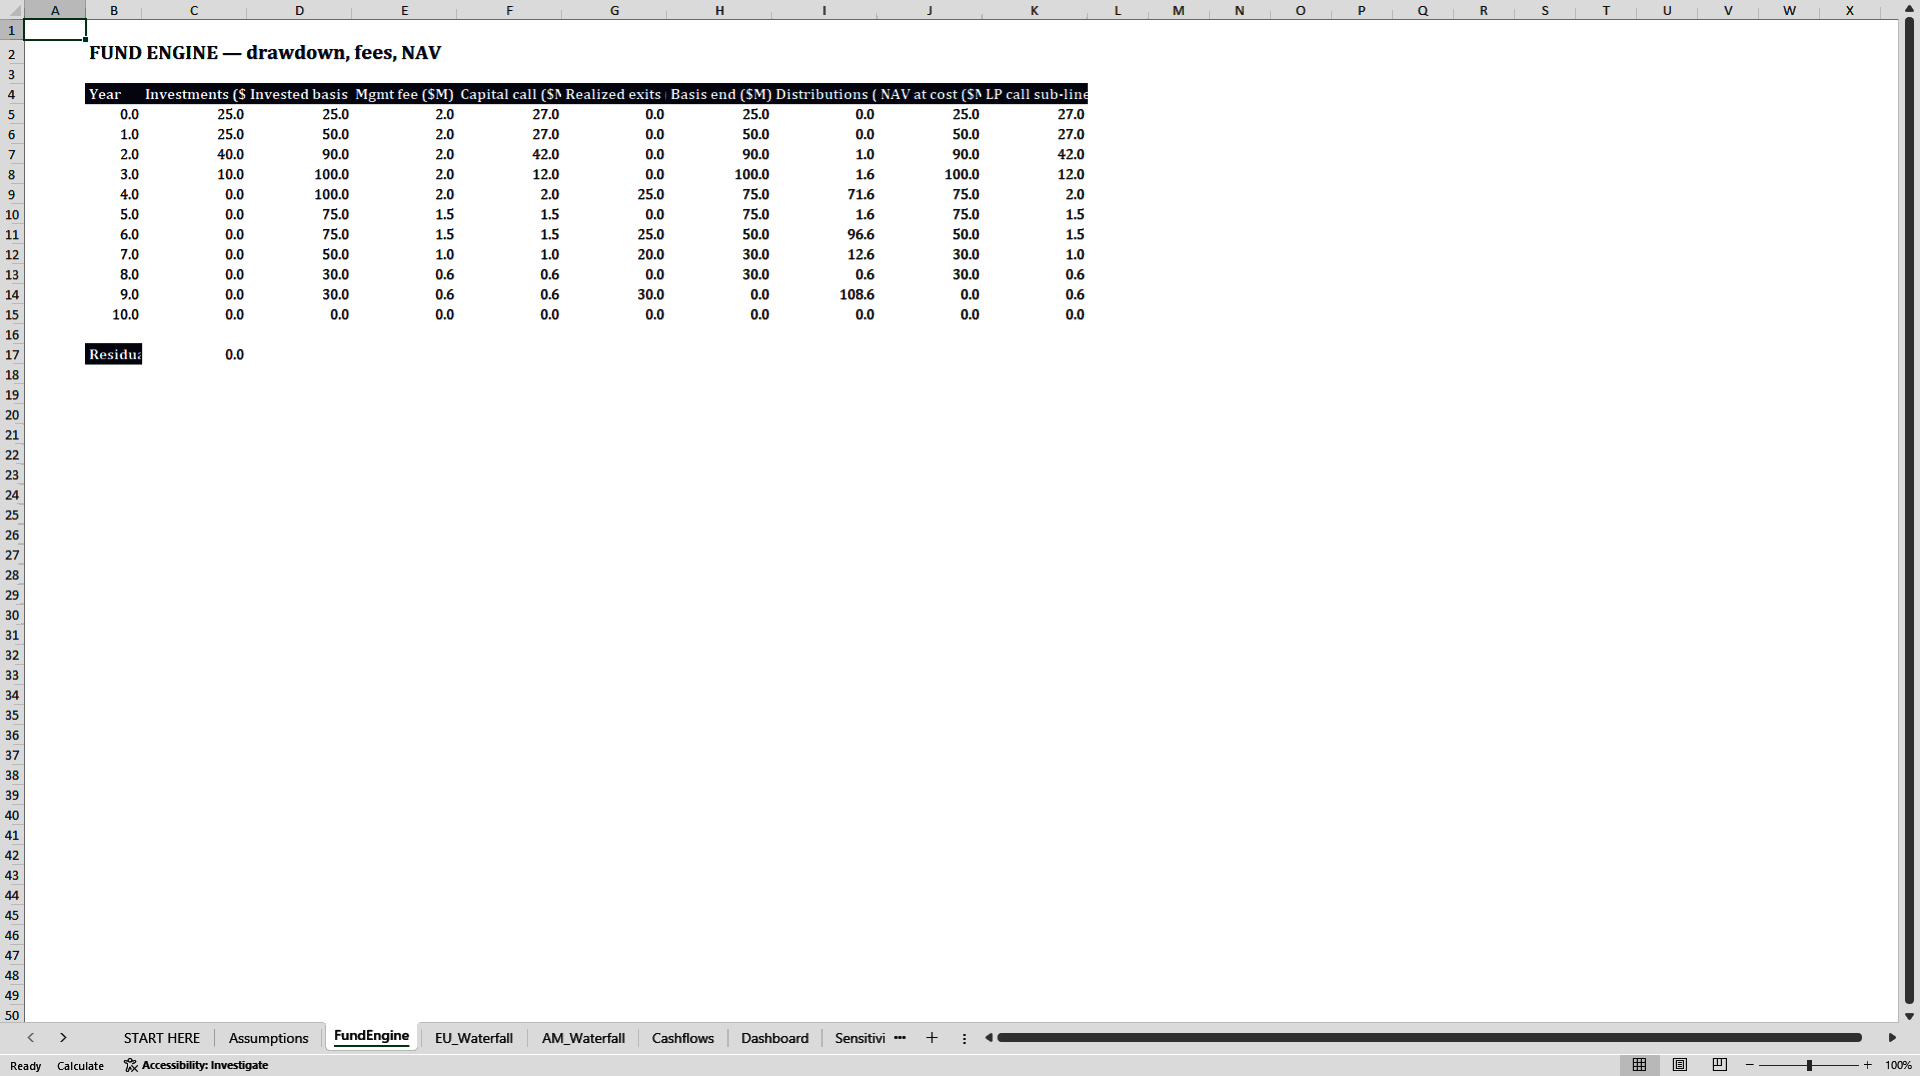
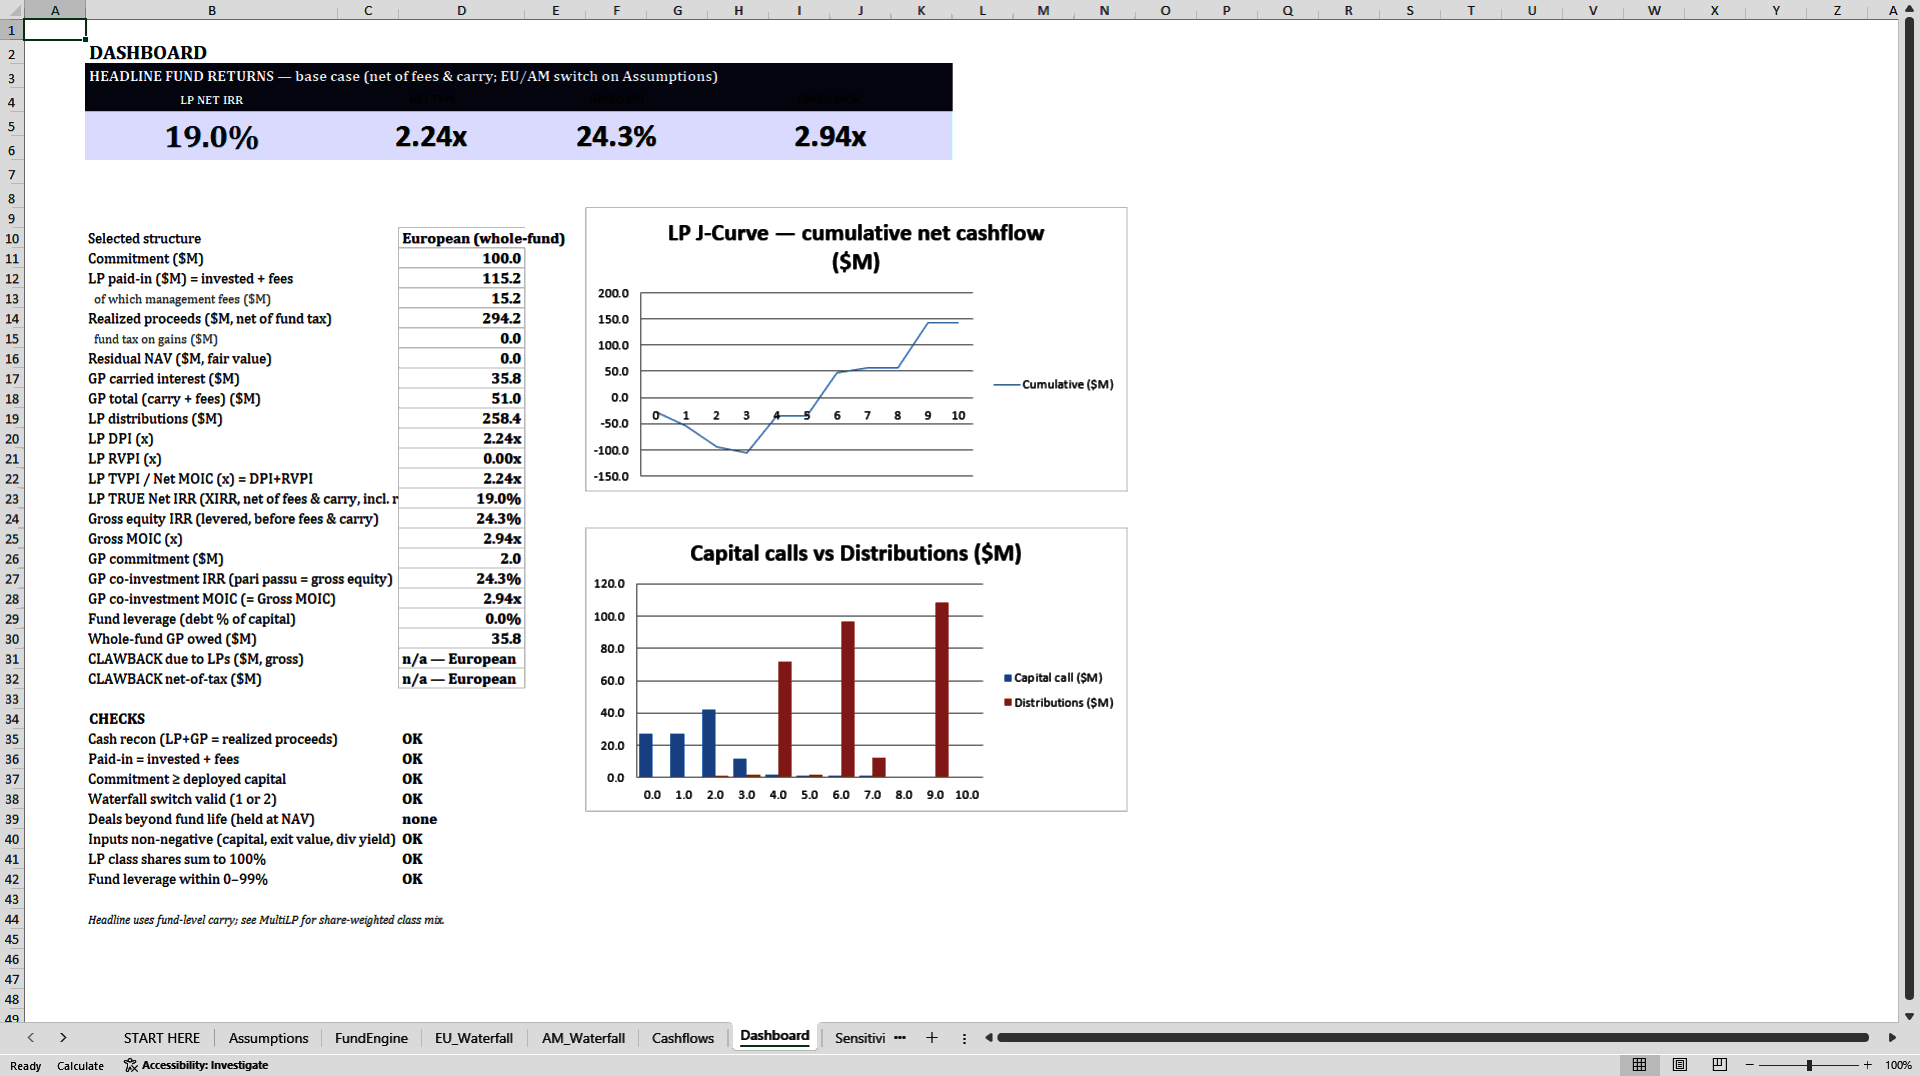
The engine runs carried interest and LP distributions under both waterfalls off one deal table (investment year, capital, exit year, exit value, optional per-deal dividend yield), draws capital down through a call schedule, nets out management fees and fund/GP tax, and prices optional fund leverage through a dedicated debt schedule. Switch to American and it calculates the GP's clawback at fund end, gross and net of tax. LP-side reporting rolls into a capital account built to the ILPA reporting template, and a separate tab supports multiple LP classes with share allocations checked to sum to 100 percent. The Dashboard runs eight checks before it lets you trust a number: cash reconciliation, paid-in versus invested plus fees, commitment versus deployed capital, waterfall switch validity, deals beyond fund life, non-negative inputs, LP class shares summing to 100 percent, and fund leverage within range.
Same $100M commitment, same deals, same $2M GP commitment, 0% leverage: flip the switch and this is what moves.
European American
LP Net IRR 19.0% 17.5%
LP Net MOIC / TVPI 2.24x 2.20x
Gross IRR (levered) 24.3% 24.3%
Gross MOIC 2.94x 2.94x
GP carried interest $35.8M $40.44M
GP total (carry + fees) $51.0M $55.64M
LP distributions $258.4M $253.76M
LP DPI 2.24x 2.20x
Clawback due to LPs (gross) n/a $4.64M
Clawback net-of-tax n/a $3.48M
LP paid-in capital is $115.2M under either mode ($15.2M of it management fees), against $294.2M of realized proceeds and $0 residual NAV. Gross IRR and gross MOIC hold steady between modes because the waterfall only reshuffles the timing of the same gross proceeds between LP and GP; the deal-level economics never change.
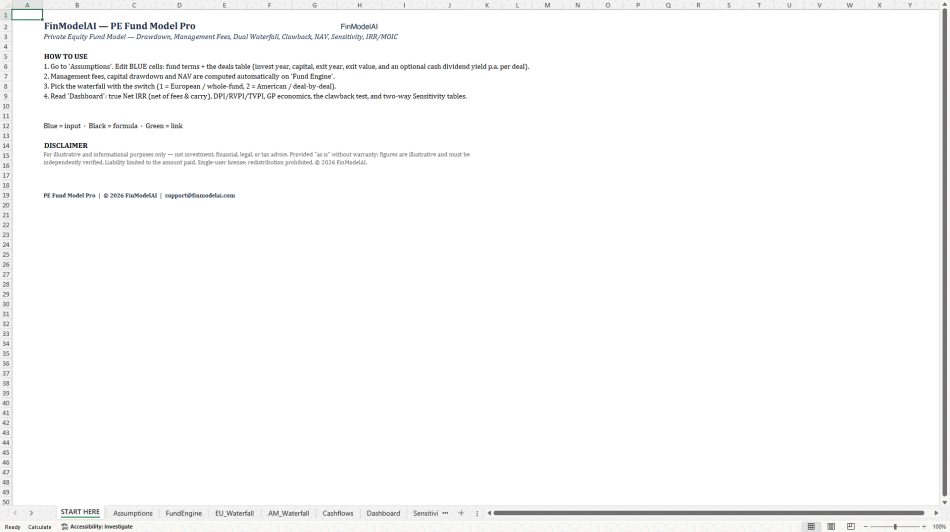
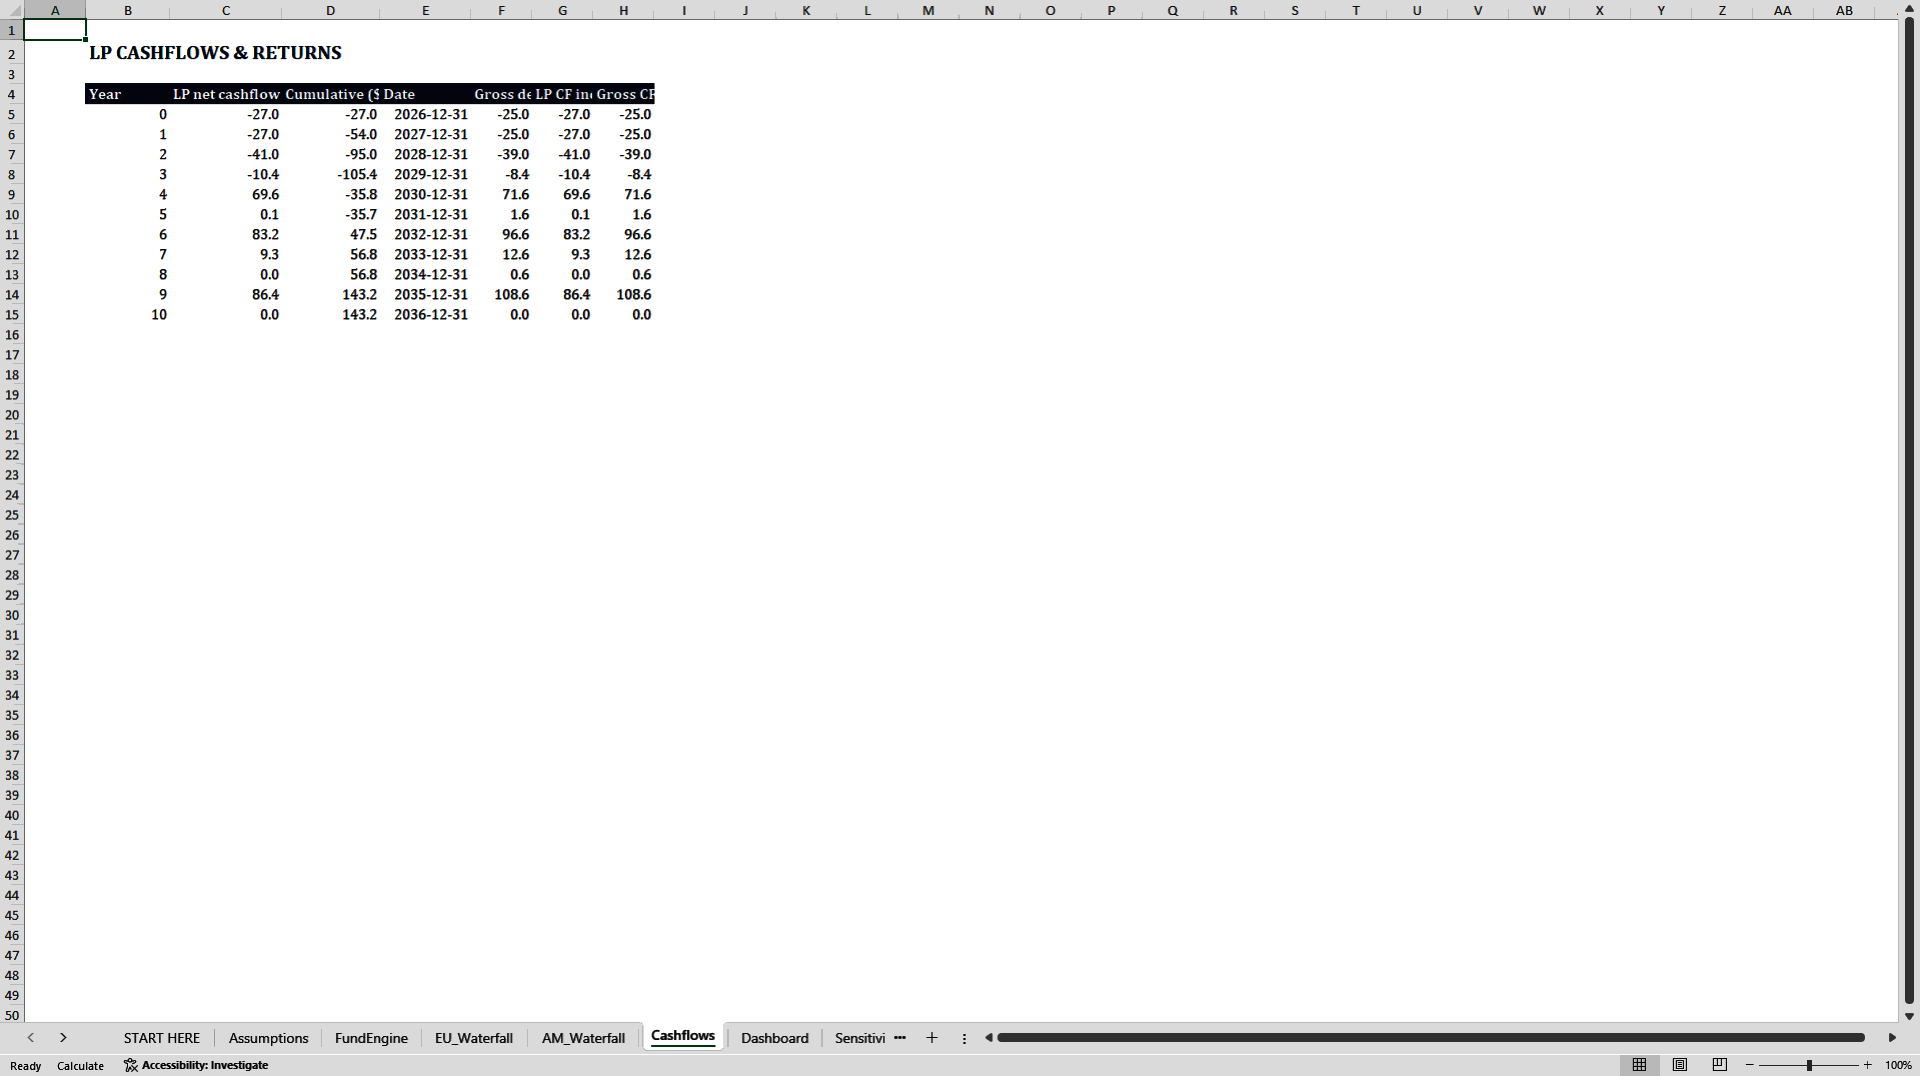
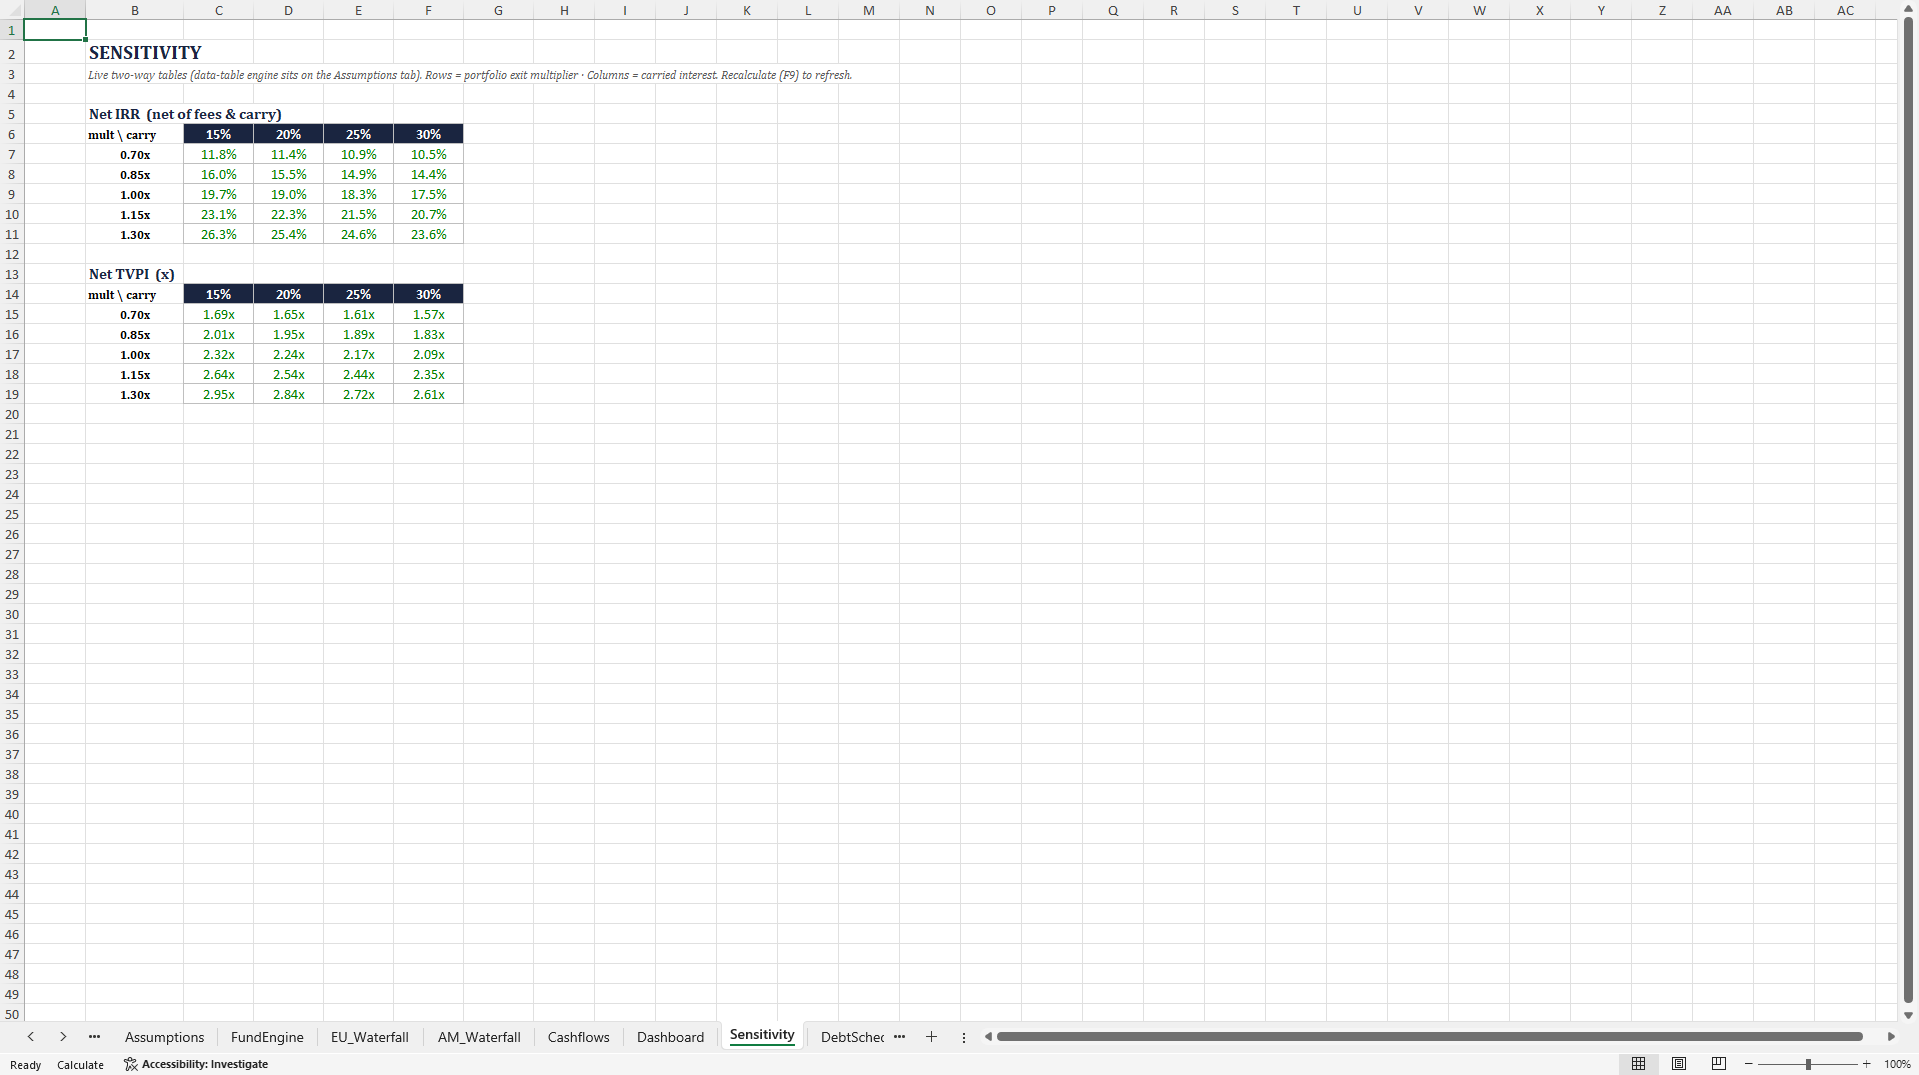
Twelve tabs, in order: START HERE for navigation, Assumptions for the deal table and the C11 switch, FundEngine for capital-call mechanics, EU_Waterfall and AM_Waterfall for the two distribution engines including the clawback, Cashflows for the consolidated LP/GP timeline, Dashboard for headline metrics and the 8-check panel, Sensitivity for two live grids running Net IRR and Net TVPI against exit multiple and carried interest, DebtSchedule for fund-level leverage, LP_Summary for the ILPA-style capital account, Glossary for term definitions, and MultiLP for multi-class LP allocations with the 100-percent check.
Fund analysts, associates and controllers explaining the economic gap between a European and an American waterfall on identical deals, during fund formation, LPA negotiation or LP reporting, are the intended user; so are LPs who want to price a proposed GP clawback before signing. This isn't built for fund-of-funds structures, co-investment vehicles or GP-led secondaries.
What the model does not do: no macros and no VBA, no live market-data feeds (every assumption is entered by hand on Assumptions), and no deals scheduled beyond the end of fund life, which the Dashboard flags rather than silently ignoring. The demo case ships with $0 residual NAV and 0% fund leverage; leverage is configurable on DebtSchedule but is not illustrated at a non-zero level in the demo.
You get the workbook (.xlsx, no macros, no circular references), a README walking through the switch, the Dashboard checks and the Sensitivity grids, and the demo case above fully populated on first open: 1,273 live formulas across the 12 tabs, 564 of them inside MultiLP. Works in Excel for Windows and Mac.
License: single user.
Got a question about the product? Email us at support@flevy.com or ask the author directly by using the "Ask the Author a Question" form. If you cannot view the preview above this document description, go here to view the large preview instead.
Source: Best Practices in Private Equity, Integrated Financial Model Excel: Private Equity Fund Model (European & American Waterfall, GP Clawback) Excel (XLSX) Spreadsheet, FinModelAI




























