

Private Investment Firm 10-Year 3 Statement Financial Model – Excel XLSX
Excel (XLSX)
BENEFITS OF THIS DOWNLOADABLE EXCEL DOCUMENT
- Provides a complete framework for modeling, managing, and presenting a Private Investment Firm's financial performance with institutional-grade precision.
- Delivers a fully integrated 10-year 3-statement financial model purpose-built for private equity, venture capital, family offices, and investment banking professionals.
- Enables fund managers, CFOs, and investment professionals to plan capital deployment, track portfolio returns, and stress-test fund economics with confidence.
PRIVATE EQUITY EXCEL DESCRIPTION
Curated by McKinsey-trained Executives
PRIVATE INVESTMENT FIRM FINANCIAL MODEL | Institutional-Grade 10-Year Integrated 3-Statement Forecast
Build the exact financial infrastructure that top-tier private equity firms, family offices, venture capital funds, and investment banks use to raise capital, deploy it with discipline, manage a live portfolio, and exit at maximum value – modeled with the precision, depth, and professional structure that institutional investors and sophisticated LPs demand on day one.
Whether you're a fund manager raising your first institutional fund, a family office formalizing your investment framework, a PE sponsor preparing for a fund audit or LP review, a private credit manager building out your portfolio monitoring infrastructure, a CFO of a holding company stress-testing capital deployment, or an investment banker modeling a fund-of-funds acquisition – this fully integrated 10-Year 3-Statement Financial Model gives you the exact financial engine to plan, pitch, deploy, monitor, and exit with complete institutional credibility.
💡 What's Inside
This model covers every financial dimension of running and scaling a Private Investment Firm – from fund inception and LP capital raising through a decade of portfolio construction, active asset management, exit harvesting, and carried interest crystallization. Built on Financial Modeling World Cup best practices, it's fully dynamic, cross-linked across all tabs, and ready to customize for your specific fund strategy, portfolio construction approach, and distribution waterfall.
📥 Inputs
• 🏛️ Fund Architecture & AUM Engine – Initial AUM, long-term target AUM, annual LP capital raising schedule, GP co-investment rate, fund life, investment period length, and recycling provisions – all individually configurable from a single Assumptions tab – plus a full AUM bridge rolling Beginning AUM forward through new capital raised, portfolio appreciation, and exit distributions to Ending AUM for every year of the forecast – the exact fund architecture any institutional LP, placement agent, or fund administrator interrogates on page one of their due diligence checklist
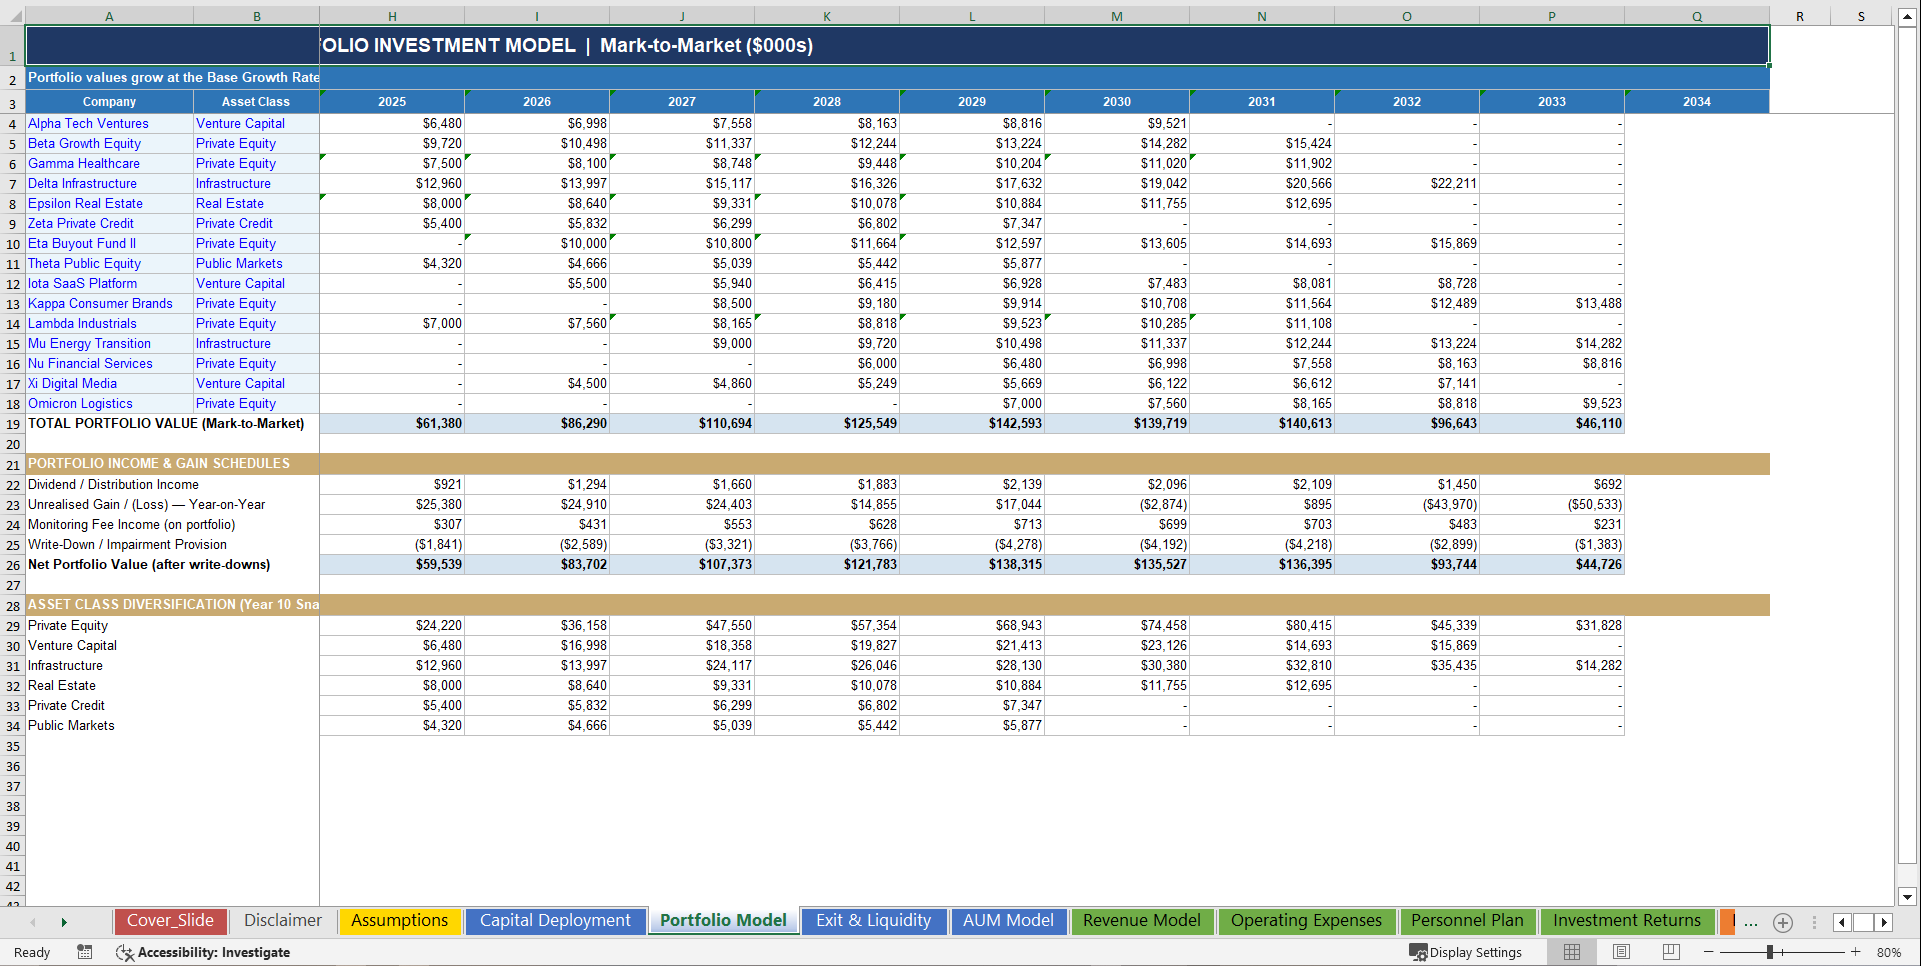
• 📊 Multi-Company Portfolio Investment Model – A live, mark-to-market portfolio spanning Private Equity buyouts, Venture Capital, Infrastructure, Real Estate, Private Credit, and Public Markets – each company modeled with individual entry year, investment amount, ownership percentage, asset class, exit year, and exit multiple – portfolio values growing at the configurable base growth rate and snapping to zero at exit – unrealised gains, dividend income, monitoring fees, and write-down provisions all calculated automatically at the portfolio level – the exact investment schedule any operational due diligence team, fund auditor, or secondary market buyer needs to evaluate your live book
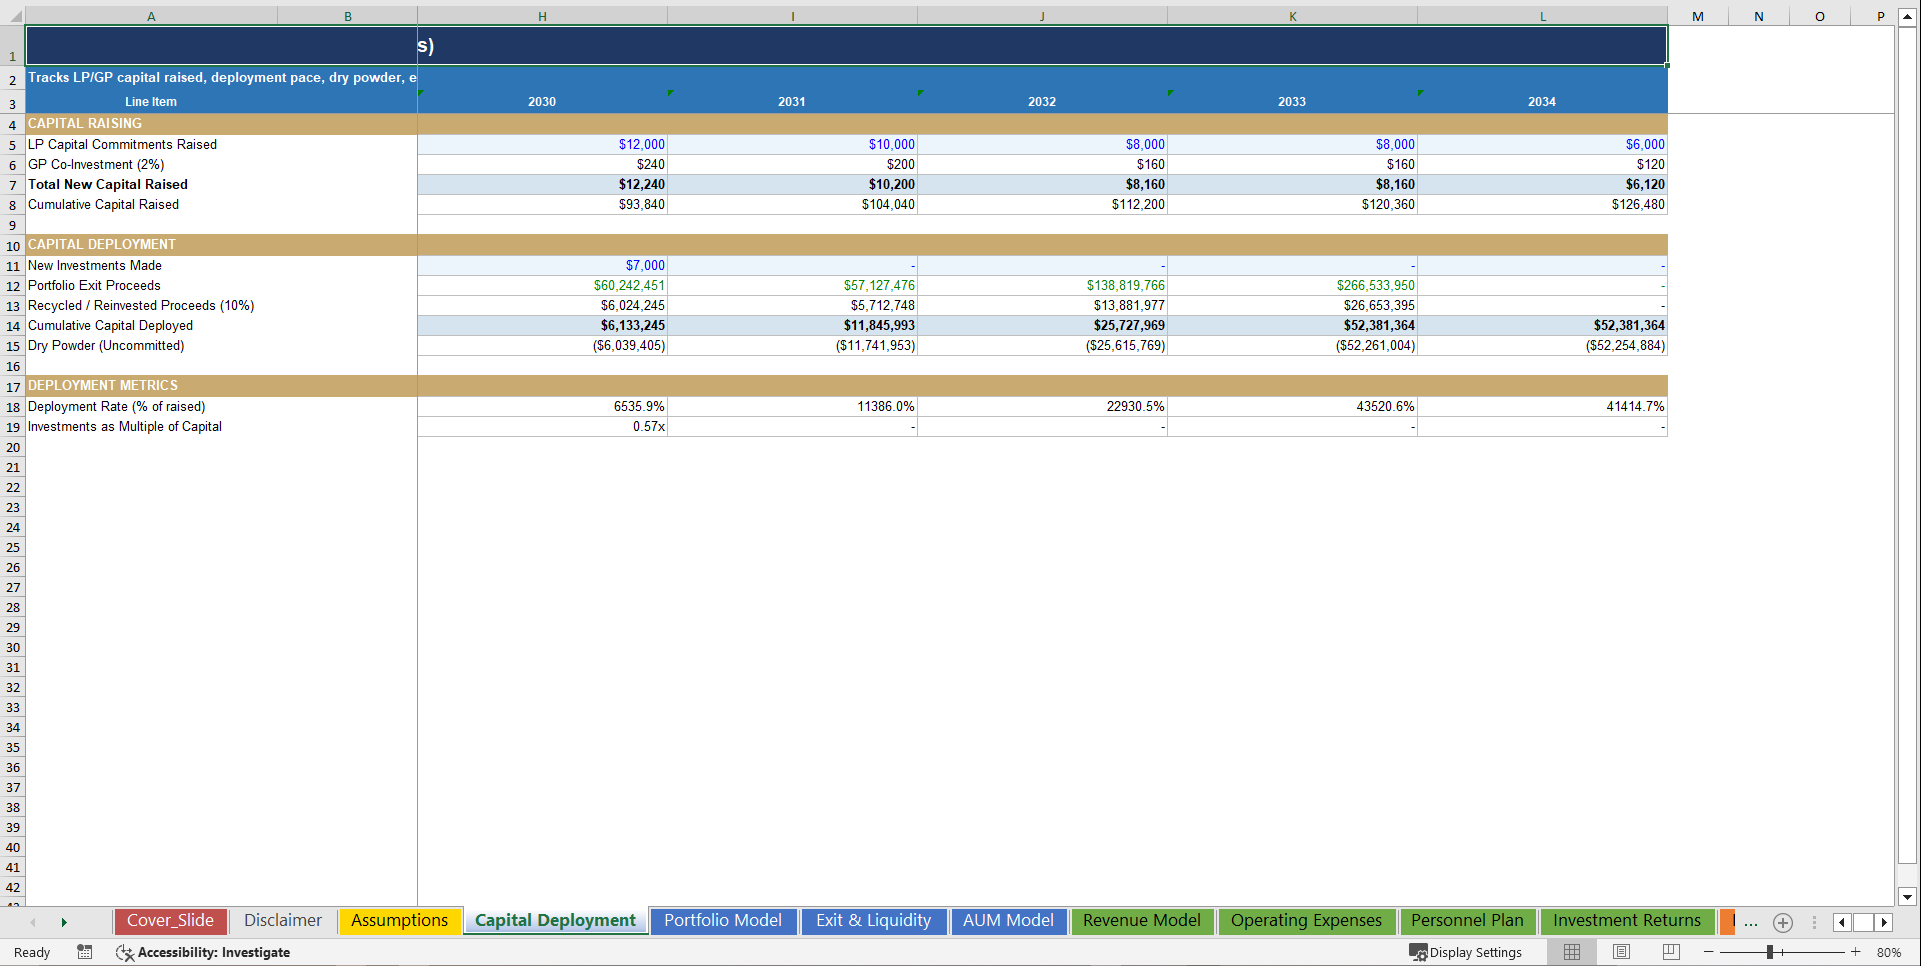
• 🎯 Capital Deployment Schedule with Dry Powder Tracking – Annual LP capital commitments, GP co-investment, total new capital raised, new investments made per year, exit proceeds received, reinvestment of proceeds, cumulative capital deployed, and dry powder remaining – deployment rate and investment-as-multiple-of-capital tracked year over year – the exact capital velocity analysis every GP-LP relationship and fund administrator demands to verify disciplined capital allocation
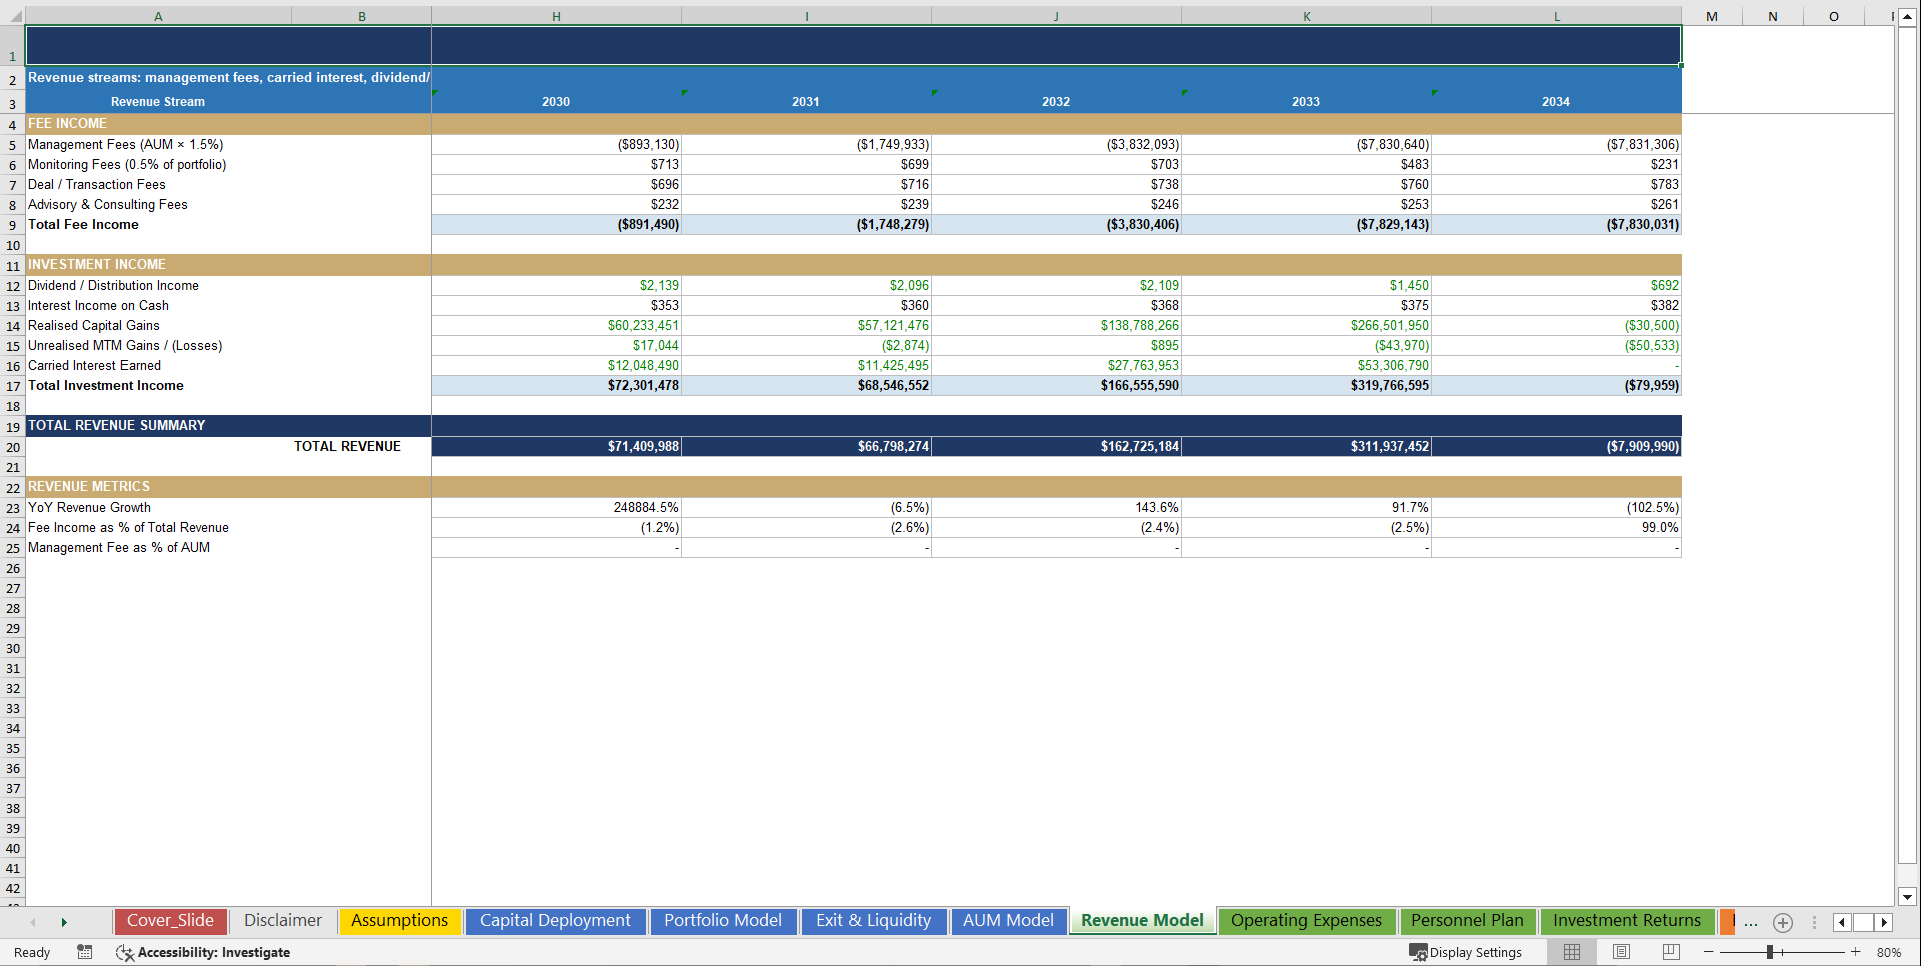
• 💸 Multi-Stream Revenue Model – Management Fees on AUM, Monitoring Fees on portfolio value, Deal & Transaction Fees, Advisory & Consulting Fees, Dividend & Distribution Income, Interest Income on Cash, Realised Capital Gains, Unrealised Mark-to-Market Gains, and Carried Interest earned above the preferred return hurdle – every revenue stream individually modeled and fully flowing into the Income Statement – the complete revenue architecture any institutional investor, credit committee, or LP advisory board needs to validate your fee economics and return profile
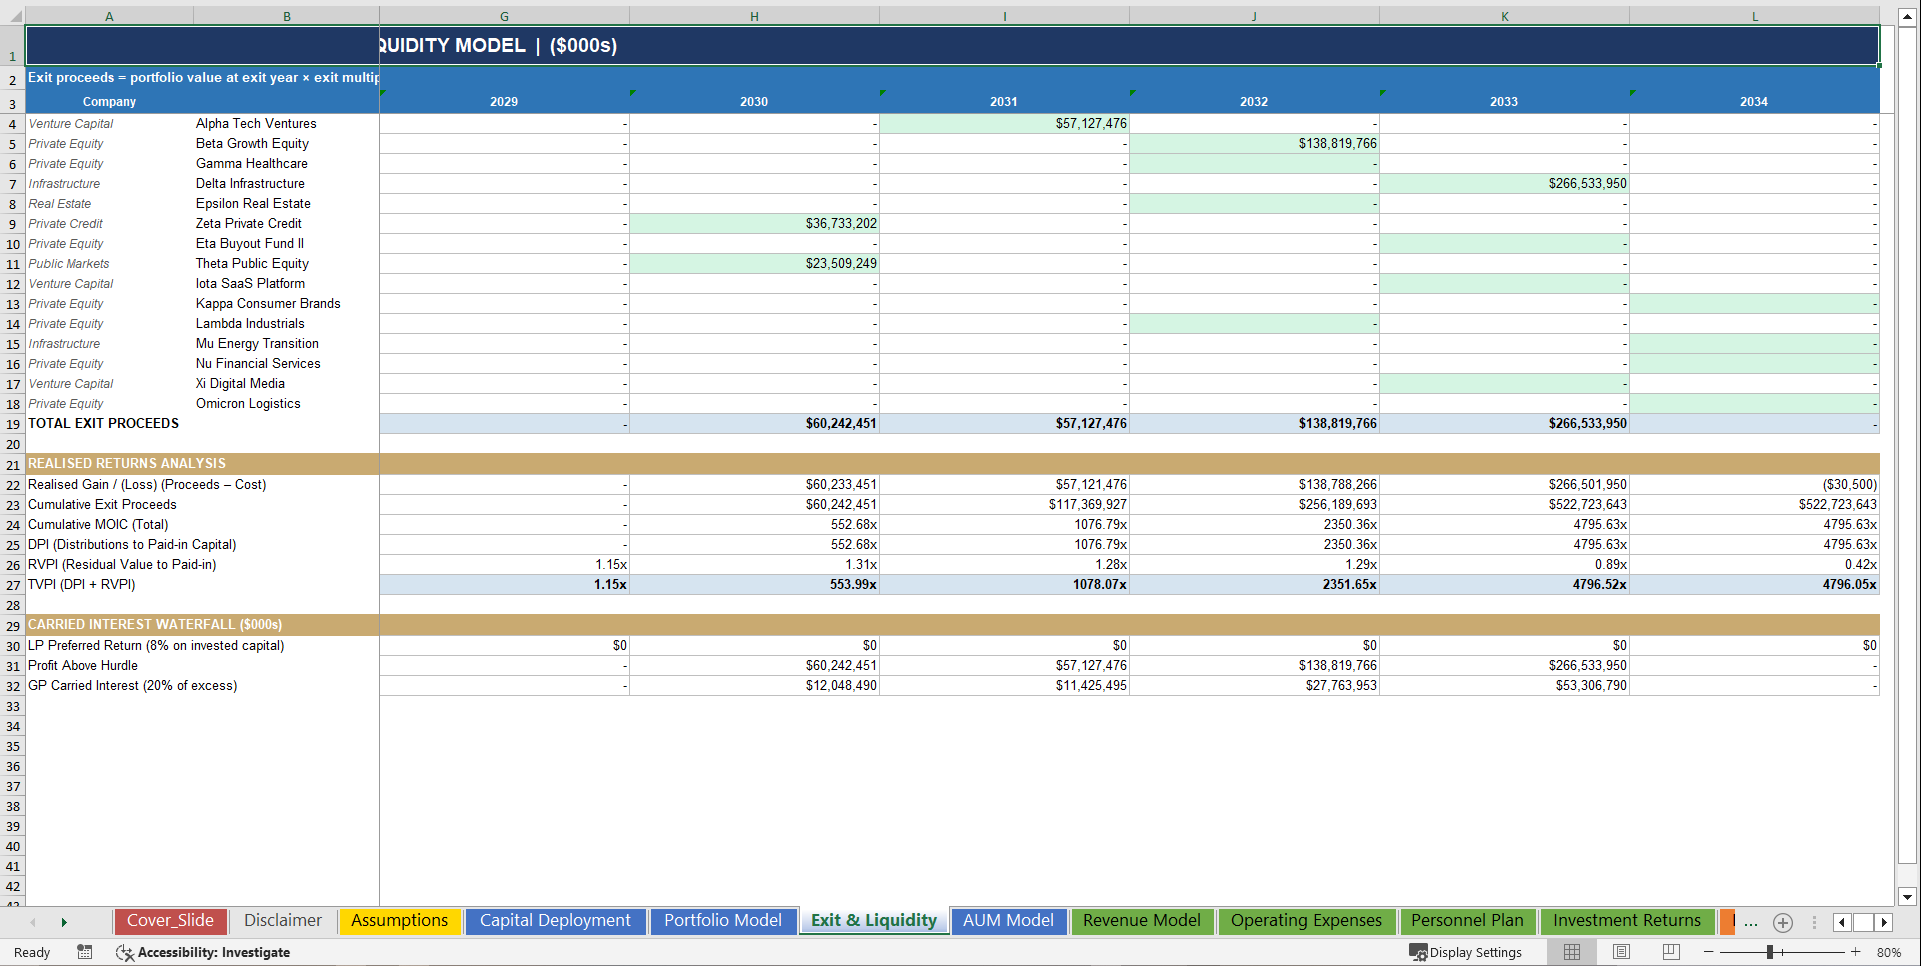
• 🏗️ Exit & Liquidity Model with Full Returns Waterfall – Per-company exit proceeds calculated as portfolio value × exit multiple, realised gains net of cost basis, cumulative exit proceeds, DPI (Distributions to Paid-In), RVPI (Residual Value to Paid-In), and TVPI (Total Value to Paid-In) – plus a full carried interest waterfall modeling LP preferred return, profit above hurdle, and GP carry – exit events highlighted automatically in green across the full timeline – the exact liquidity analysis any secondary market purchaser, co-investor, or institutional LP demands during their portfolio review
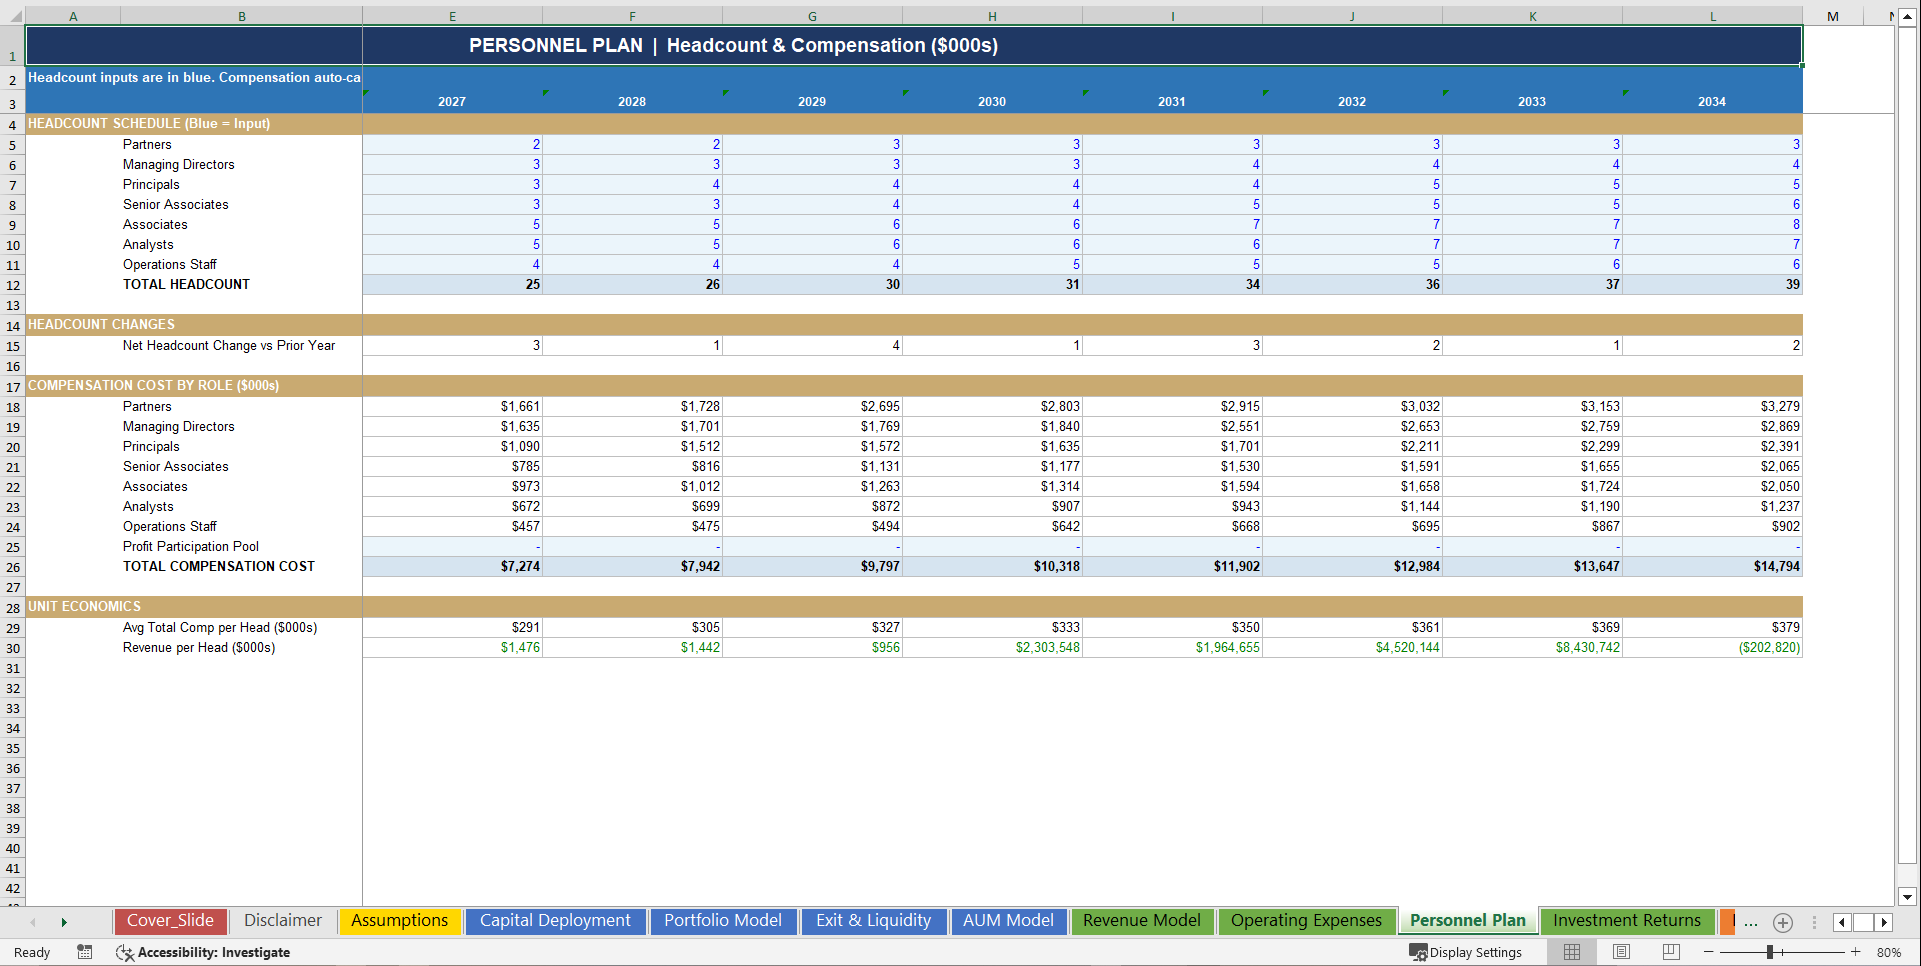
• 👥 Multi-Role Personnel Plan with Full Compensation Architecture – Partners, Managing Directors, Principals, Senior Associates, Associates, Analysts, and Operations Staff – each role with individual headcount inputs ramping annually, base salary, target bonus as % of salary, benefits load, and annual merit increases compounding throughout the forecast – plus a Profit Participation Pool allocated as a % of net income to the investment team – total compensation, headcount trajectory, average comp per head, and revenue per headcount tracked across all years – the exact people economics every talent-intensive investment firm needs to underwrite its cost base with precision
• 🏢 Operating Expense Engine with Granular G&A Line Items – Office Rent & Facilities, Legal & Regulatory Compliance, Audit & Tax Advisory, Travel & Entertainment, Technology & Data Platforms, Insurance & Risk Cover, Marketing & Investor Relations, and Other G&A – each inflating at the configurable annual rate – plus D&A and CapEx modeled separately – Total Cash OpEx and Total OpEx including D&A tracked with full cost ratio analysis: G&A as % of total OpEx, personnel as % of total OpEx, and cost per headcount – every overhead dollar visible, defensible, and auditable
• 🏦 Debt Capital Structure with Full Roll-Forward – Revolving credit facility modeled with opening balance, scheduled amortization, and drawdown capacity – interest calculated on average of beginning and ending balance – ending debt balance, average balance, interest expense, and Interest Coverage Ratio tracked annually – plus net debt and leverage ratio as % of AUM – the exact liability management structure any fund-level lender or NAV financing provider needs to evaluate your balance sheet risk
• 📦 Working Capital Architecture with Multiple Balance Sheet Drivers – Trade & Fee Receivables sized against configurable AR days, Short-Term Investments representing a portion of dry powder in liquid instruments, Prepayments & Other Current Assets, Deferred Revenue, Income Tax Payable, and Accrued Expenses – Net Working Capital movement flowing directly into the Cash Flow Statement – every balance sheet line traceable to its operational driver
📤 Outputs
• 📈 10-Year Fully Integrated 3-Statement Financial Model – Income Statement, Balance Sheet, and Cash Flow Statement fully cross-linked and auto-balancing across all years – AUM growing steadily on realistic assumptions, portfolio value compounding annually, management fee revenue scaling with AUM, EBITDA margin healthy and expanding, and Free Cash Flow positive from Year 1 – every number traceable to its operational and portfolio driver – the financial backbone any fund manager needs to present to an LP advisory board, debt provider, or institutional auditor with complete confidence
• 🎯 Multi-Company Portfolio Dashboard with Asset Class Diversification – Individual mark-to-market valuations for all portfolio companies across multiple asset classes – Total Portfolio Value rolling forward annually – unrealised gains, dividend income, monitoring fee income, write-down provisions, and Net Portfolio Value calculated every year – asset class breakdown for Private Equity, Venture Capital, Infrastructure, Real Estate, Private Credit, and Public Markets – the exact investment portfolio transparency any LP quarterly report, fund administrator, or secondary buyer needs to evaluate your book with confidence
• 🔁 AUM Bridge with Full Roll-Forward Mechanics – Beginning AUM, new LP capital raised, portfolio appreciation, exit distributions, and Ending AUM – AUM growth in dollars and percentage year-over-year – Portfolio / AUM ratio and dry powder percentage – management fee revenue auto-calculated as a configurable percentage of ending AUM – the exact AUM intelligence any placement agent, LP, or strategic acquirer of fund management businesses needs to understand your fee base trajectory
• 💼 Multi-Stream Revenue Waterfall – From management fees and monitoring income through deal fees, advisory fees, dividends, interest, realised gains, unrealised MTM appreciation, and carried interest – Total Fee Income and Total Investment Income tracked as separate blocks – YoY revenue growth rate, fee income concentration %, and management fee as % of AUM calculated annually – the full revenue architecture any institutional investor, credit committee, or fund buyer interrogates on page one of commercial due diligence
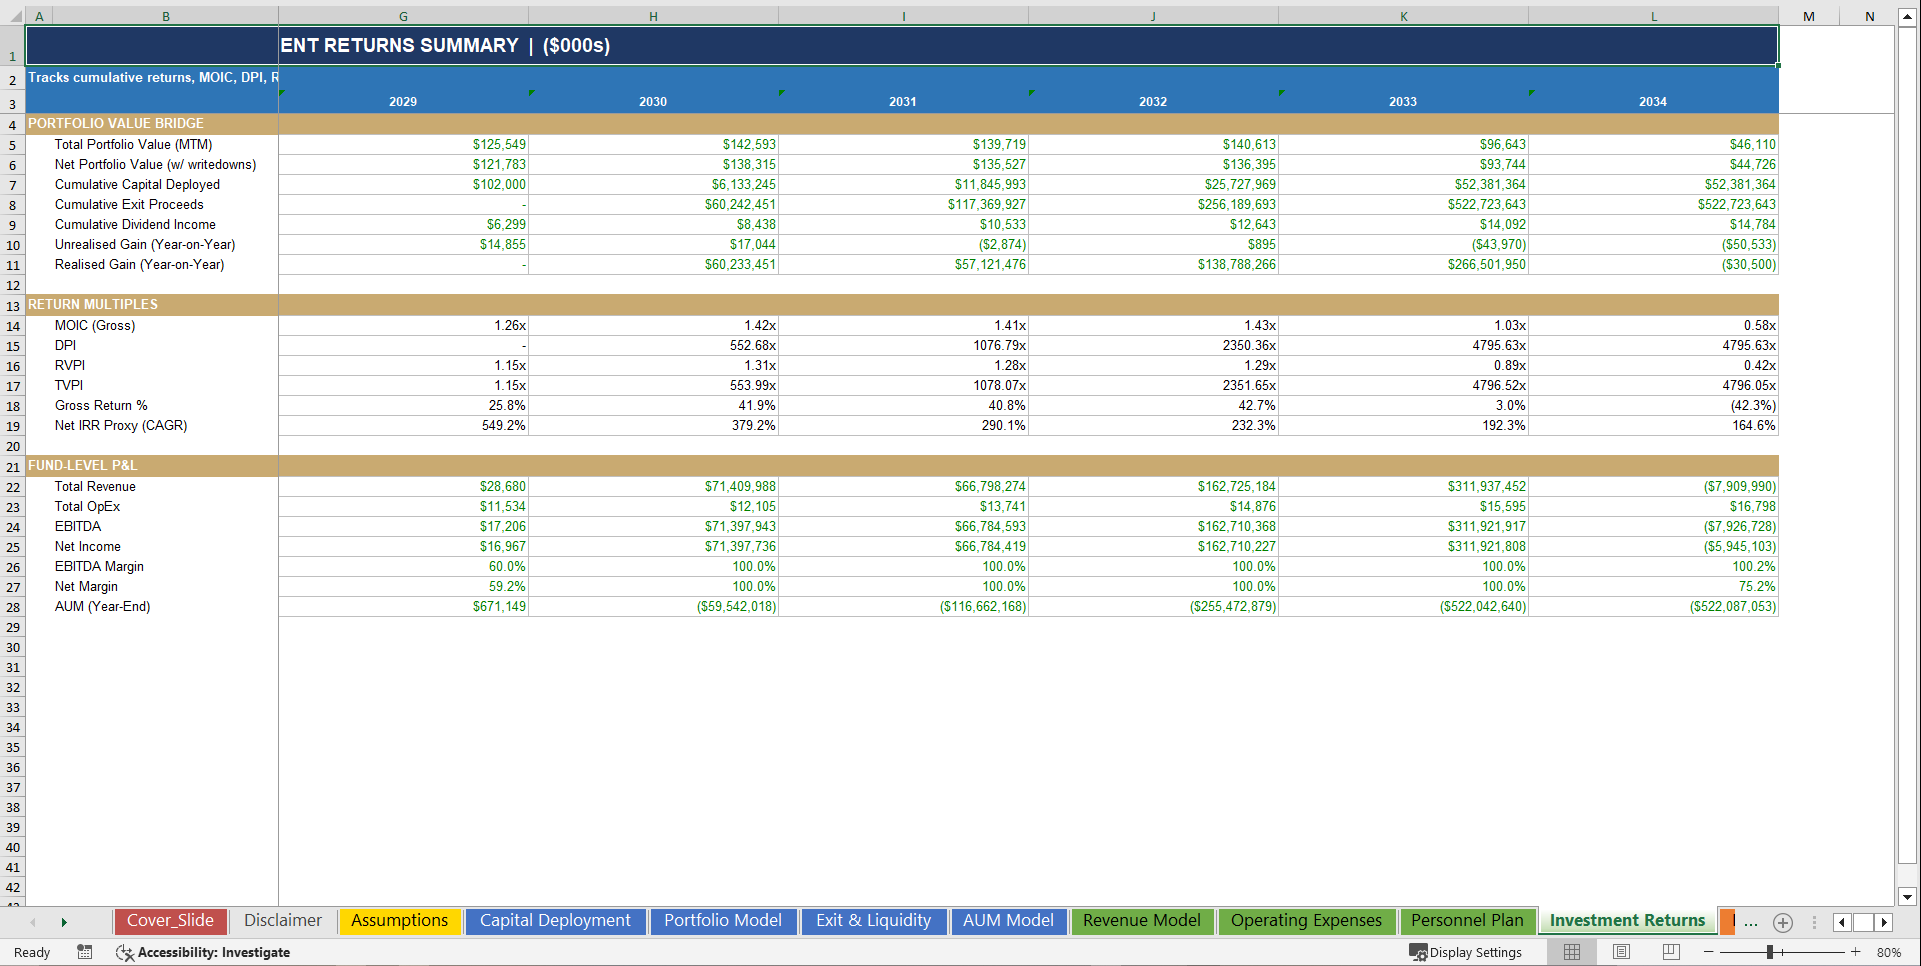
• 🏆 Fund Returns Intelligence – MOIC (Gross), DPI, RVPI, TVPI, Gross Return %, and Net IRR Proxy (CAGR) calculated for every year of the forecast – Cumulative capital deployed vs. cumulative exit proceeds vs. residual portfolio value – a complete return performance picture any LP advisory board, secondary market buyer, or carried interest recipient needs to evaluate fund performance with institutional rigour
• 📐 Full Carried Interest Waterfall – LP preferred return on invested capital, profit above hurdle, and GP carry crystallized year by year – the exact economics any fund manager needs to model their personal upside, any LP needs to validate their return priority, and any fund auditor needs to confirm waterfall compliance
• 🧮 Income Statement with Full Margin Analysis – From management fees through carried interest, compensation, G&A, D&A, interest expense, and tax – EBITDA, EBIT, Pre-Tax Income, and Net Income with full margin percentages – EBITDA Margin, EBIT Margin, Net Margin, and Effective Tax Rate calculated annually – plus Revenue per Headcount, OpEx as % Revenue, Personnel Cost as % Revenue, and MOIC tracked as supplementary metrics – the complete P&L transparency any PE sponsor, credit committee, or LP advisory board demands from a fund management company
• 📊 Balance Sheet with Full Line-Item Detail and Auto-Balancing Check – Cash & Cash Equivalents tied to the Cash Flow Statement, Trade Receivables, Short-Term Investments, Prepayments, Portfolio Investments (Net), Long-Term Co-Investments, Fixed Assets, Intangibles, Accounts Payable, Accrued Expenses, Income Tax Payable, Deferred Revenue, Long-Term Debt, Deferred Tax, Paid-In Capital, Retained Earnings, and Partner Capital Accounts – Assets = Liabilities + Equity confirmed for every year with a highlighted balance check row – the audit-ready balance sheet any fund administrator, institutional auditor, or debt provider needs to see
• 🔄 Cash Flow Statement – Full Indirect Method – Net Income, D&A add-back, multiple working capital adjustment lines including deferred revenue change and minimum cash floor mechanism, new portfolio investments, exit proceeds, CapEx, LP capital contributions, debt repayment, and partner distributions – Operating Cash Flow, Investing Cash Flow, Financing Cash Flow, Net Change in Cash, and Ending Cash Balance tied directly to the Balance Sheet – Free Cash Flow tracked annually – the complete cash mechanics any fund-level lender, NAV finance provider, or institutional LP needs to validate your liquidity management
• 🎨 Executive Dashboard with Live Charts and KPI Summary Table – AUM Growth line chart, Portfolio Value line chart, Annual Revenue bar chart, Net Income line chart, Capital Deployed bar chart, and Total Headcount bar chart – plus live KPI tiles covering AUM, Portfolio Value, Capital Deployed, Revenue, Net Income, and TVPI – and a full multi-year KPI summary table with AUM, Portfolio Value, Revenue, EBITDA, Net Income, EBITDA Margin %, Net Margin %, Headcount, and TVPI for every year – all auto-updating the instant any assumption changes
• 📊 Multi-Table Sensitivity & Scenario Engine – MOIC sensitivity matrix across Exit Multiple × Portfolio Growth Rate with colour-coded green/amber/red heat map – Management Fee Revenue matrix across AUM × Fee Rate – Compensation sensitivity across Partner Count × Base Salary – plus a full scenario comparison table across Base Case, Low Return, and High Return covering multiple KPIs including AUM, MOIC, Net Income, EBITDA Margin, DPI, TVPI, and Carry Earned – instant scenario data points giving you complete risk visibility without touching a single formula
🏆 Why This Model Stands Out
✅ Fully integrated across all tabs – change one assumption and formulas update instantly across every sheet – AUM flows to management fees, which flow to revenue, which flows to EBITDA, which flows to retained earnings, which balances the equity stack
✅ LP and institutional investor-ready – structured and formatted to answer the exact questions institutional LPs, fund-of-funds buyers, NAV lenders, and secondary market purchasers ask on day one: What is the stabilised management fee EBITDA? What does the AUM trajectory look like over the forecast horizon? When does carried interest crystallize? What is the GP's personal economics at the target MOIC? What does the waterfall look like under a stress scenario?
✅ Private investment firm industry-realistic – built around how investment firms actually generate and protect economics: management fees scaling with AUM maturity, carry requiring patient capital and disciplined exit timing, working capital building as receivables grow with AUM, monitoring fees compounding as portfolio breadth expands, personnel costs scaling with AUM complexity – not generic financial services assumptions with a PE label applied
✅ Institutional color-coding throughout – blue inputs, black formulas, green cross-sheet links – Financial Modeling World Cup color conventions used throughout so any LP, fund auditor, debt provider, co-investor, or M&A advisor can open it and immediately understand the logic, trace every number to its source, and audit every formula without a guide
✅ Fully unlocked – no protected sheets, no black-box formulas, no hidden logic – every assumption visible, every formula auditable – present it to any institutional LP, fund administrator, credit committee, secondary market buyer, or strategic acquirer with complete confidence
📋 Model Structure
• Dashboard – Live charts plus KPI tiles plus multi-year summary table covering all key AUM, portfolio, revenue, margin, and headcount metrics – auto-updating from a single Assumptions tab
• Assumptions – A comprehensive set of individually configurable drivers covering fund structure, AUM targets, portfolio growth rates, fee rates, exit multiples, holding periods, personnel salaries, G&A costs, debt terms, tax rate, and scenario toggles – all blue-coded for instant editing – the single source of truth for the entire model
• Capital Deployment – LP capital raising schedule, GP co-investment, total new capital, new investments made, exit proceeds, reinvestment, cumulative deployment, dry powder, and deployment rate – the capital allocation engine feeding AUM, portfolio, and cash flow
• Portfolio Model – Multi-company mark-to-market portfolio across multiple asset classes with entry/exit mechanics, unrealised gains, dividend income, monitoring fees, write-down provisions, net portfolio value, and full asset class diversification breakdown
• Exit & Liquidity – Per-company exit proceeds, realised gains, cumulative exits, DPI, RVPI, TVPI, and full carried interest waterfall with LP preferred return, above-hurdle profit, and GP carry crystallization
• AUM Model – Full AUM bridge from Beginning AUM through new capital, appreciation, exits to Ending AUM – AUM growth metrics, portfolio/AUM ratio, dry powder %, and management fee revenue
• Revenue Model – Multi-line revenue waterfall from management fees through monitoring fees, deal fees, advisory fees, dividends, interest income, realised gains, unrealised MTM, and carry – total fee income, total investment income, and total revenue – with YoY growth rate and concentration metrics
• Personnel Plan – Multiple investment roles with individual headcount ramp, salary, bonus, benefits, and annual merit increases – total compensation, headcount trajectory, average comp per head, and revenue per headcount across all years
• Operating Expenses – Multiple G&A line items inflating annually plus D&A, CapEx, and personnel costs linked from the Personnel Plan – total cash OpEx, total OpEx including D&A, and cost ratio metrics
• Investment Returns – Portfolio value bridge, MOIC (Gross), DPI, RVPI, TVPI, Gross Return %, Net IRR Proxy, and full fund-level P&L summary linked from the Income Statement
• Debt Schedule – Revolving credit facility roll-forward with beginning balance, repayments, ending balance, average balance, interest expense, Interest Coverage Ratio, net debt, and leverage ratio
• Income Statement – Comprehensive P&L from total revenue through compensation, G&A, D&A, interest, tax, and net income – EBITDA, EBIT, Pre-Tax, Net Income with full margin suite and supplementary metrics
• Balance Sheet – Full asset, liability, and equity stack with auto-balancing check – Cash tied to Cash Flow Statement, Portfolio Investments tied to Portfolio Model, Debt tied to Debt Schedule, Retained Earnings tied to cumulative Net Income – Assets = Liabilities + Equity confirmed for every year
• Cash Flow Statement – Full indirect method with multiple movement lines – operating, investing, and financing sections with OCF, net investing cash flow, net financing cash flow, net change in cash, and Ending Cash Balance tied to the Balance Sheet
• Sensitivity Analysis – MOIC heat map across Exit Multiple × Growth Rate, Management Fee matrix across AUM × Fee Rate, Compensation table across Partner Count × Salary, and full scenario comparison across multiple KPIs – instant scenario data points colour-coded for at-a-glance risk intelligence
Key Words:
Strategy & Transformation, Growth Strategy, Strategic Planning, Strategy Frameworks, Innovation Management, Pricing Strategy, Core Competencies, Strategy Development, Business Transformation, Marketing Plan Development, Product Strategy, Breakout Strategy, Competitive Advantage, Mission, Vision, Values, Strategy Deployment & Execution, Innovation, Vision Statement, Core Competencies Analysis, Corporate Strategy, Product Launch Strategy, BMI, Blue Ocean Strategy, Breakthrough Strategy, Business Model Innovation, Business Strategy Example, Corporate Transformation, Critical Success Factors, Customer Segmentation, Customer Value Proposition, Distinctive Capabilities, Enterprise Performance Management, KPI, Key Performance Indicators, Market Analysis, Market Entry Example, Market Entry Plan, Market Intelligence, Market Research, Market Segmentation, Market Sizing, Marketing, Michael Porter's Value Chain, Organizational Transformation, Performance Management, Performance Measurement, Platform Strategy, Product Go-to-Market Strategy, Reorganization, Restructuring, SWOT, SWOT Analysis, Service 4.0, Service Strategy, Service Transformation, Strategic Analysis, Strategic Plan Example, Strategy Deployment, Strategy Execution, Strategy Frameworks Compilation, Strategy Methodologies, Strategy Report Example, Value Chain, Value Chain Analysis, Value Innovation, Value Proposition, Vision Statement, Corporate Strategy, Business Development, Business plan pdf, business plan, PDF, Business Plan DOC, Business Plan Template, PPT, Market strategy playbook, strategic market planning, competitive analysis tools, market segmentation frameworks, growth strategy templates, product positioning strategy, market execution toolkit, strategic alignment playbook, KPI and OKR frameworks, business growth strategy guide, cross-functional strategy templates, market risk management, market strategy PowerPoint doc, guide, ebook, e-book ,McKinsey Change Playbook, Organizational change management toolkit, Change management frameworks 2025, Influence model for change, Change leadership strategies, Behavioral change in organizations, Change management PowerPoint templates, Transformational leadership in change, supply chain KPIs, supply chain KPI toolkit, supply chain PowerPoint template, logistics KPIs, procurement KPIs, inventory management KPIs, supply chain performance metrics, manufacturing KPIs, supply chain dashboard, supply chain strategy KPIs, reverse logistics KPIs, sustainability KPIs in supply chain, financial supply chain KPIs, warehouse KPIs, digital supply chain KPIs, 1200 KPIs, supply chain scorecard, KPI examples, supply chain templates, Corporate Finance SOPs, Finance SOP Excel Template, CFO Toolkit, Finance Department Procedures, Financial Planning SOPs, Treasury SOPs, Accounts Payable SOPs, Accounts Receivable SOPs, General Ledger SOPs, Accounting Policies Template, Internal Controls SOPs, Finance Process Standardization, Finance Operating Procedures, Finance Department Excel Template, FP&A Process Documentation, Corporate Finance Template, Finance SOP Toolkit, CFO Process Templates, Accounting SOP Package, Tax Compliance SOPs, Financial Risk Management Procedures.
NOTE: Our digital products are sold on an "as is" basis, making returns and refunds unavailable post-download. Please preview and inquire before purchasing. Please contact us before purchasing if you have any questions! This policy aligns with the standard Flevy Terms of Usage.
Got a question about the product? Email us at support@flevy.com or ask the author directly by using the "Ask the Author a Question" form. If you cannot view the preview above this document description, go here to view the large preview instead.
Source: Best Practices in Private Equity, Integrated Financial Model Excel: Private Investment Firm 10-Year 3 Statement Financial Model Excel (XLSX) Spreadsheet, SB Consulting
ABOUT THE AUTHOR
SB Consulting is dedicated to empowering businesses to communicate their ideas with impact. This consulting firm specializes in teaching organizations how to create effective corporate and management presentations. With training from top-tier global consulting firms, including McKinsey, BCG, and Porsche Consulting, extensive expertise in presentation design and ... [read more]
Ask the Author a Question
You must be logged in to contact the author.
