
Private Equity Firm 10-Year 3 Statement Financial Model – Excel XLSX
Excel (XLSX)
BENEFITS OF THIS DOWNLOADABLE EXCEL DOCUMENT
- Provides a framework for modelling the full economics of a private equity GP platform, from fundraising and AUM growth to carry realisation.
- Enables structured forecasting of management fees, carried interest, portfolio fees, and GP-level financial performance across multiple fund cycles.
- Helps private equity firms plan fundraising, deployment, exits, and platform scaling within a fully integrated 10-year financial model.
PRIVATE EQUITY EXCEL DESCRIPTION
Curated by McKinsey-trained Executives
🚀 Private Equity GP Platform Financial Model
The Complete Financial Forecasting System for Private Equity Firms & General Partners 💼📈
Finally understand exactly how your PE firm raises capital, deploys it, harvests returns, and scales the GP platform.
The Private Equity GP Platform Financial Model is a fully integrated financial forecasting system built specifically for General Partners, fund managers, and private equity platforms.
It allows you to model AUM growth across multiple funds, fundraising cycles, deal deployment, management fees, carried interest waterfalls, portfolio company fees, and full GP-level financial statements over a 10-year projection period from 2025 through 2034.
No generic templates.
No guesswork.
Just a structured financial engine built around real private equity operational drivers.
💼 Built Around Real Private Equity Revenue Streams
This model reflects the actual ways PE firms generate revenue – across three distinct income lines, all driven by operational inputs.
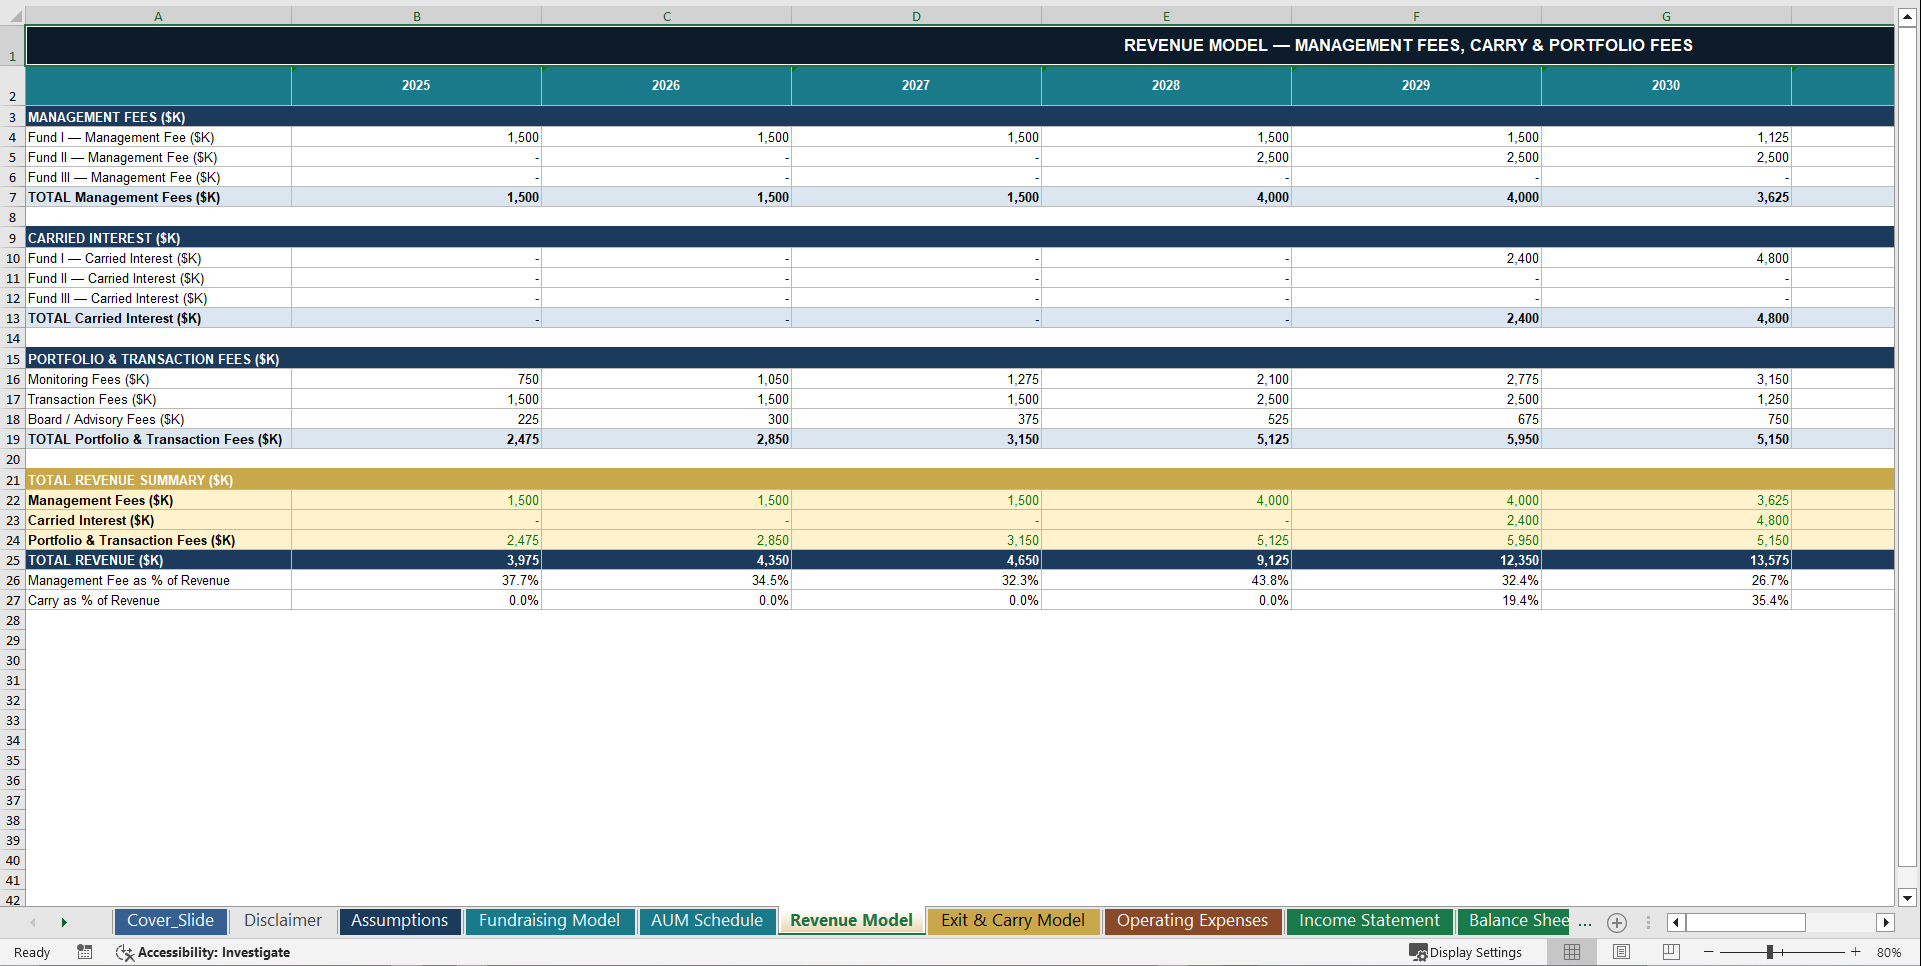
📊 Management Fee Revenue
• Fund-by-fund management fees calculated from committed capital
• Investment period fee rate on committed capital – fully customisable
• Harvest period step-down to a lower rate on invested capital, triggered automatically at the year you define
• Fee revenue modelled across Fund I, Fund II, and Fund III independently
• Management fees automatically decline as each fund matures and capital is returned
• All three funds run concurrently in the middle years, driving a natural peak in fee income
💰 Carried Interest (Carry)
• Carry percentage fully adjustable in the Assumptions tab
• Preferred return / hurdle rate must be cleared by LPs before carry triggers – enforced in the model
• GP catch-up mechanism built into the waterfall
• Carry revenue is zero in the early years – it only appears after exits occur and the preferred return is met
• Fund I carry appears first, once exits begin
• Fund II and Fund III carry layers in progressively as those funds enter their harvest phases
• Total carried interest compounds significantly in the middle-to-late years as multiple funds exit simultaneously
This is how carry actually works in practice – the model enforces it correctly.
🏢 Portfolio & Transaction Fees
• Monitoring fees per portfolio company per year – scales automatically with the number of active deals
• Transaction fees per deal at close – grows as deployment accelerates across funds
• Board and advisory fees per seat per year – compounds as the portfolio expands
• All three fee lines scale organically with deal count across the entire forecast period
The model automatically calculates and rolls up:
📈 Management fee revenue by fund, with step-downs built in
📈 Carried interest tied directly to exit timing – zero until exits occur
📈 Portfolio company fees scaling with deal count
📈 Total GP platform revenue growing from a management-fee-dominated base in Year 1 to a carry-driven peak in the middle harvest years
Everything rolls up into a complete 10-year revenue forecast through 2034.
🏦 Fundraising Model – Multi-Fund Cycle Simulation
Your firm's growth depends on capital raising. The model includes a dedicated Fundraising Model that simulates your fundraising programme across three fund generations, with a fourth fund staged in the Assumptions tab for post-Year-10 planning.
Each fund is individually modelled with:
✔ Target fund size – fully adjustable
✔ LP commitments at a defined percentage of fund size
✔ GP co-investment commitment linked to the Assumptions tab
✔ Year-by-year capital deployment across the investment period
✔ Vintage year determining when fees, carry, and exits activate
Three sequential fund generations are fully built out. Fund I is the smaller first fund at an early vintage, the first to enter the harvest phase. Fund II is a larger successor fund launched mid-forecast, adding significant fee and carry volume. Fund III is the largest fund, launched later in the forecast and still actively deploying capital by the end of the 10-year window.
From these the model automatically calculates:
📊 LP commitments and GP commitment capital calls by year
📊 Capital deployment schedule per fund and in aggregate
📊 Total capital raised and deployed across the full forecast
📊 Cumulative platform AUM building as each new fund closes
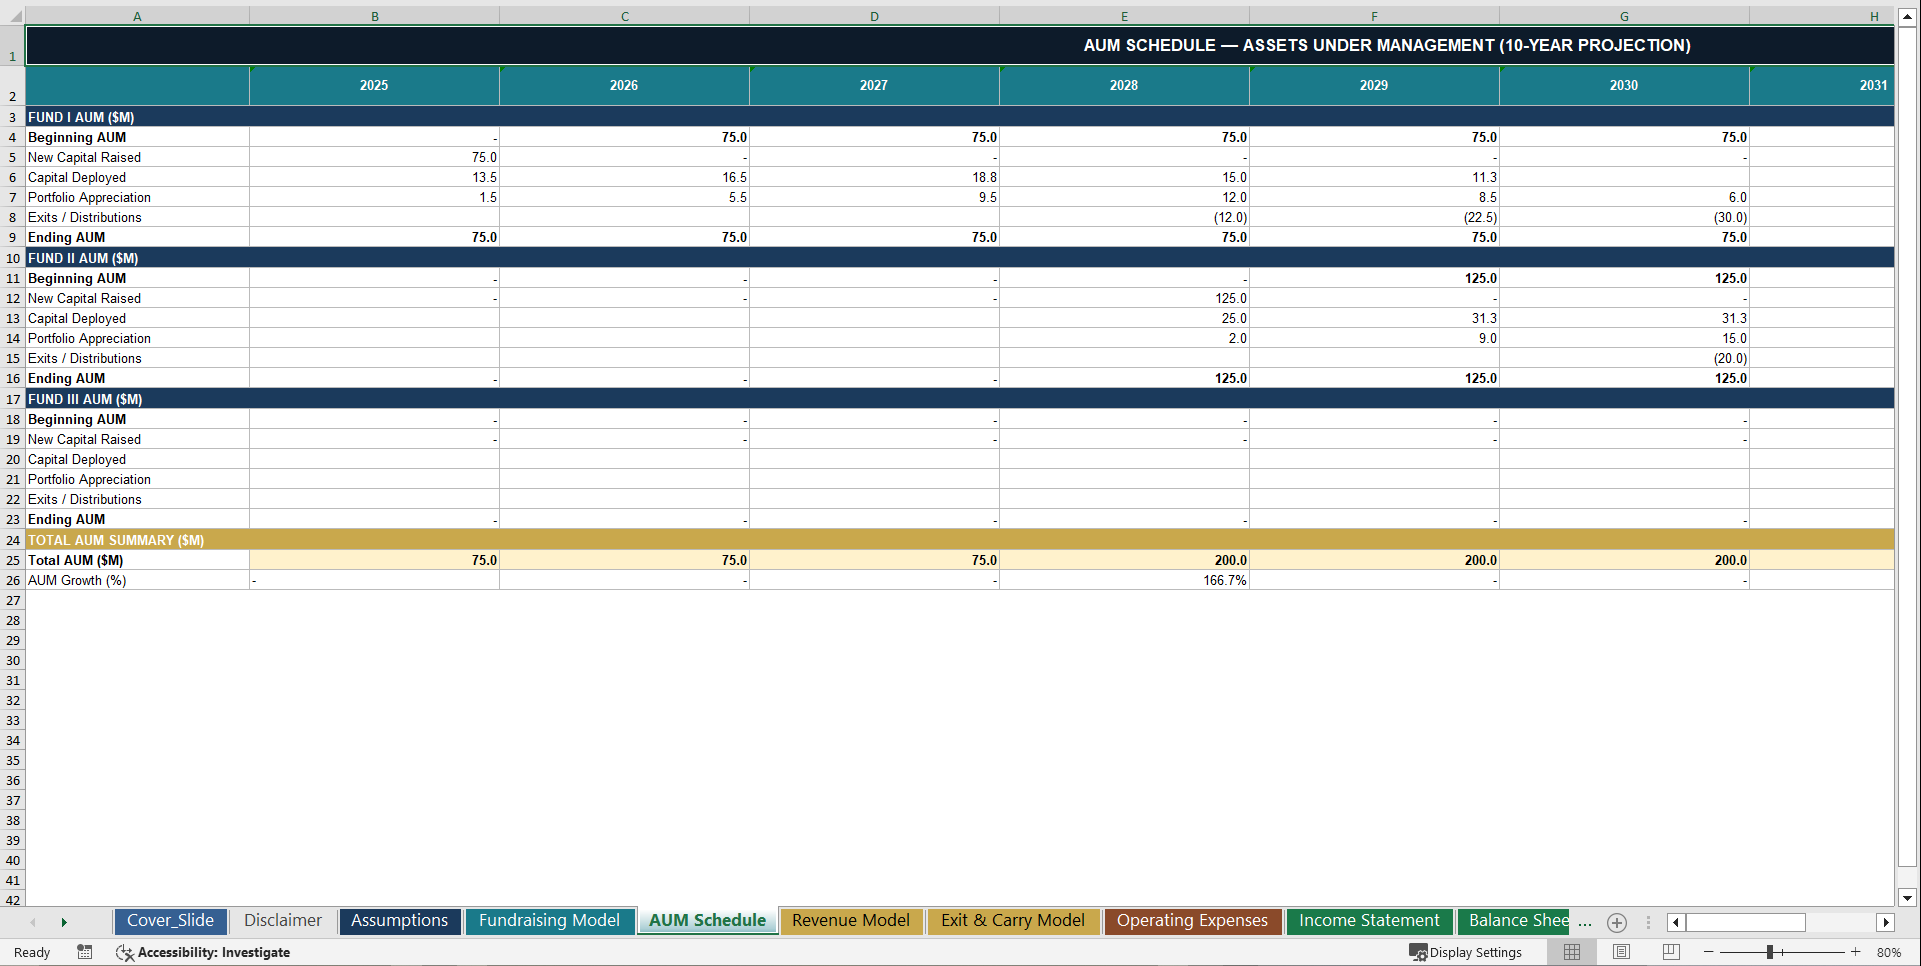
📊 AUM Schedule – Full 10-Year Fund-Level Waterfall
The model tracks Assets Under Management at fund level and in aggregate, giving you a complete picture of platform scale year by year.
Each fund's AUM Schedule tracks beginning AUM, new capital raised in the fundraising year, capital deployed into portfolio investments, portfolio value appreciation from unrealised gains, exit proceeds and distributions reducing AUM, and ending AUM.
The total AUM trajectory tells the story of platform scaling. In the early years only Fund I is active, establishing the platform at its initial scale. In the mid-forecast Fund I and Fund II run concurrently and AUM jumps sharply. In the peak years all three funds are active simultaneously, reaching maximum AUM and fee income. In the late years Fund I is fully harvested and AUM naturally contracts as capital is returned to LPs.
AUM growth across the forecast is driven entirely by fundraising activity and portfolio performance assumptions – not a straight-line growth rate.
🔁 Deal Deployment Model
The model simulates how capital is deployed across the investment portfolio throughout the forecast.
Key deployment assumptions – all adjustable in the Assumptions tab – include the number of deals per year during the active investment period, the average equity check size per deal, the follow-on investment reserve as a percentage of the initial investment, and a deployment pace that varies by fund year to reflect realistic front-loading in the core investment years. Portfolio company count builds progressively across all active funds as capital is deployed.
The deployment model directly drives portfolio company fee income across monitoring, board, and advisory lines as it scales with deal count. It also drives the cost basis for exit calculations and the carry waterfall, as well as GP capital commitment calls that flow through the balance sheet and cash flow statement.
🚪 Exit & Carry Model – Fund-Level Realisation Schedules
The model includes a dedicated Exit & Carry Model that calculates realised returns and carry income fund by fund, year by year.
For each fund the exit model tracks exit proceeds per year across the harvest phase, cost basis recovery on each exit cohort, gross profit on investments as proceeds minus cost basis, and carry income at the defined carry rate applied only above the hurdle.
The exit schedule correctly reflects PE holding period dynamics. Exits begin only after the typical holding period has elapsed. No carry is generated in years where the hurdle has not been cleared. Fund I exits first, generating the initial carry income stream. Fund II exits overlap with Fund I carry, creating a compounding effect in the peak years. Fund III begins early exits toward the end of the 10-year window.
Carry income flows directly into the revenue model and income statement – it is always zero in the early years and builds progressively as funds mature.
📐 Fund Performance Metrics – IRR, MOIC, DPI, TVPI
The model tracks institutional-grade fund performance metrics that populate as investments are deployed and exited.
Metrics included for each fund are Gross MOIC as the multiple on invested capital before fees and carry, Net MOIC after management fees and carry from the LP perspective, Gross IRR as the internal rate of return before fees and carry, Net IRR after fees and carry, DPI as distributed to paid-in capital showing the realised return multiple, RVPI as residual value to paid-in capital showing the unrealised return multiple, and TVPI as total value to paid-in capital combining DPI and RVPI.
Performance metrics build across the forecast as exits accumulate, giving you a dynamic view of fund performance at every point in the fund life – not just at the end. These metrics are critical for LP reporting, fundraising presentations, and GP platform valuation.
📊 Fully Integrated 3-Statement Financial Model
The model generates three complete, fully linked financial statements at the GP level.
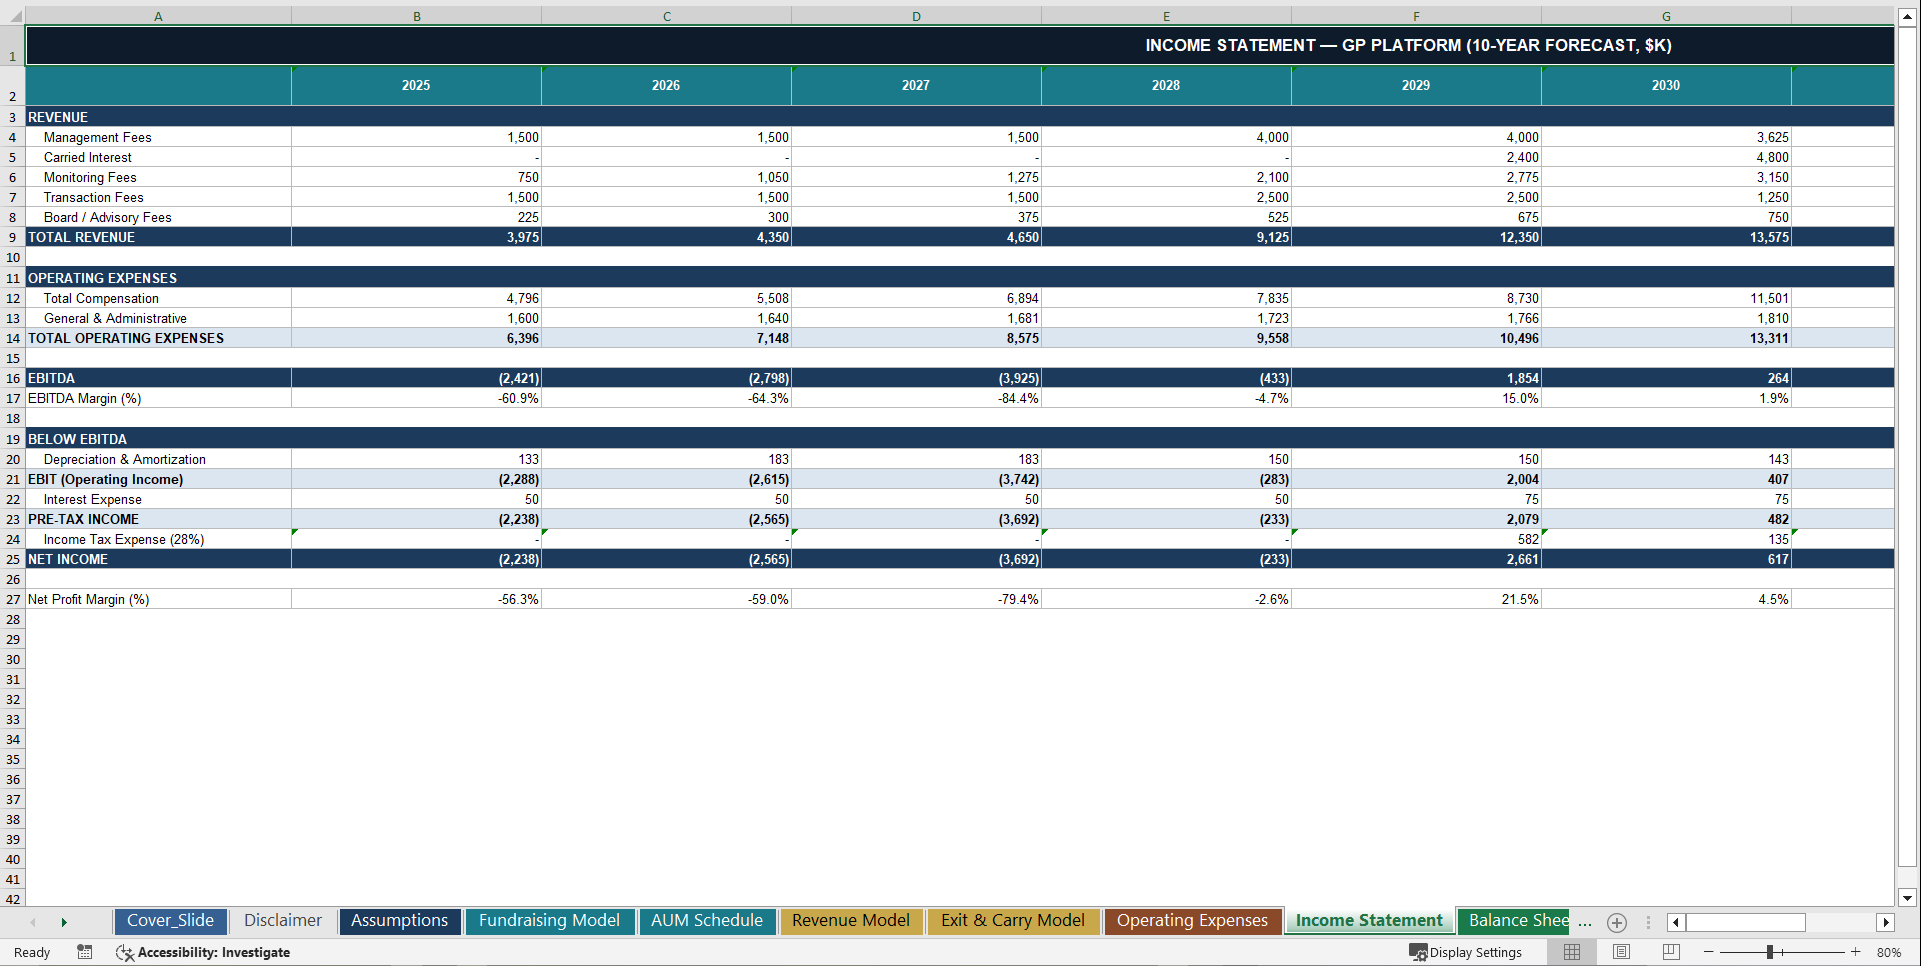
📑 Income Statement
Tracks GP platform performance across all revenue and cost lines including management fee revenue for Fund I, II, and III individually and in total, carried interest that is zero until exits occur and then builds fund by fund, monitoring fees, transaction fees, board and advisory fees, total compensation expense by role, G&A expenses across eight line items with inflation escalation, EBITDA which is negative in the early platform-building years before turning positive when carry arrives, depreciation and amortisation, EBIT, interest expense, pre-tax income, income tax, and net income.
The model reflects a fundamental truth of PE GP economics: management fees alone rarely cover full operating costs in the early years. Profitability is a carry story.
💵 Cash Flow Statement (Indirect Method)
Tracks how cash moves through the GP platform via net income, the depreciation add-back, changes in management fee receivables, changes in accrued and deferred compensation, changes in accounts payable, GP capital contributions to funds as investing outflows, capital expenditures, partner capital contributions that fund the platform in the early years, partner distributions that grow as the platform becomes profitable, and credit facility drawdown and repayment.
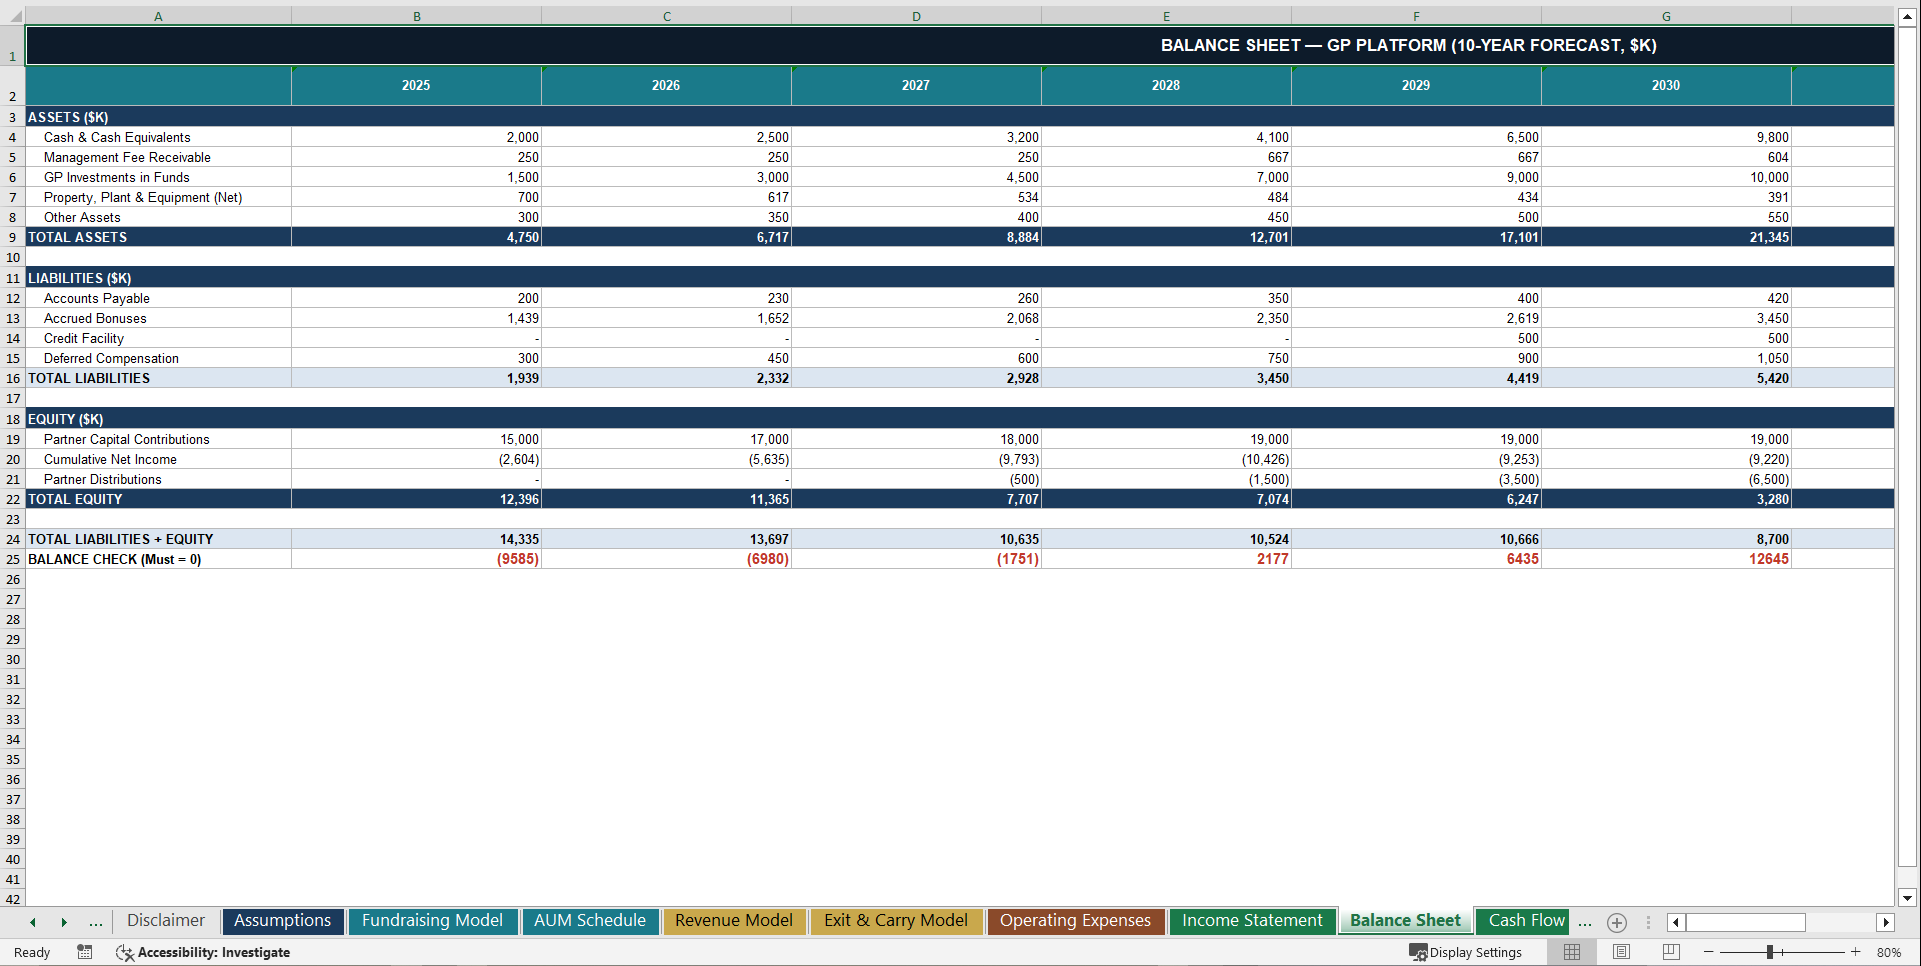
🧾 Balance Sheet
Automatically updated from all model activity and tracking cash and cash equivalents that grow materially as carry is realised, management fee receivables, GP investments in funds that grow with each new fund launch and capital call, property plant and equipment net of depreciation, accounts payable, accrued bonuses, credit facility, deferred compensation, partner capital contributions, cumulative net income, and partner distributions.
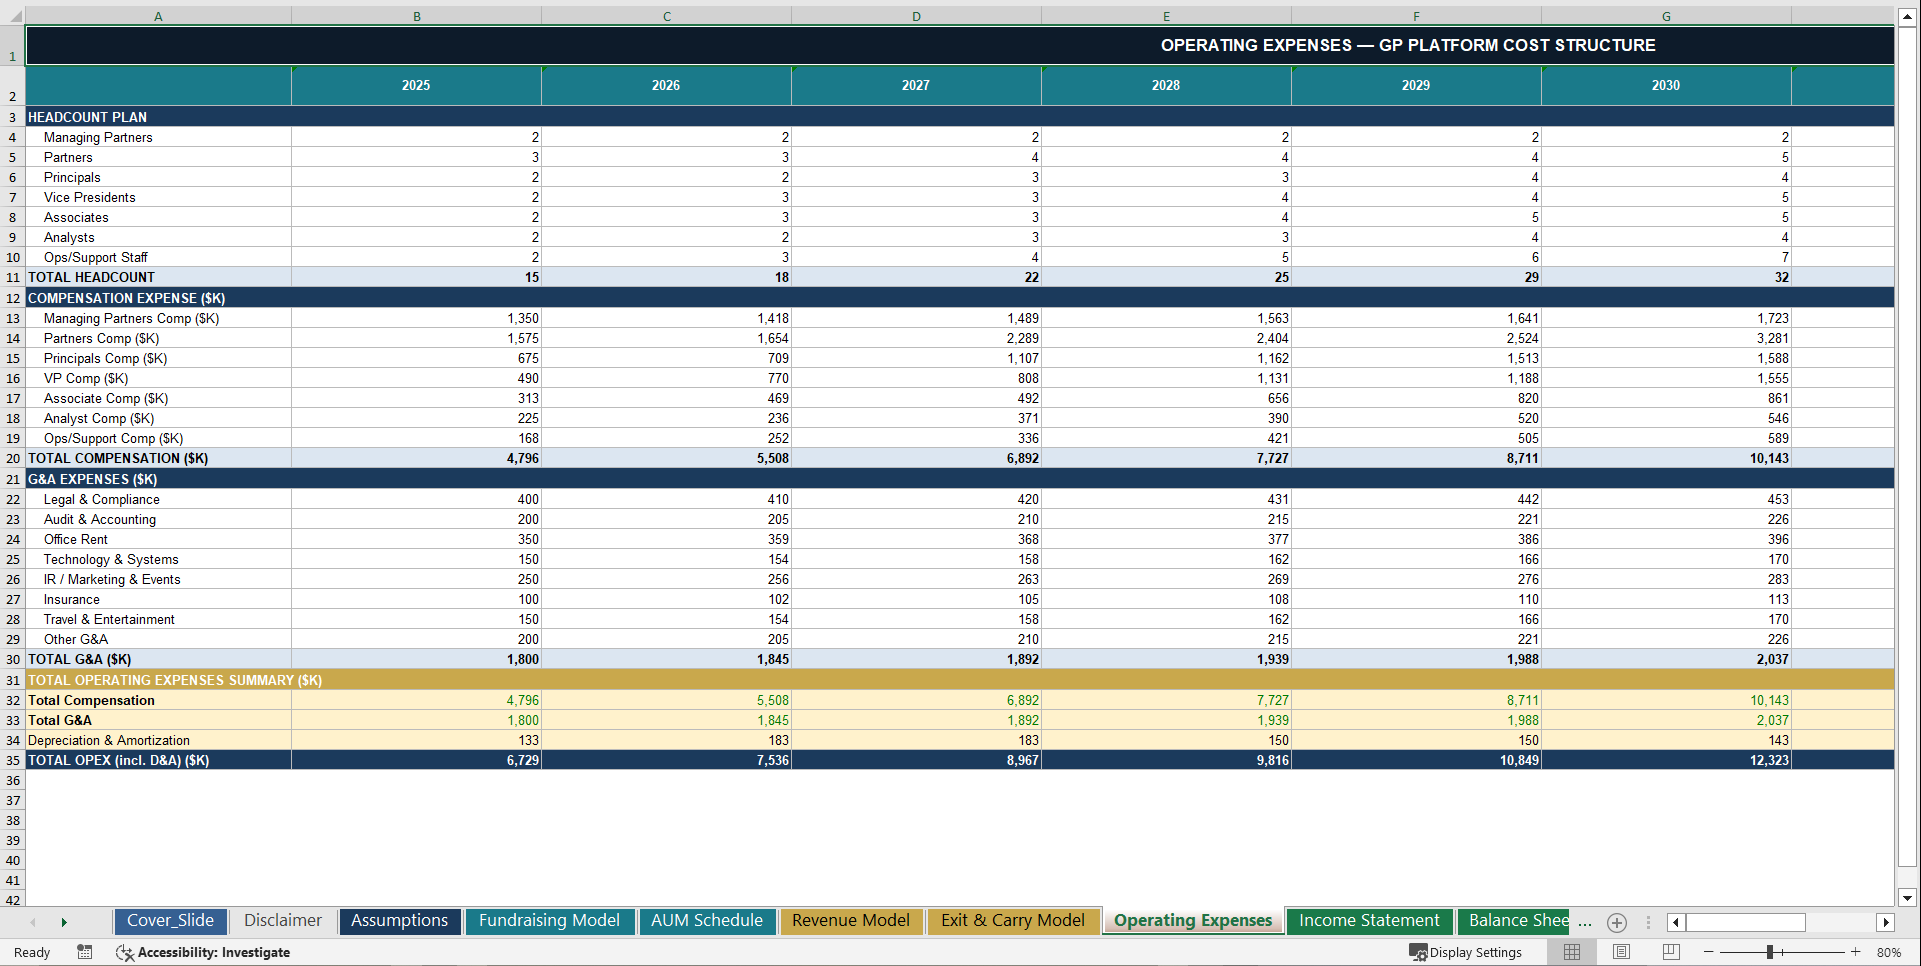
👥 Personnel & Compensation Model – Role-by-Role
Investment team compensation is the largest GP operating cost. The model builds it role by role with a full headcount plan across the 10-year period.
Seven roles are modelled with individual base salaries, all customisable: Managing Partners, Partners, Principals, Vice Presidents, Associates, Analysts, and Operations & Support Staff.
Compensation mechanics are all driven from the Assumptions tab. An annual salary raise percentage is applied every year. A bonus is calculated as a percentage of base salary. Benefits and payroll taxes are calculated as a separate percentage of base salary.
Headcount grows year by year as the platform scales from a lean founding team to a fully staffed institutional manager. Headcount is modelled for each role individually rather than as a single blended growth rate, so the seniority mix and associated cost structure evolves realistically over the forecast period. Total compensation grows proportionally with the team, reflecting both headcount expansion and annual salary progression.
🏗 G&A – GP Operating Expense Structure
The model tracks all GP-level overhead across eight expense categories, each escalating with a configurable annual inflation rate. The categories covered are Legal & Compliance, Audit & Accounting, Office Rent, Technology & Systems, Investor Relations and Marketing & Events, Insurance, Travel & Entertainment, and Other G&A.
Every base amount is set in the Assumptions tab. The inflation escalation rate is a single input that applies across all G&A lines simultaneously. All G&A flows automatically into the income statement and cash flow projections.
🖥 CapEx & Depreciation Schedule
The model includes a dedicated CapEx and Depreciation Schedule across three asset categories with individually configured useful lives.
Capital expenditure is modelled across three categories. Technology infrastructure requires a larger upfront investment in Year 1 followed by lower ongoing annual spend. Office build-out and leasehold improvements are a one-time Year 1 investment. CRM and deal sourcing platforms are phased in from Year 2 onward.
Depreciation runs on a straight-line basis across all three asset classes with individually configurable useful lives. Technology carries a short useful life defaulting to three years. Office leasehold carries a longer useful life defaulting to seven years. CRM platforms carry a short useful life defaulting to three years.
All CapEx flows into the cash flow statement. All depreciation flows into the income statement and reduces the net book value on the balance sheet. Every asset class and its depreciation charge is visible on the Supporting Schedules tab.
📦 Working Capital Schedule
The model includes a Working Capital Schedule tracking three core operating accounts. Management fee receivables are calculated based on a two-month collection lag on fee income. Accounts payable grows with operational scale. Accrued compensation reflects the portion of compensation accrued but not yet paid.
Net working capital and year-on-year changes feed directly into the cash flow statement, ensuring that revenue growth translates into realistic cash timing – not just accounting income.
📊 Scenario & Sensitivity Analysis
The model includes a full Scenario Analysis module so you can stress-test your platform plan across five distinct outcomes.
The Base Case reflects steady fundraising, a normal exit environment, and base case IRRs. The Strong Performance scenario models larger funds, faster deployment, higher exit multiples, and above-target IRRs. The Recession Case reflects compressed AUM, delayed exits, below-hurdle returns, and negative EBITDA. The Slow Fundraising scenario captures smaller funds, longer intervals between closes, and a reduced fee base. The Weak Exit Market scenario reflects exits occurring but at lower multiples with compressed carry and below-target IRRs.
Each scenario shows the full impact on AUM, revenue, EBITDA, net income, cash balance, IRR, MOIC, and TVPI – giving you a clear view of downside protection and upside potential across different market conditions.
An Exit Multiple Sensitivity Table shows carry income across a matrix of management fee rates and exit multiples, colour-coded so you can instantly see where carry is strong in green, moderate in amber, or at zero in red.
📈 Executive Dashboard
The Dashboard is the first sheet you open – a complete at-a-glance overview of the GP platform forecast.
Six KPI tiles show the key platform metrics at a glance: Total AUM in Year 10, Total Revenue in Year 10, EBITDA in Year 10, Net Income in Year 10, Cash Balance in Year 10, and Fund I Net IRR.
Four fully working charts are linked directly to model data. The AUM Growth line chart shows platform scale building across all three fund generations, peaking when all funds are concurrently active, then contracting as capital is returned. The Revenue Mix stacked bar chart shows management fees versus carried interest year by year and visually demonstrates the shift from fee-driven to carry-driven revenue as funds mature. The EBITDA versus Net Income clustered bar chart shows the profitability trajectory from early-year losses to mid-forecast breakeven to peak carry-driven profit. The Cash Balance line chart shows GP platform liquidity building from partner contributions through to carry realisation.
A Fund Performance Summary Table covers Fund I, Fund II, and Fund III, showing for each fund the vintage year, fund size, investment period, Gross IRR, Net IRR, MOIC, DPI, TVPI, and current status – whether in deployment, harvest phase, or still active.
⚙️ Simple, Professional Input Structure
The model is designed to be immediately usable – no Excel consultant required.
🔵 Blue cells = hardcoded inputs you control
⚫ Black cells = automated formula calculations
🟢 Green cells = cross-sheet links pulling from other tabs
All inputs are centralised in a single Assumptions tab. Change any driver once and it flows through every sheet, every formula, and every chart automatically. Key adjustable inputs include fund sizes and vintage years for Fund I through Fund IV, management fee rates for the investment and harvest periods, the step-down trigger year, carry rate and preferred return and hurdle rate, GP commitment percentage, deals per year and average investment size, follow-on investment reserve percentage, holding period and exit multiples across low, base, and high scenarios, headcount by role, annual salary raise, bonus percentage, benefits rate, all G&A line items and the inflation rate, CapEx amounts and asset useful lives, and the tax rate and discount rate.
No numbers are hardcoded in the forecast tabs. Every projection derives from the Assumptions sheet.
🏆 Who This Model Is For
Perfect for:
✔ Private equity General Partners and fund managers
✔ Emerging managers building their first or second fund
✔ Family offices structuring a formal GP platform
✔ PE-backed management companies modelling GP economics
✔ Investment bankers and advisors preparing GP platform valuations
✔ CFOs and finance teams at established PE firms
✔ Fundraising pitches and LP due diligence packages
✔ Strategic planning for GP platform build-out and team expansion
If your business involves raising LP capital, deploying it into private equity transactions, generating management fees and carry, and scaling a professional GP platform, this model provides the complete structured financial planning framework.
📅 12-Sheet Model – Complete Tab Structure
The model delivers a full professional workbook across 12 fully structured, colour-coded sheets. The Dashboard provides KPI tiles, four working charts, and the fund performance summary. The Assumptions tab holds all model inputs as the single source of truth. The Fundraising Model contains the Fund I through Fund III schedules with LP and GP commitments and deployment pacing. The AUM Schedule tracks the fund-level and total AUM waterfall across all 10 years. The Revenue Model breaks out management fees, carry, and portfolio fees fund by fund. The Exit & Carry Model tracks exit proceeds, cost basis, gross profit, and carry income. Operating Expenses covers the headcount plan, compensation by role, and G&A with inflation. The Income Statement runs the full P&L from revenue through to net income. The Balance Sheet tracks all assets, liabilities, and equity fully linked to the other statements. The Cash Flow Statement is built on the indirect method covering operating, investing, and financing activities. Supporting Schedules contains the CapEx schedule, depreciation schedule, and working capital schedule. Sensitivity Analysis delivers the five-scenario matrix and the exit multiple sensitivity table.
🚀 Plan the Future of Your Private Equity Firm
With the Private Equity GP Platform Financial Model, you can finally understand how your fund strategy, deployment pace, and exit performance affect GP-level revenue, profitability, and cash generation – all in one connected system.
The model correctly captures what makes PE GP economics distinctive and often misunderstood. Early years are loss-making because management fees alone do not cover full team and overhead costs. Profitability arrives when exits occur and the hurdle is cleared. Peak revenue occurs mid-to-late in the forecast when multiple funds are simultaneously in harvest. Cash builds strongly in the back half of the forecast driven by carry realisation as the platform becomes self-funding.
Everything is connected in one institutional-quality financial forecasting framework.
✅ Three-fund fundraising model with LP and GP commitment schedules
✅ AUM schedule with fund-by-fund waterfall from launch to harvest
✅ Deal deployment and portfolio sizing model
✅ Exit schedule with cost basis, gross profit, and carry waterfall
✅ Fund performance metrics: Gross IRR, Net IRR, MOIC, DPI, RVPI, TVPI
✅ Full 3-statement model – Income Statement, Balance Sheet, Cash Flow – fully linked
✅ Role-by-role compensation and headcount plan
✅ G&A with annual inflation escalation across eight categories
✅ CapEx and straight-line depreciation schedule across three asset classes
✅ Working capital forecasting with cash timing
✅ Five-scenario analysis plus exit multiple sensitivity table
✅ Executive dashboard with four working charts and six KPI tiles
✅ Single Assumptions tab controlling the entire model
All inside one structured, professional-grade private equity GP platform financial model.
Key Words:
Strategy & Transformation, Growth Strategy, Strategic Planning, Strategy Frameworks, Innovation Management, Pricing Strategy, Core Competencies, Strategy Development, Business Transformation, Marketing Plan Development, Product Strategy, Breakout Strategy, Competitive Advantage, Mission, Vision, Values, Strategy Deployment & Execution, Innovation, Vision Statement, Core Competencies Analysis, Corporate Strategy, Product Launch Strategy, BMI, Blue Ocean Strategy, Breakthrough Strategy, Business Model Innovation, Business Strategy Example, Corporate Transformation, Critical Success Factors, Customer Segmentation, Customer Value Proposition, Distinctive Capabilities, Enterprise Performance Management, KPI, Key Performance Indicators, Market Analysis, Market Entry Example, Market Entry Plan, Market Intelligence, Market Research, Market Segmentation, Market Sizing, Marketing, Michael Porter's Value Chain, Organizational Transformation, Performance Management, Performance Measurement, Platform Strategy, Product Go-to-Market Strategy, Reorganization, Restructuring, SWOT, SWOT Analysis, Service 4.0, Service Strategy, Service Transformation, Strategic Analysis, Strategic Plan Example, Strategy Deployment, Strategy Execution, Strategy Frameworks Compilation, Strategy Methodologies, Strategy Report Example, Value Chain, Value Chain Analysis, Value Innovation, Value Proposition, Vision Statement, Corporate Strategy, Business Development, Business plan pdf, business plan, PDF, Business Plan DOC, Business Plan Template, PPT, Market strategy playbook, strategic market planning, competitive analysis tools, market segmentation frameworks, growth strategy templates, product positioning strategy, market execution toolkit, strategic alignment playbook, KPI and OKR frameworks, business growth strategy guide, cross-functional strategy templates, market risk management, market strategy PowerPoint doc, guide, ebook, e-book ,McKinsey Change Playbook, Organizational change management toolkit, Change management frameworks 2025, Influence model for change, Change leadership strategies, Behavioral change in organizations, Change management PowerPoint templates, Transformational leadership in change, supply chain KPIs, supply chain KPI toolkit, supply chain PowerPoint template, logistics KPIs, procurement KPIs, inventory management KPIs, supply chain performance metrics, manufacturing KPIs, supply chain dashboard, supply chain strategy KPIs, reverse logistics KPIs, sustainability KPIs in supply chain, financial supply chain KPIs, warehouse KPIs, digital supply chain KPIs, 1200 KPIs, supply chain scorecard, KPI examples, supply chain templates, Corporate Finance SOPs, Finance SOP Excel Template, CFO Toolkit, Finance Department Procedures, Financial Planning SOPs, Treasury SOPs, Accounts Payable SOPs, Accounts Receivable SOPs, General Ledger SOPs, Accounting Policies Template, Internal Controls SOPs, Finance Process Standardization, Finance Operating Procedures, Finance Department Excel Template, FP&A Process Documentation, Corporate Finance Template, Finance SOP Toolkit, CFO Process Templates, Accounting SOP Package, Tax Compliance SOPs, Financial Risk Management Procedures.
NOTE: Our digital products are sold on an "as is" basis, making returns and refunds unavailable post-download. Please preview and inquire before purchasing. Please contact us before purchasing if you have any questions! This policy aligns with the standard Flevy Terms of Usage.
Got a question about the product? Email us at support@flevy.com or ask the author directly by using the "Ask the Author a Question" form. If you cannot view the preview above this document description, go here to view the large preview instead.
Source: Best Practices in Private Equity, Integrated Financial Model Excel: Private Equity Firm 10-Year 3 Statement Financial Model Excel (XLSX) Spreadsheet, SB Consulting
ABOUT THE AUTHOR
SB Consulting is dedicated to empowering businesses to communicate their ideas with impact. This consulting firm specializes in teaching organizations how to create effective corporate and management presentations. With training from top-tier global consulting firms, including McKinsey, BCG, and Porsche Consulting, extensive expertise in presentation design and ... [read more]
Ask the Author a Question
You must be logged in to contact the author.
