

Mico-SaaS Advanced Financial Model (MRR, ARR, LTV, CAC) – Excel XLSX
Excel (XLSX)
BENEFITS OF THIS DOWNLOADABLE EXCEL DOCUMENT
- Provides a complete financial framework for modeling, scaling, and stress-testing a Micro-SaaS business across a full 10-year horizon.
- Delivers a fully integrated 3-statement model purpose-built for Micro-SaaS unit economics, subscriber churn, and per-customer cost structures.
- Gives solo founders and operators an investor-ready financial model built around real Micro-SaaS revenue drivers -- subscriptions, add-ons, and usage-based pricing.
SAAS EXCEL DESCRIPTION
Curated by McKinsey-trained Executives
🚀 Micro-SaaS Financial Model | 3-Statement 10-Year Forecast
Turn your Micro-SaaS into a fundable, acquirable, investor-ready business – modeled with institutional-grade precision.
Whether you're a solo founder shipping your first paid product, a bootstrapper crossing $10K MRR, an operator managing a Micro-SaaS portfolio, or a buyer evaluating an acquisition on – this fully integrated 3-Statement Financial Model gives you the exact financial infrastructure to plan, pitch, fund, and exit with complete confidence.
💡 What's Inside
This model covers every financial dimension of building and scaling a Micro-SaaS business – from your first 150 paying subscribers through a 10-year path to profitability, acquisition, or growth round. Built on Financial Modeling best practices, it's fully dynamic, cross-linked across 15 tabs, and ready to customize for your specific pricing tiers, churn profile, and growth trajectory.
📥 Inputs
• 🎯 Customer Growth Drivers – Starting customer count, new leads per month, lead-to-paid conversion rate, monthly churn rate, annual lead growth rate, and annual conversion improvement – every lever that drives your subscriber waterfall, fully adjustable from a single Assumptions tab
• 💰 3-Tier Subscription Pricing Model – Starter, Pro, and Business plan monthly prices with customer mix percentages per tier, blended ARPU auto-calculation, and add-on revenue as a percentage of subscription revenue – built for freemium ladders, usage upgrades, and tiered SaaS pricing in equal measure
• 👥 120-Month Customer Cohort Model – Month-by-month active customer waterfall across a full 10 years: starting customers, new customers acquired, churned customers lost, and ending active subscribers – the foundation every SaaS investor interrogates first
• 📈 MRR & ARR Waterfall – Monthly Recurring Revenue and Annual Recurring Revenue tracked at December of each year, with revenue growth rate year-over-year and full monthly granularity in the Customer Model
• 🏭 Cost of Revenue – Per Customer Unit Economics – Cloud hosting cost per customer per month, third-party API cost per customer per month, and support tool cost per customer per month – all driver-based, scaling automatically with your active subscriber count
• 📣 Sales & Marketing Spend – Monthly paid ad spend (Year 1), monthly content and SEO spend (Year 1), annual marketing spend growth rate, and add-on revenue percentage – all compounding annually and flowing directly into the Operating Expenses schedule
• 🧑💼 Personnel Plan – 6 Core Roles – Founder/CEO, Software Engineer, Product Manager, Marketing Manager, Customer Success, and Support Staff – with Year 1 salaries, annual inflation and raise compounding, benefits load as a percentage of salary, and a role-by-role hire plan by year
• 🏗️ CapEx & Depreciation – Initial development hardware, infrastructure setup, and annual miscellaneous CapEx – with straight-line depreciation over a configurable asset life, capitalized software dev costs, and net PP&E tracking across all 10 years
• 🏦 Financing & Capital Structure – Initial founder equity investment, small business loan proceeds, annual debt repayment schedule, and annual interest rate on debt – fully flowing into the Cash Flow Statement and Balance Sheet
• 📊 Sensitivity & Scenario Analysis – Stress-test your model instantly: a Monthly Churn Rate vs. Lead Conversion Rate matrix showing Year 5 revenue across 25 combinations, plus a full ARPU sensitivity table from 70% to 130% of base – so you always know your floor and your ceiling
📤 Outputs
• 📈 10-Year 3-Statement Financial Model – Fully integrated Income Statement, Balance Sheet, and Cash Flow Statement, cross-linked and auto-balancing across all 10 years
• 🗂️ 3-Stream Revenue Breakdown – Annual projections for Subscription Revenue, Add-On Revenue, and Usage-Based Revenue with year-over-year growth rates, customer-count-driven scaling, and blended ARPU analysis
• 👤 Customer Growth Model – 120-month subscriber waterfall tracking active customers, new customers acquired per year, churned customers lost per year, average active customers, ARPU, and monthly churn rate – the exact data every SaaS investor and acquirer demands
• 📡 MRR & ARR Metrics – Ending MRR, ending ARR, and revenue growth percentage for all 10 years – pulled directly from the Customer Model and surfaced on the Dashboard and KPI sheet
• 💼 Personnel Plan – Role-by-role headcount scaling for all 6 positions, with salary cost by role including benefits, total personnel cost per year, and a hire plan flag system across all 10 years
• 🏛️ CapEx & Depreciation Schedule – Total CapEx per year broken into development hardware, infrastructure setup, and miscellaneous CapEx – with Year 1 depreciation, ongoing CapEx depreciation, total annual depreciation, and net PP&E end-of-period for all 10 years
• 🔄 Working Capital Schedule – Accounts receivable (30-day), prepaid expenses, accounts payable (30-day COGS), accrued expenses, and deferred revenue (1-month) – with net working capital and annual change in NWC fully linked into the Cash Flow Statement
• 🔍 Sensitivity Analysis – Churn rate vs. conversion rate revenue matrix (5×5) and ARPU scaling sensitivity table (7 scenarios from 70% to 130% of base ARPU) – giving you instant scenario answers without touching a single formula
• 📊 Executive Dashboard – 8 dynamic charts covering Total Revenue, Active Customers, MRR, ARR, Gross Margin %, Net Income, Total Headcount, and Ending Cash Balance – plus a full 10-year KPI summary table covering every metric investors ask about
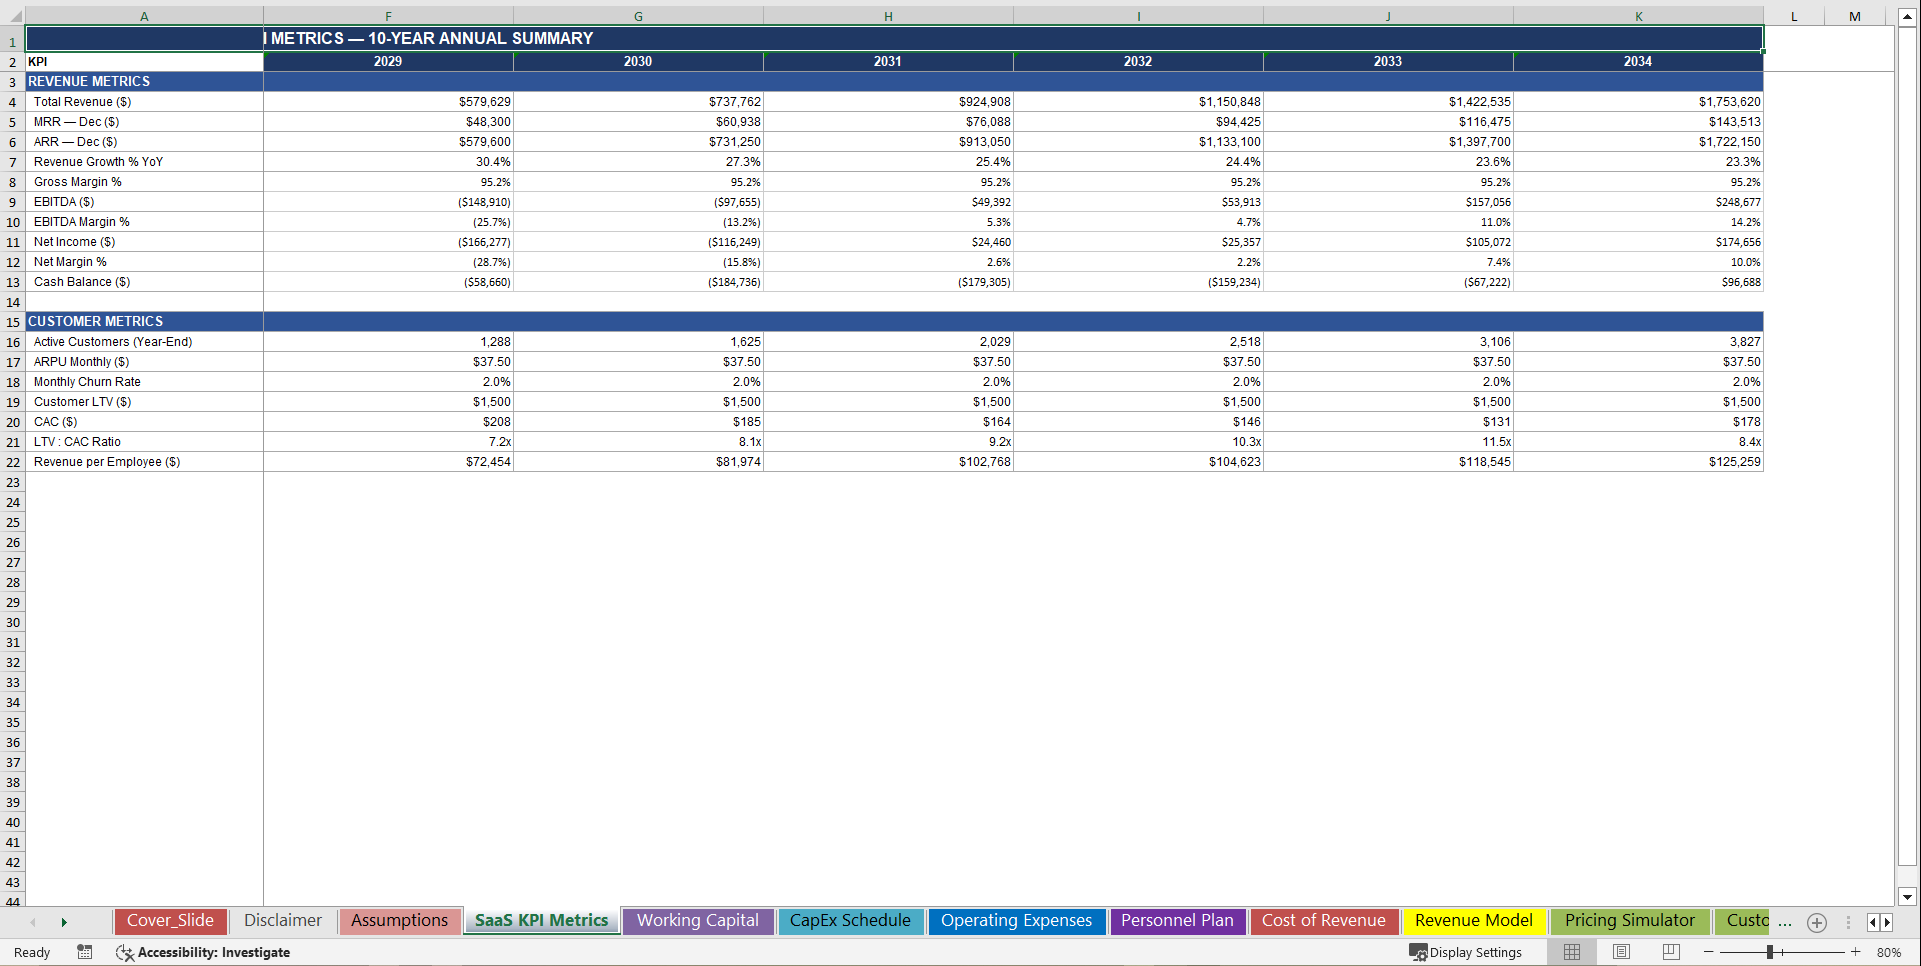
• 📐 SaaS KPI Metrics – All 10 Years – Total Revenue, MRR, ARR, Revenue Growth %, Gross Margin %, EBITDA, EBITDA Margin %, Net Income, Net Margin %, Cash Balance, Active Customers, Monthly ARPU, Monthly Churn Rate, Customer LTV, CAC, LTV:CAC Ratio, and Revenue per Employee – every number in one place
🏆 Why This Model Stands Out
✅ Fully integrated – every sheet talks to every other sheet. Change one assumption and 3,340 formulas update instantly across all 15 tabs – no broken links, no manual reconciliation, no version control nightmares
✅ Investor-ready – structured and formatted to answer the exact questions pre-seed investors, seed VCs, SaaS-focused angels, revenue-based lenders, and buyers ask on day one: What is ARR? What is net churn? What is LTV/CAC? When do you turn profitable?
✅ Micro-SaaS realistic – built around how Micro-SaaS products actually generate and lose revenue: subscription MRR driven by real lead-to-paid conversion rates, a per-customer cost of revenue model (hosting, APIs, support tools), add-on revenue layered on top of subscriptions, and a lean 6-person hiring plan that reflects how solo founders actually scale – not inflated agency headcounts or enterprise SaaS assumptions recycled into a template
✅ Color-coded for clarity – blue inputs, black formulas, green cross-sheet links – industry-standard financial modeling conventions throughout, so any investor, operator, or acquirer can open it and immediately understand the logic
✅ Fully unlocked – no protected sheets, no black-box formulas, no hidden logic. Every assumption is visible. Every formula is auditable. Own it, customize it, and present it to any investor or buyer with complete confidence
📋 Model Structure – 15 Sheets
• Dashboard – 8 live charts + full 10-year KPI summary table across all key revenue, margin, customer, and cash metrics
• Assumptions – Every input centralized in one place: pricing tiers, customer growth drivers, cost of revenue rates, marketing spend, salary levels, hire plan, CapEx, and financing – all blue-coded for instant editing
• Customer Model – 120-month subscriber waterfall: starting customers, new leads, lead-to-paid conversion, churned customers, and ending active subscribers – month by month for all 10 years
• Pricing Simulator – Interactive unit economics calculator: ARPU, new customers per month, churned customers per month, MRR, ARR, Customer LTV, LTV:CAC Ratio, and CAC Payback Period
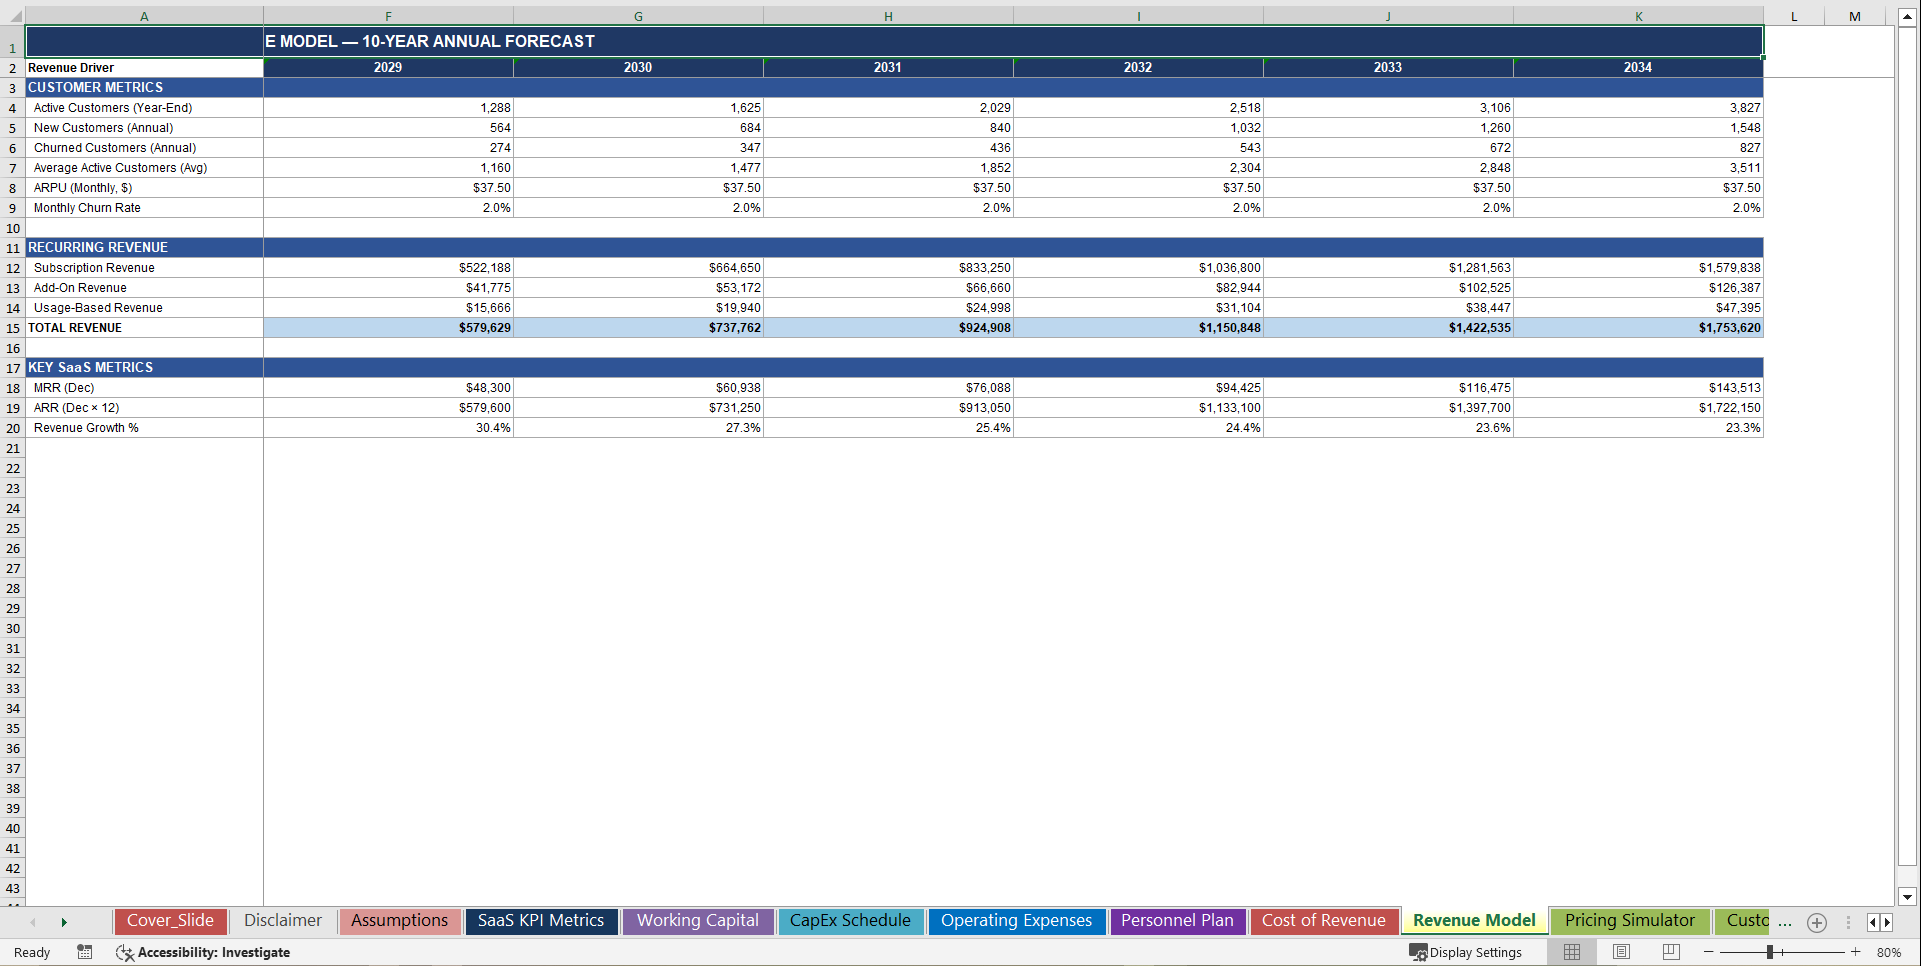
• Revenue Model – All 3 revenue streams (Subscription, Add-On, Usage-Based) fully formula-driven, with active customer metrics and key SaaS metrics (MRR, ARR, growth rate) across all 10 annual periods
• Cost of Revenue – Per-customer infrastructure costs: cloud hosting, third-party APIs, and support tools – scaling automatically with active subscriber count, with gross profit and gross margin output
• Personnel Plan – All 6 roles with headcount by year, salary costs including benefits, total personnel cost, and a binary hire plan flag system across all 10 years
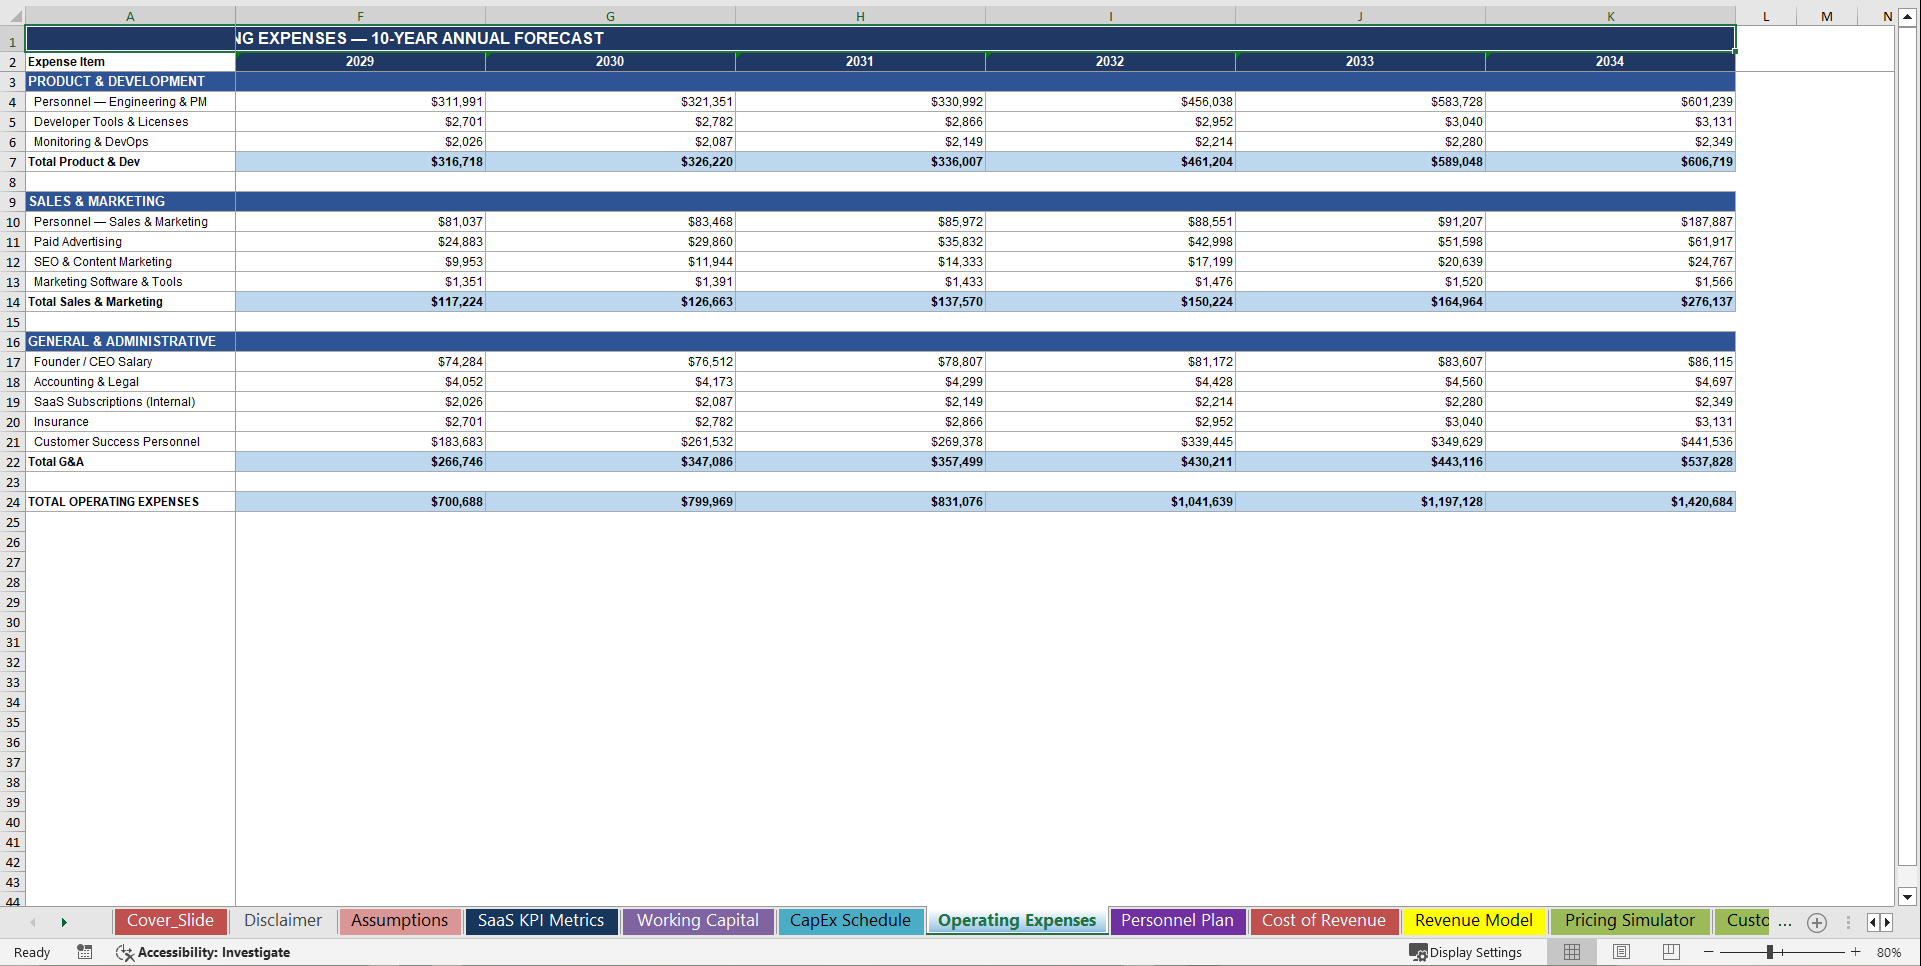
• Operating Expenses – 3 cost categories (Product & Development, Sales & Marketing, G&A) with 11 individual line items scaling with headcount, revenue, and customer count
• CapEx Schedule – Development hardware, infrastructure setup, and miscellaneous CapEx with straight-line depreciation, accumulated depreciation, and net PP&E by year
• Working Capital Schedule – Accounts receivable, prepaid expenses, accounts payable, accrued expenses, and deferred revenue – with net working capital and change in NWC fully linked to the Cash Flow Statement
• Income Statement – Revenue → Gross Profit → EBITDA → EBIT → Pre-Tax Income → Net Income, with 3 revenue sub-lines, 11 operating expense sub-lines, D&A, stock-based compensation, interest expense, and tax provision
• Balance Sheet – Current assets (Cash, AR, Prepaid, Deferred Contract Costs, Other), non-current assets (PP&E, Capitalized Software), current liabilities (AP, Accrued Compensation, Accrued Expenses, Deferred Revenue, Current LTD), non-current liabilities (LTD, Deferred Tax), and equity – auto-balancing to zero across all 10 years
• Cash Flow Statement – Indirect method: Net Income → adjustments (D&A, SBC, debt discount amortization) → 5 working capital line items → CapEx and capitalized software investing → equity contributions, debt proceeds, repayment, and interest paid – with beginning and ending cash balance fully linked to the Balance Sheet
• SaaS KPI Metrics – All 17 KPIs in one consolidated table across all 10 years: revenue metrics, margin metrics, cash, customer count, ARPU, churn, LTV, CAC, LTV:CAC, and revenue per employee
• Sensitivity Analysis – Monthly Churn Rate × Lead Conversion Rate revenue matrix (25-cell scenario table) and ARPU sensitivity table (7 scenarios, 70%–130% of base) – instant scenario answers with zero formula editing required
*"Most Micro-SaaS founders know their product inside out. The ones who raise capital, attract acquirers, and build lasting businesses also know their numbers inside out. This model is how you close that gap – in an afternoon, not a quarter."*
Key Words:
Strategy & Transformation, Growth Strategy, Strategic Planning, Strategy Frameworks, Innovation Management, Pricing Strategy, Core Competencies, Strategy Development, Business Transformation, Marketing Plan Development, Product Strategy, Breakout Strategy, Competitive Advantage, Mission, Vision, Values, Strategy Deployment & Execution, Innovation, Vision Statement, Core Competencies Analysis, Corporate Strategy, Product Launch Strategy, BMI, Blue Ocean Strategy, Breakthrough Strategy, Business Model Innovation, Business Strategy Example, Corporate Transformation, Critical Success Factors, Customer Segmentation, Customer Value Proposition, Distinctive Capabilities, Enterprise Performance Management, KPI, Key Performance Indicators, Market Analysis, Market Entry Example, Market Entry Plan, Market Intelligence, Market Research, Market Segmentation, Market Sizing, Marketing, Michael Porter's Value Chain, Organizational Transformation, Performance Management, Performance Measurement, Platform Strategy, Product Go-to-Market Strategy, Reorganization, Restructuring, SWOT, SWOT Analysis, Service 4.0, Service Strategy, Service Transformation, Strategic Analysis, Strategic Plan Example, Strategy Deployment, Strategy Execution, Strategy Frameworks Compilation, Strategy Methodologies, Strategy Report Example, Value Chain, Value Chain Analysis, Value Innovation, Value Proposition, Vision Statement, Corporate Strategy, Business Development, Business plan pdf, business plan, PDF, Business Plan DOC, Business Plan Template, PPT, Market strategy playbook, strategic market planning, competitive analysis tools, market segmentation frameworks, growth strategy templates, product positioning strategy, market execution toolkit, strategic alignment playbook, KPI and OKR frameworks, business growth strategy guide, cross-functional strategy templates, market risk management, market strategy PowerPoint doc, guide, ebook, e-book ,McKinsey Change Playbook, Organizational change management toolkit, Change management frameworks 2025, Influence model for change, Change leadership strategies, Behavioral change in organizations, Change management PowerPoint templates, Transformational leadership in change, supply chain KPIs, supply chain KPI toolkit, supply chain PowerPoint template, logistics KPIs, procurement KPIs, inventory management KPIs, supply chain performance metrics, manufacturing KPIs, supply chain dashboard, supply chain strategy KPIs, reverse logistics KPIs, sustainability KPIs in supply chain, financial supply chain KPIs, warehouse KPIs, digital supply chain KPIs, 1200 KPIs, supply chain scorecard, KPI examples, supply chain templates, Corporate Finance SOPs, Finance SOP Excel Template, CFO Toolkit, Finance Department Procedures, Financial Planning SOPs, Treasury SOPs, Accounts Payable SOPs, Accounts Receivable SOPs, General Ledger SOPs, Accounting Policies Template, Internal Controls SOPs, Finance Process Standardization, Finance Operating Procedures, Finance Department Excel Template, FP&A Process Documentation, Corporate Finance Template, Finance SOP Toolkit, CFO Process Templates, Accounting SOP Package, Tax Compliance SOPs, Financial Risk Management Procedures.
NOTE: Our digital products are sold on an "as is" basis, making returns and refunds unavailable post-download. Please preview and inquire before purchasing. Please contact us before purchasing if you have any questions! This policy aligns with the standard Flevy Terms of Usage.
Got a question about the product? Email us at support@flevy.com or ask the author directly by using the "Ask the Author a Question" form. If you cannot view the preview above this document description, go here to view the large preview instead.
Source: Best Practices in SaaS, Integrated Financial Model Excel: Mico-SaaS Advanced Financial Model (MRR, ARR, LTV, CAC) Excel (XLSX) Spreadsheet, SB Consulting
ABOUT THE AUTHOR
SB Consulting is dedicated to empowering businesses to communicate their ideas with impact. This consulting firm specializes in teaching organizations how to create effective corporate and management presentations. With training from top-tier global consulting firms, including McKinsey, BCG, and Porsche Consulting, extensive expertise in presentation design and ... [read more]
Ask the Author a Question
You must be logged in to contact the author.
