This collection of Innovation KPIs is compiled by former McKinsey, BCG, Deloitte, EY, and Capgemini consultants based on best practices in Product Management.
This PPT provides a comprehensive set of 500+ Product Management KPIs to identify areas of strength and opportunities for improvement in Product Development, Customer Satisfaction, and Market Positioning.
It offers a ready-to-use, extensive collection of KPIs, saving significant time and effort in research and compilation.
The wide range of KPIs allows for tailored selection and customization to fit specific industry needs and organizational goals, ensuring that your Product Strategy remains relevant and competitive in an ever-evolving market.
DESCRIPTION
This product (
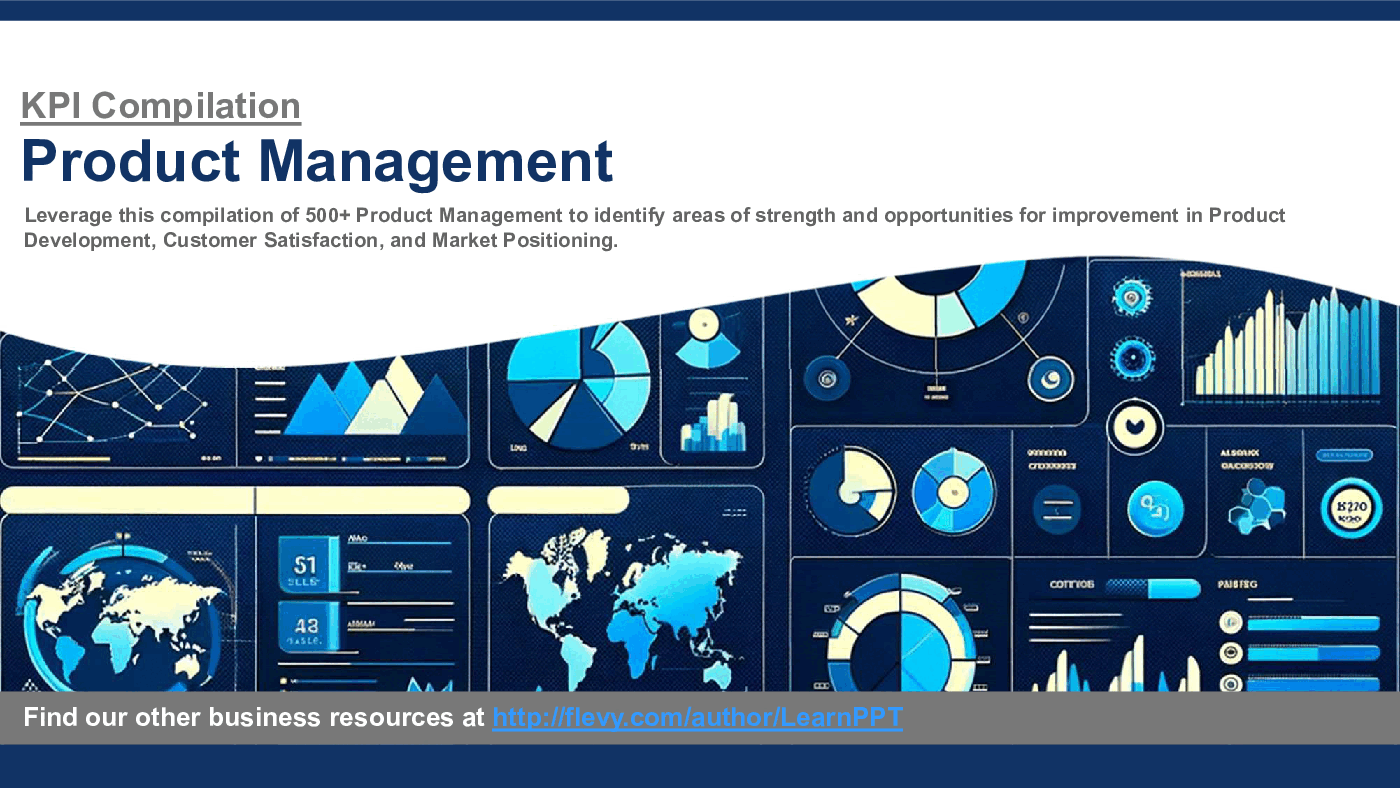
KPI Compilation: 500+ Product Management KPIs) is a 112-slide PPT PowerPoint presentation slide deck (PPTX), which you can download immediately upon purchase.
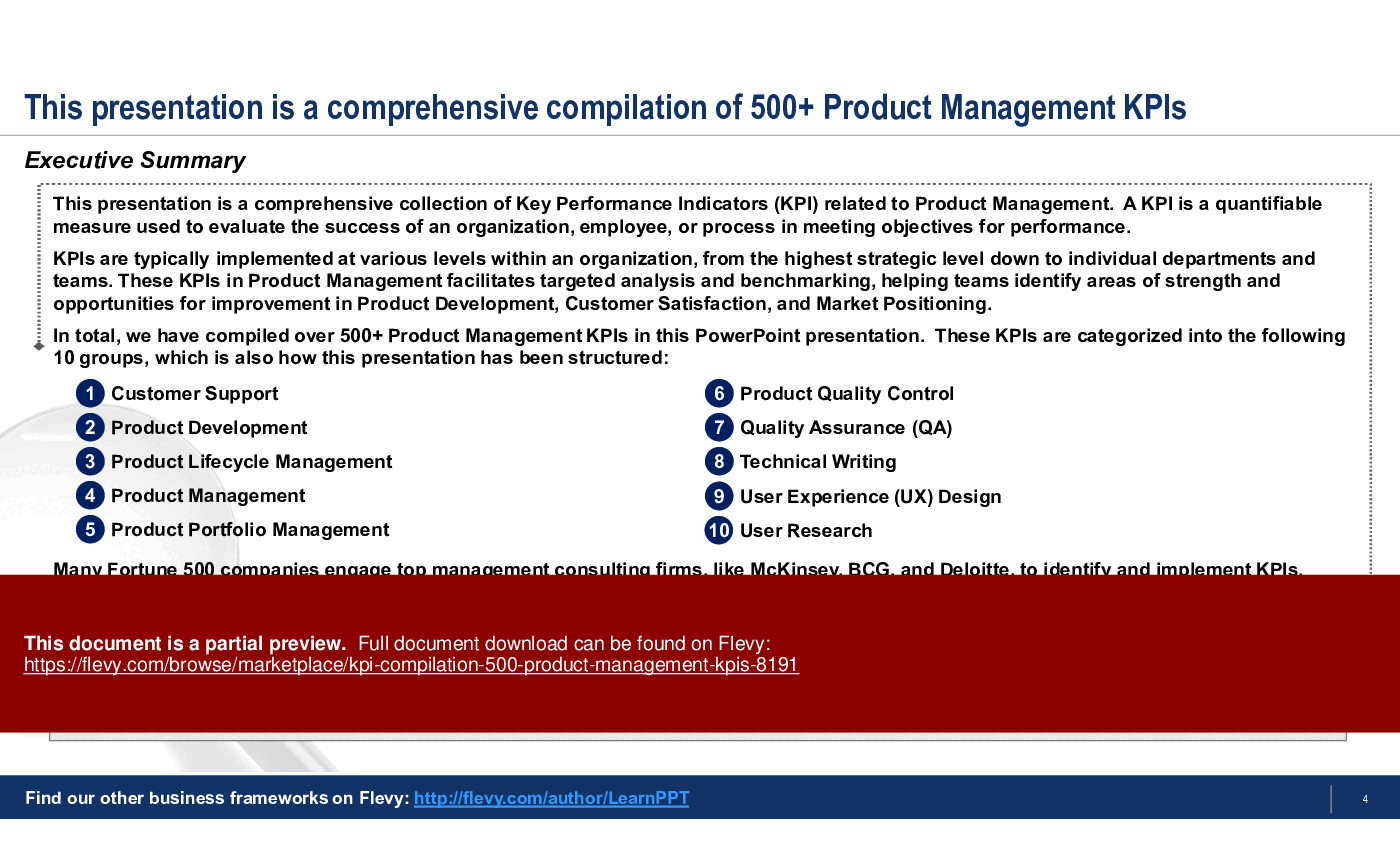
This presentation is a comprehensive collection of Key Performance Indicators (KPI) related to Product Management. A KPI is a quantifiable measure used to evaluate the success of an organization, employee, or process in meeting objectives for performance.
KPIs are typically implemented at various levels within an organization, from the highest strategic level down to individual departments and teams. These KPIs in Product Management facilitates targeted analysis and benchmarking, helping teams identify areas of strength and opportunities for improvement in Product Development, Customer Satisfaction, and Market Positioning.
In total, we have compiled over 500+ Product Management KPIs in this PowerPoint presentation. These KPIs are categorized into the following 10 groups, which is also how this presentation has been structured:
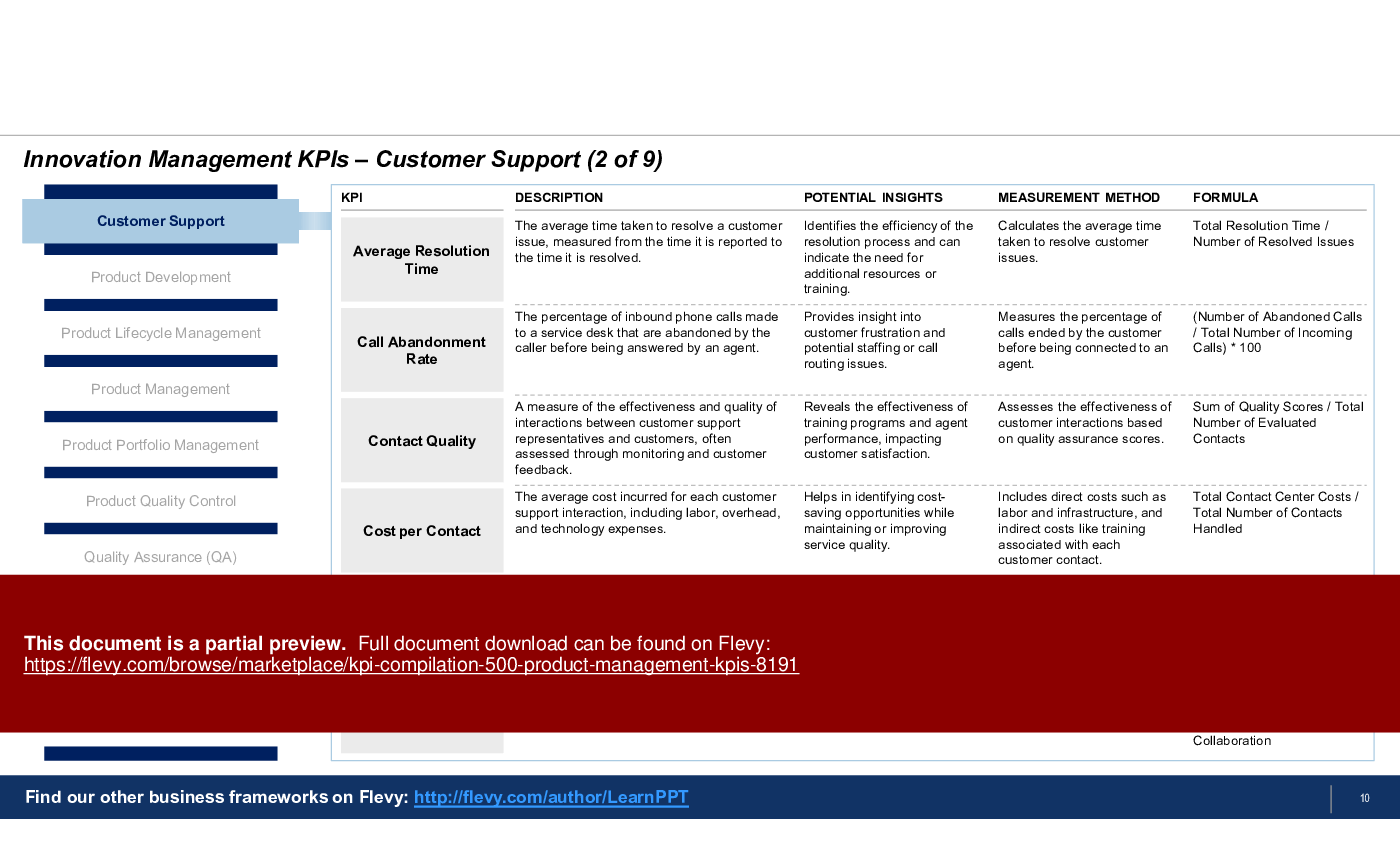
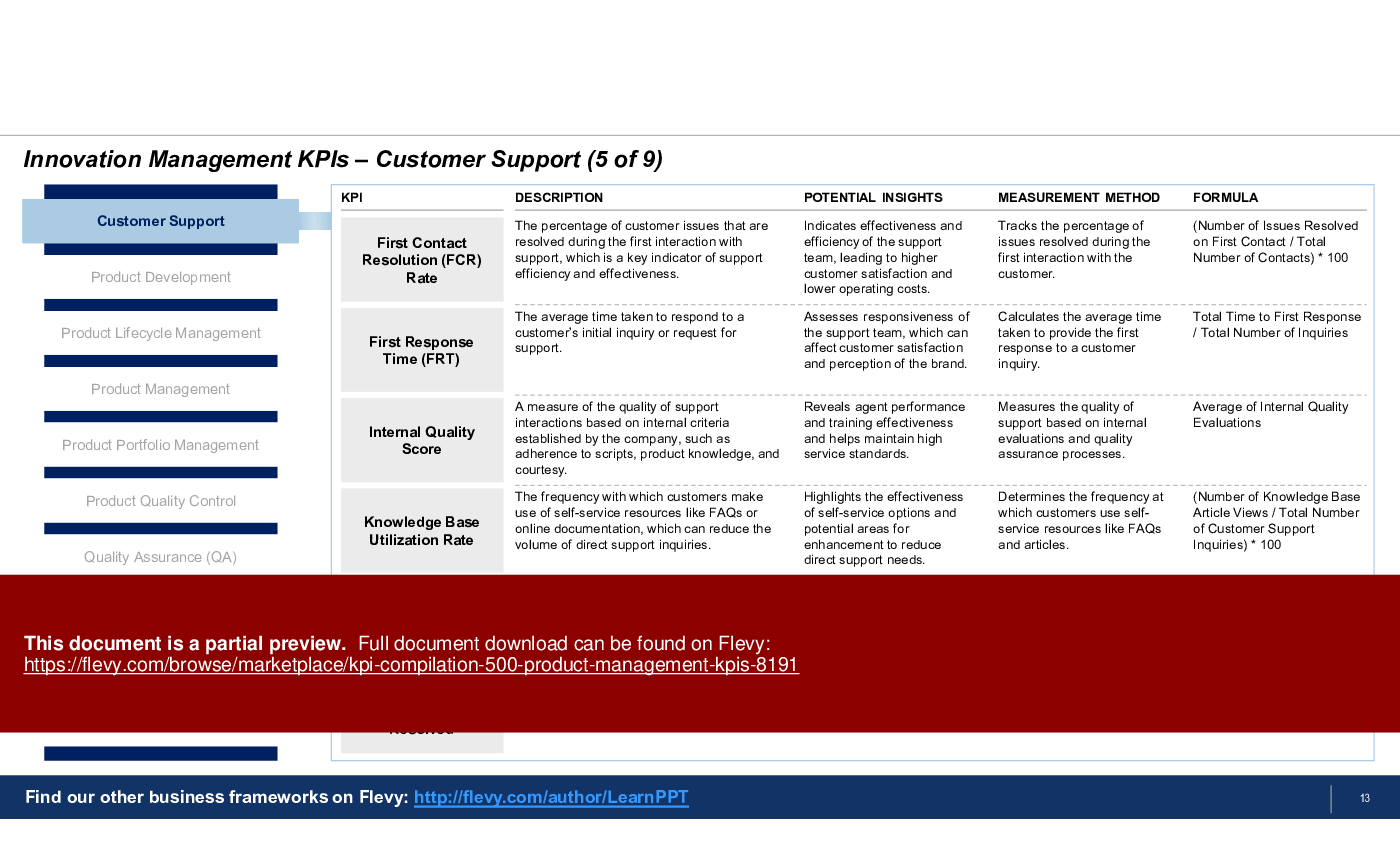
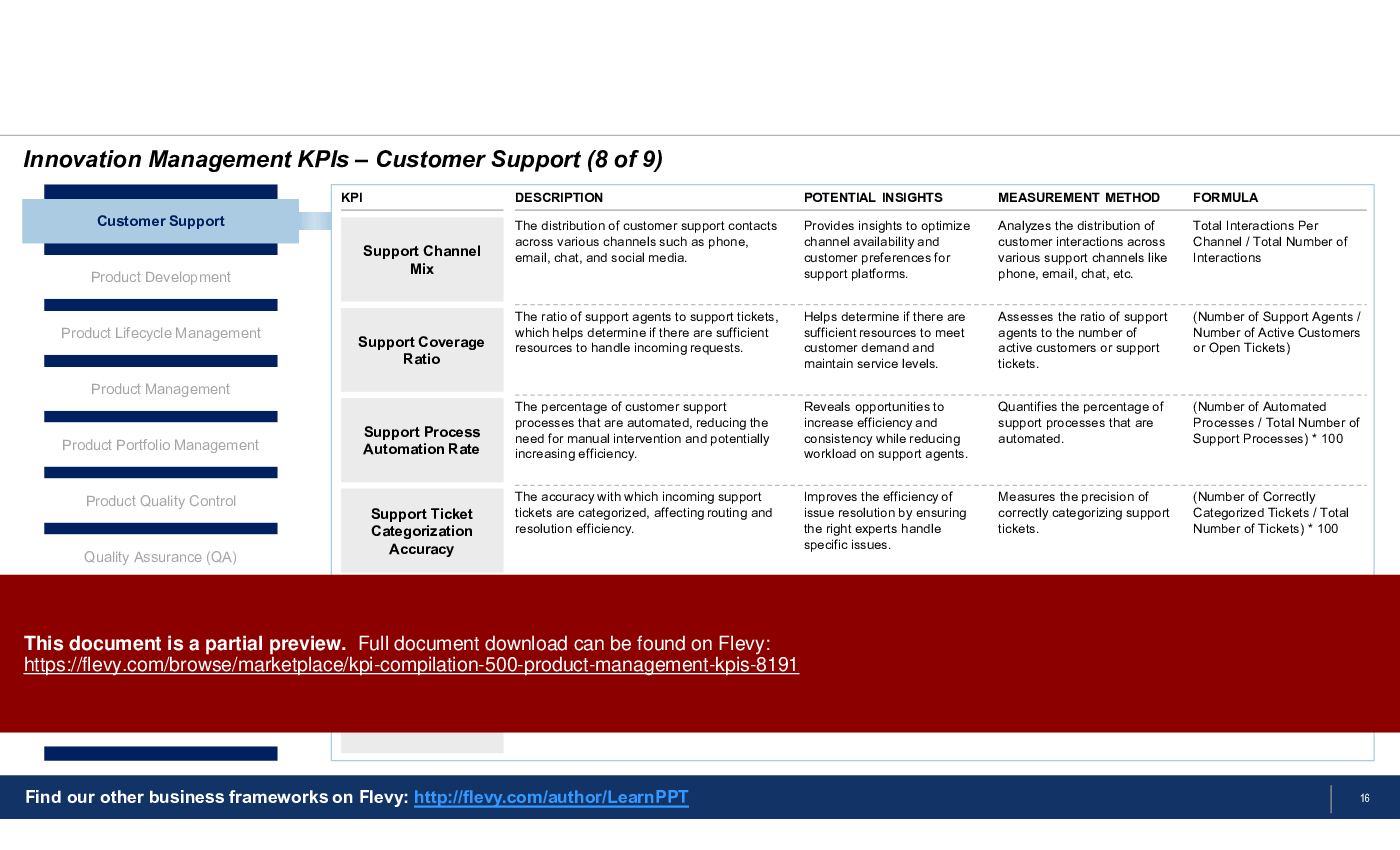
1. Customer Support – These KPIs evaluate the performance and effectiveness of customer service operations, focusing on customer satisfaction, response times, and issue resolution success rates
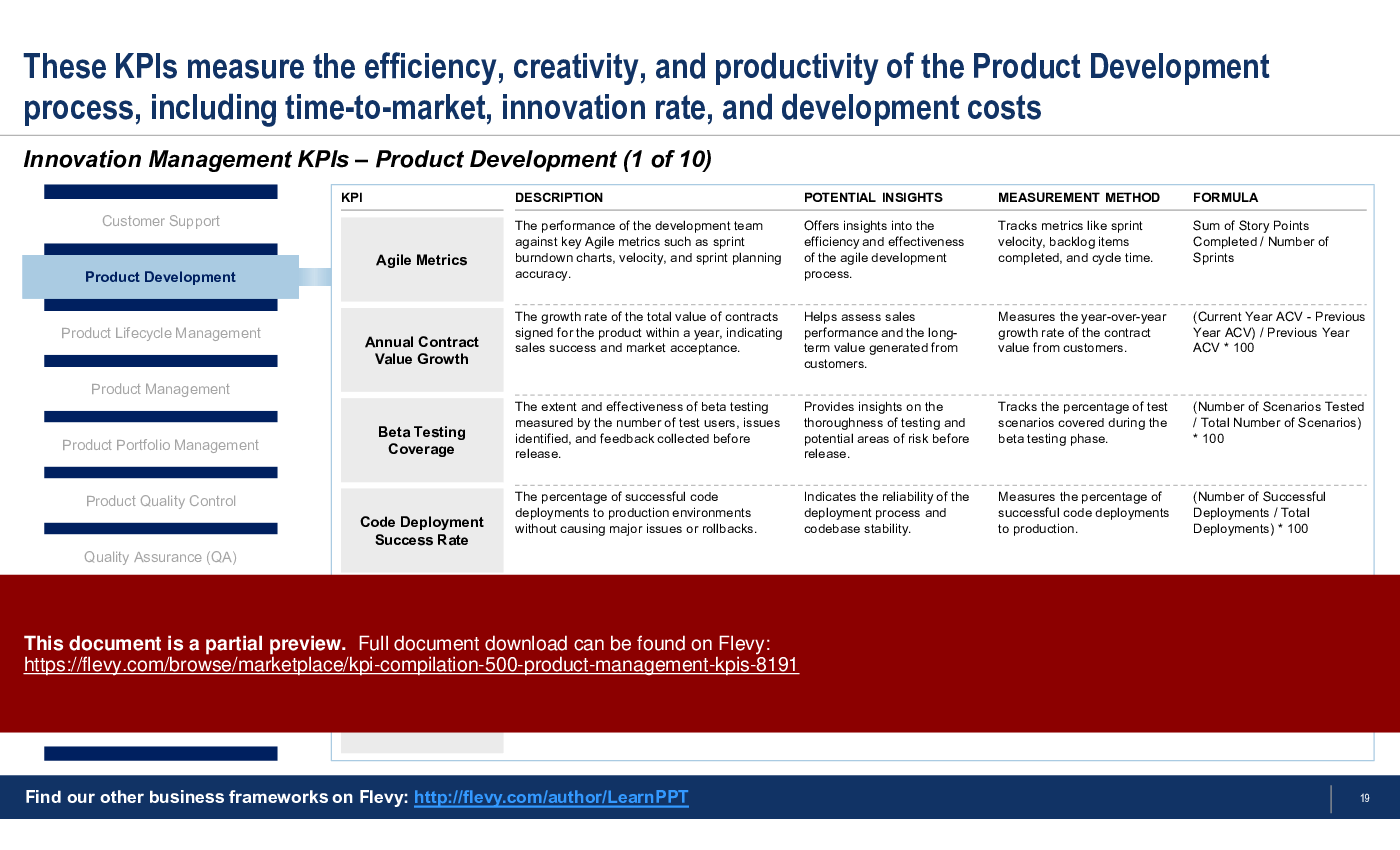
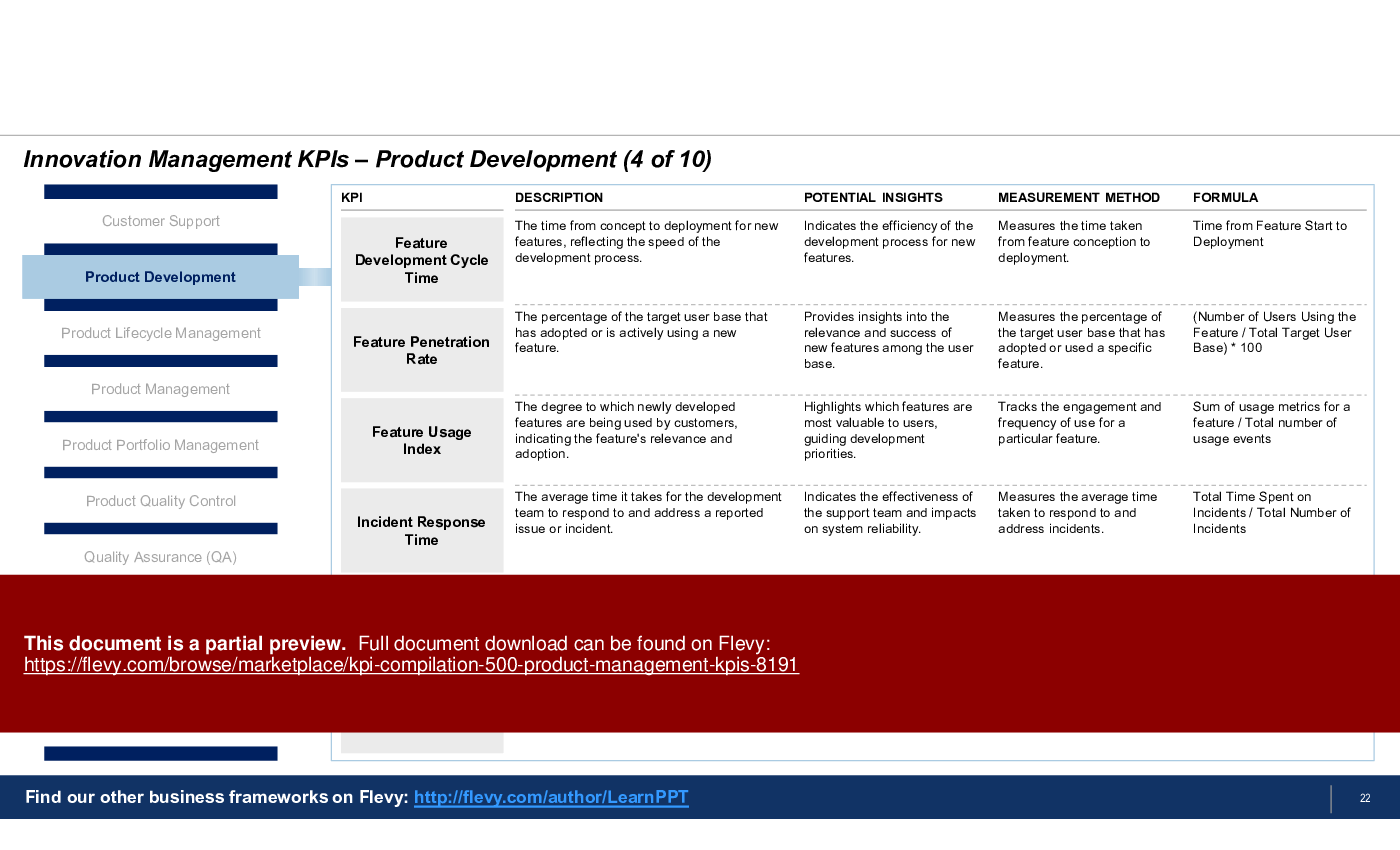
2. Product Development – These KPIs measure the efficiency, creativity, and productivity of the product development process, including time-to-market, innovation rate, and development costs
3. Product Lifecycle Management – These KPIs monitor the management and optimization of a product's lifecycle from inception to retirement, focusing on lifecycle duration, profitability, and adaptation to market changes
4. Product Management – These KPIs assess the overall effectiveness of product management strategies, including market alignment, product performance, and strategic contribution to business goals
5. Product Portfolio Management – These KPIs track the success and balance of the entire product portfolio, focusing on portfolio diversity, market coverage, and investment returns
6. Product Quality Control – These KPIs evaluate the consistency and reliability of product quality, encompassing defect rates, compliance with standards, and customer feedback on product quality
7. Quality Assurance (QA) – These KPIs measure the effectiveness of quality assurance processes in ensuring product standards and reliability, including test coverage, defect discovery, and corrective actions
8. Technical Writing – These KPIs assess the quality, effectiveness, and efficiency of technical documentation, focusing on clarity, user engagement, and accuracy in conveying technical information
9. User Experience (UX) Design – These KPIs evaluate the success of UX design in enhancing user interaction and satisfaction with the product, including usability, design appeal, and user engagement metrics
10. User Research – These KPIs track the effectiveness of user research in understanding customer needs and preferences, focusing on research depth, insights generation, and impact on product design
Many Fortune 500 companies engage top management consulting firms, like McKinsey, BCG, and Deloitte, to identify and implement KPIs, acknowledging their critical role in driving performance and strategic alignment, despite the significant investment this process entails.
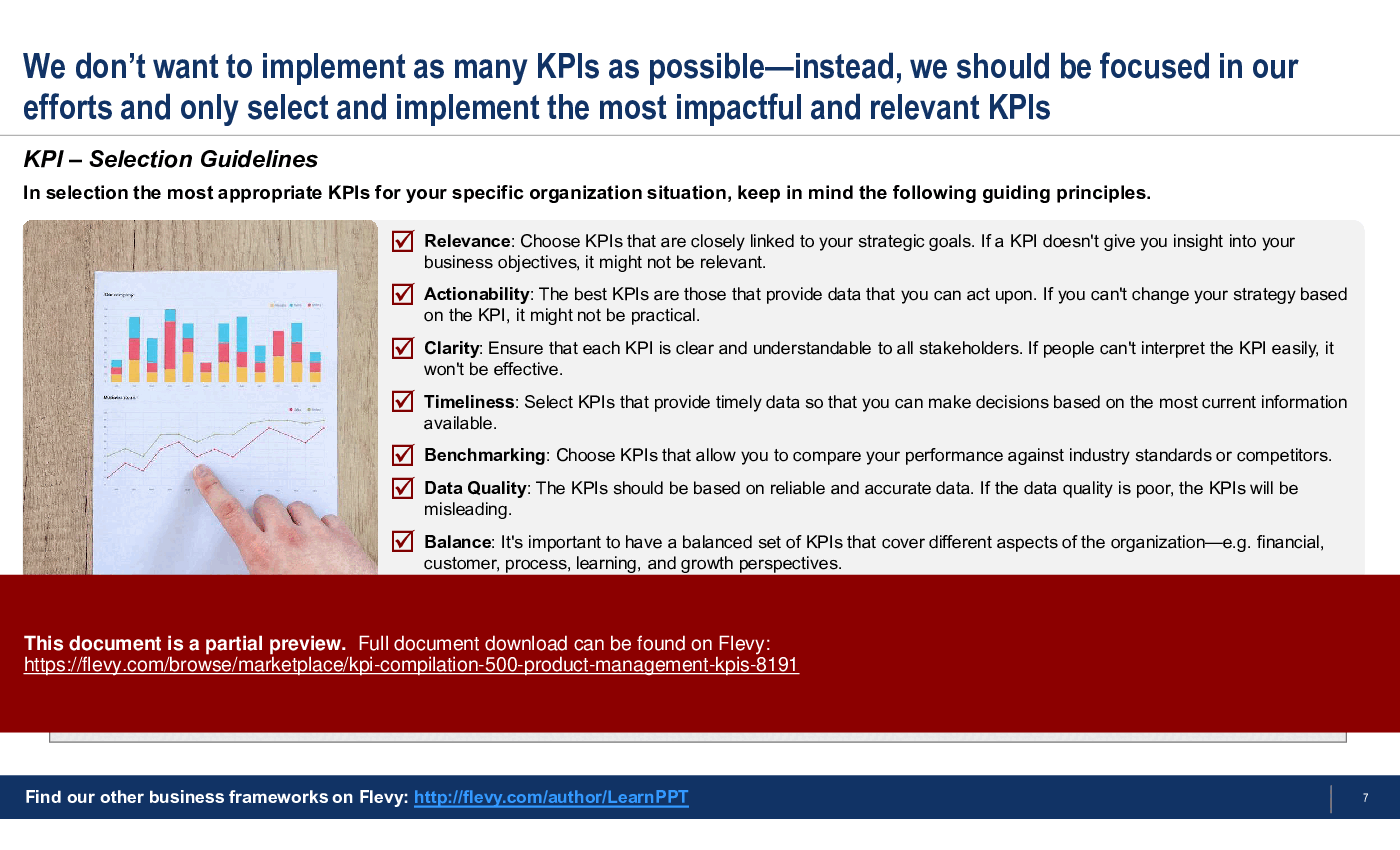
This presentation also includes an introduction on KPIs, covering topics like KPI selection guidelines and common usages.
Got a question about the product? Email us at support@flevy.com or ask the author directly by using the "Ask the Author a Question" form. If you cannot view the preview above this document description, go here to view the large preview instead.
This PPT slide presents a framework for assessing key performance indicators (KPIs) related to technical writing within the context of innovation management. It outlines several specific KPIs, each accompanied by a description, potential insights, measurement methods, and formulas for calculation.
The first KPI, "Average Document Length," gauges the average number of pages or sections per document. This metric is crucial as it indicates the complexity of the documentation and its potential impact on user engagement. Longer documents may provide more detailed information, but could also deter users due to their length.
Next, "Average Reading Time" measures the time users spend on a piece of technical documentation. This metric highlights user commitment and can inform strategies for optimizing content delivery to align with user time constraints.
The "Collaboration Effectiveness Index" assesses how well technical writers work with subject matter experts and other stakeholders. This KPI is vital for evaluating the efficiency of the documentation collaboration process, which can directly affect the quality of the output.
"Content Accuracy Rate" and "Content Coverage" focus on the reliability and comprehensiveness of the technical documentation. The former measures the percentage of content verified as accurate, while the latter evaluates how much of the product's features are documented. Both metrics are essential for ensuring that users receive trustworthy and complete information.
Lastly, "Content Lifecycle Management" examines the efficiency of managing technical content throughout its lifecycle. This KPI helps identify areas for improvement in processes related to content creation, maintenance, and retirement.
Overall, these KPIs provide a structured approach to enhancing technical writing, ensuring clarity, user engagement, and accuracy in conveying technical information.
This PPT slide presents key performance indicators (KPIs) focused on product quality control within the broader context of innovation management. It outlines several metrics essential for evaluating product quality consistency, compliance with standards, and customer feedback. Each KPI is accompanied by a description, potential insights, measurement methods, and formulas for calculation.
The "Average Product Life Cycle" KPI assesses how long a product remains relevant before it becomes obsolete. This metric can guide lifecycle management strategies by revealing product longevity and market relevance. "Batch Quality Consistency" measures the stability of production processes across different batches, which is crucial for maintaining customer satisfaction and ensuring uniformity in quality.
"Corrective Action Effectiveness" evaluates how well the quality control system addresses issues, focusing on the success rate of resolving detected quality problems. This is vital for continuous improvement and preventing recurrence of similar issues. The "Cost of Quality" KPI provides insights into the financial implications of maintaining product quality, encompassing costs associated with prevention, appraisal, and failure.
"Critical to Quality (CTQ) Attributes" identifies specific characteristics that are essential for customer satisfaction, helping organizations prioritize areas for improvement. Lastly, the "Customer Complaints" metric quantifies customer dissatisfaction by comparing complaints to total sales, offering a clear view of product performance from the customer's perspective.
This slide serves as a comprehensive overview of essential KPIs that can drive improvements in product quality and customer satisfaction, making it a valuable resource for executives looking to enhance their product management strategies.
This PPT slide presents a series of Key Performance Indicators (KPIs) specifically focused on User Experience (UX) Design. It outlines various metrics that are critical for assessing how effectively a product engages users and meets their needs. Each KPI is accompanied by a brief description, potential insights, measurement methods, and formulas for calculation.
The first KPI, A/B Testing Conversion Rate, compares different versions of a webpage to evaluate which one drives higher user conversion. This metric is essential for understanding user preferences and optimizing design elements. Following this, the Abandonment Rate highlights the percentage of users who start, but do not complete a task, indicating areas where the user journey may falter.
Accessibility Score is another key metric, measuring how well a product accommodates users with disabilities. This is crucial for compliance and user satisfaction. The Adoption Rate assesses how many new users engage with a product or feature, providing insights into its initial appeal.
Average Handle Time (AHT) reflects the efficiency of user interactions, offering a glimpse into customer support effectiveness. Bounce Rate measures how many visitors leave a site after viewing only one page, indicating the effectiveness of landing pages and initial user engagement.
Overall, these KPIs collectively provide a comprehensive framework for evaluating user interaction, satisfaction, and engagement with a product. They serve as vital tools for organizations looking to enhance their UX design strategy and improve overall product performance. By focusing on these metrics, businesses can gain actionable insights that drive user-centric improvements and foster better engagement.
This PPT slide presents a framework for evaluating the effectiveness of Product Management strategies through various Key Performance Indicators (KPIs). It categorizes these KPIs into several critical areas, including user engagement, revenue generation, customer retention, and competitive positioning. Each KPI is accompanied by a description, potential insights, measurement methods, and formulas for calculation.
The first KPI, "Active Users," measures the number of unique users interacting with the product over a specified timeframe. This metric is vital for understanding user engagement levels and assessing the product's market reach. The "Average Revenue Per User (ARPU)" follows, providing insights into the revenue generated per active user, which is crucial for pricing strategies and revenue forecasting.
Next is the "Churn Rate," which indicates customer retention by measuring the percentage of users who discontinue their subscriptions. This metric is essential for evaluating long-term product viability. The "Competitive Analysis" KPI assesses the product's performance against competitors, focusing on market share and pricing, which helps in strategic positioning.
The "Conversion Rate" measures the effectiveness of marketing efforts by calculating the percentage of users taking a desired action, such as making a purchase. Lastly, "Cost of Goods Sold" evaluates the direct costs associated with product production, informing pricing and profitability strategies.
This structured approach to KPIs allows organizations to gain comprehensive insights into their product management effectiveness, ultimately aligning product performance with broader business objectives. The clarity and organization of the slide make it a valuable resource for executives looking to enhance their product management practices.
This PPT slide presents a collection of Key Performance Indicators (KPIs) specifically focused on the Product Development process. It highlights various metrics that are essential for assessing efficiency, creativity, and productivity within this domain. Each KPI is accompanied by a description, potential insights, measurement methods, and formulas for calculation.
The first KPI, "Agile Metrics," evaluates the performance of development teams using agile methodologies. It provides insights into the effectiveness of agile practices, such as sprint burndown charts and velocity, which are crucial for understanding team dynamics and project progress.
Next, "Annual Contract Value Growth" measures the growth rate of contracts signed for a product. This metric is vital for assessing sales performance and market acceptance, indicating how well the product is being received by customers.
"Beta Testing Coverage" assesses the thoroughness of beta testing by measuring user engagement and feedback. This KPI is significant for identifying potential risks before a product's official release, ensuring that any issues can be addressed proactively.
The "Code Deployment Success Rate" tracks the reliability of code deployments to production environments. A high success rate indicates a stable deployment process, which is essential for maintaining operational integrity.
"Code Quality Index" evaluates the quality of code produced, focusing on maintainability and adherence to standards. This metric is crucial for ensuring long-term sustainability and efficiency of the codebase.
Lastly, "Cost per Feature" provides insights into the financial aspects of product development, helping organizations evaluate efficiency and budget allocation for feature development.
Overall, this slide serves as a comprehensive guide for organizations looking to enhance their product development processes through targeted metrics. It emphasizes the importance of measuring various aspects of development to drive improvements and achieve strategic goals.
This PPT slide presents a structured overview of key performance indicators (KPIs) specifically tailored for evaluating customer support operations. It emphasizes metrics that directly influence customer satisfaction, response times, and issue resolution success rates. Each KPI is accompanied by a brief description, potential insights, measurement methods, and formulas for calculation.
The first KPI, "Agent Satisfaction Score," gauges how content support agents are with their work environment and tools. This metric is crucial as it can directly affect the quality of customer service provided. The insights derived from this score can inform management about agent morale and areas needing improvement.
Next, "Agent Schedule Adherence" measures how well agents stick to their scheduled work times. This adherence is vital for maintaining staffing efficiency and service predictability. The insights here can help in workforce management and planning.
The "Agent Turnover Rate" is another critical metric, indicating how frequently agents leave the organization. High turnover can disrupt service continuity and may signal underlying issues in job satisfaction or training effectiveness.
"Agent Utilization Rate" assesses the percentage of time agents are actively engaged with customer inquiries, which highlights staffing efficiency. This can lead to better resource allocation.
The slide also covers "Average After-Call Work Time" and "Average Handle Time." These metrics provide insights into the complexity of customer interactions and identify potential areas for process improvement. Understanding these times can help streamline operations and enhance overall service delivery.
Overall, this slide serves as a foundational tool for organizations aiming to enhance their customer support effectiveness through data-driven insights.
This collection of Innovation KPIs is compiled by former McKinsey, BCG, Deloitte, EY, and Capgemini consultants based on best practices in Product Management.
We are a team of management consultants trained by top tier global consulting firms (including McKinsey, BCG, Deloitte, EY, Capgemini) with a collective experience of several decades. We specialize in business frameworks based on real-life consulting engagements.
We have served 100s of clients that range from Fortune 500 companies to tech startups to
... [read more] $1B+ private companies.
Utilize our consulting frameworks to apply structured thinking & analysis to address your business challenges, uncover strategic insights, and implement workable solutions. Our PowerPoint presentations follow traditional consulting slide design formats, starting with a clear slide headline. Easily customize and repurpose our slides for your own business presentations.
Beyond business frameworks & methodologies, we also offer PowerPoint templates and other business templates. Our templates are professionally designed and have been used in thousands of deliverables & work products across hundreds of clients.
Since 2012, we have provided best practices to over 10,000 businesses and organizations of all sizes, from startups and small businesses to the Fortune 100, in over 130 countries.
Read Customer Testimonials
"As a niche strategic consulting firm, Flevy and FlevyPro frameworks and documents are an on-going reference to help us structure our findings and recommendations to our clients as well as improve their clarity, strength, and visual power. For us, it is an invaluable resource to increase our impact and value."
– David Coloma, Consulting Area Manager at Cynertia Consulting
"As an Independent Management Consultant, I find Flevy to add great value as a source of best practices, templates and information on new trends. Flevy has matured and the quality and quantity of the library is excellent. Lastly the price charged is reasonable, creating a win-win value for
the customer, Flevy and the various authors. This is truly a service that benefits the consulting industry and associated clients. Thanks for providing this service.
"
– Jim Schoen, Principal at FRC Group
"My FlevyPro subscription provides me with the most popular frameworks and decks in demand in today’s market. They not only augment my existing consulting and coaching offerings and delivery, but also keep me abreast of the latest trends, inspire new products and service offerings for my practice, and educate me
in a fraction of the time and money of other solutions. I strongly recommend FlevyPro to any consultant serious about success.
"
– Bill Branson, Founder at Strategic Business Architects
"The wide selection of frameworks is very useful to me as an independent consultant. In fact, it rivals what I had at my disposal at Big 4 Consulting firms in terms of efficacy and organization."
– Julia T., Consulting Firm Owner (Former Manager at Deloitte and Capgemini)
"As a small business owner, the resource material available from FlevyPro has proven to be invaluable. The ability to search for material on demand based our project events and client requirements was great for me and proved very beneficial to my clients. Importantly, being able to easily edit and tailor
the material for specific purposes helped us to make presentations, knowledge sharing, and toolkit development, which formed part of the overall program collateral. While FlevyPro contains resource material that any consultancy, project or delivery firm must have, it is an essential part of a small firm or independent consultant's toolbox.
"
– Michael Duff, Managing Director at Change Strategy (UK)
"I have found Flevy to be an amazing resource and library of useful presentations for lean sigma, change management and so many other topics. This has reduced the time I need to spend on preparing for my performance consultation. The library is easily accessible and updates are regularly provided. A wealth of great information."
– Cynthia Howard RN, PhD, Executive Coach at Ei Leadership
"Flevy is our 'go to' resource for management material, at an affordable cost. The Flevy library is comprehensive and the content deep, and typically provides a great foundation for us to further develop and tailor our own service offer."
– Chris McCann, Founder at Resilient.World
"If you are looking for great resources to save time with your business presentations, Flevy is truly a value-added resource. Flevy has done all the work for you and we will continue to utilize Flevy as a source to extract up-to-date information and data for our virtual and onsite presentations!"
– Debbi Saffo, President at The NiKhar Group
Save with Bundles
This document is available as part of the following discounted bundle(s):
Download our free compilation of 50+ Strategy & Transformation slides and templates. Frameworks include McKinsey 7-S, Balanced Scorecard, Disruptive Innovation, BCG Curve, and many more.