
 Click main image to view in full screen. Unlock all 9 preview images:
Independent Pharmacy Acquisition Underwriting Model – Excel XLSX
Excel (XLSX) + supplemental PDF


BENEFITS OF THIS DOWNLOADABLE EXCEL DOCUMENT
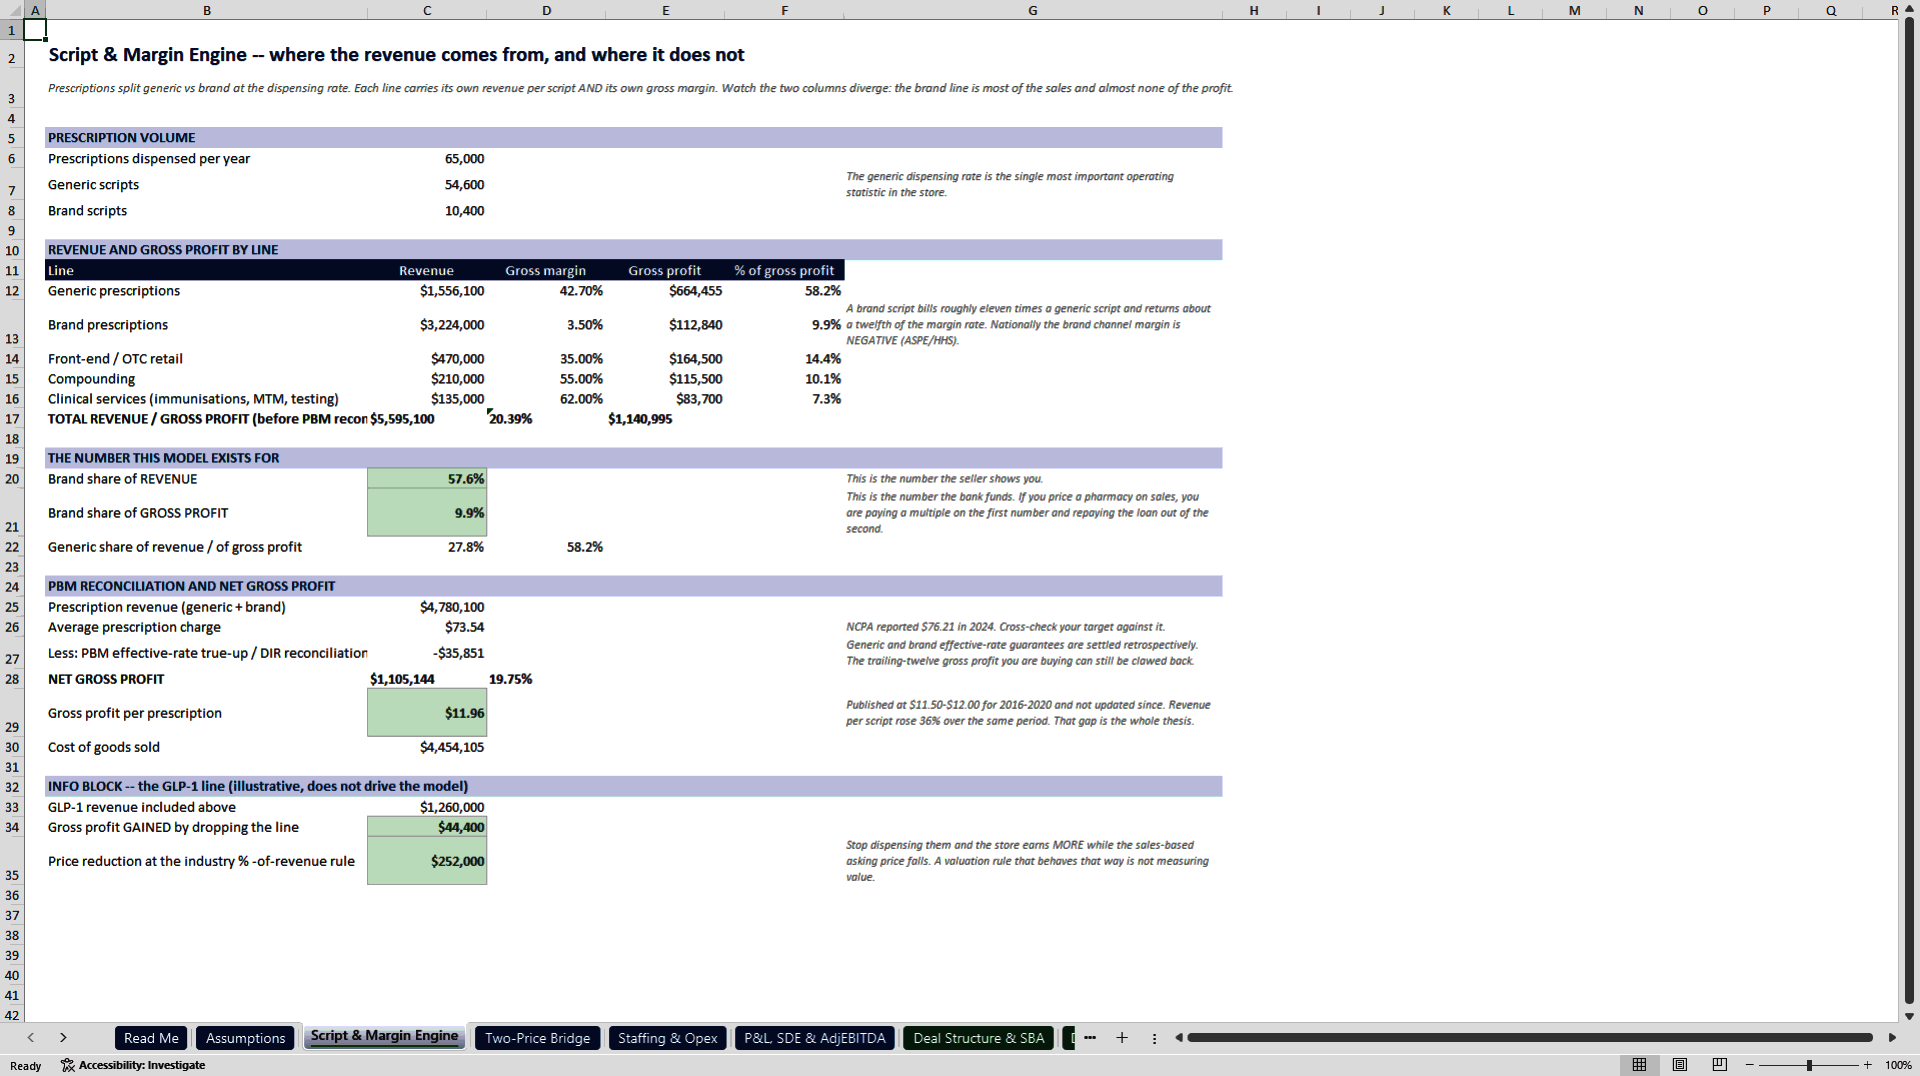
- Builds gross profit script by script from the generic-versus-brand mix and reconciles PBM effective rates and DIR, so you see the 57.6% of sales that produces 9.9% of the margin.
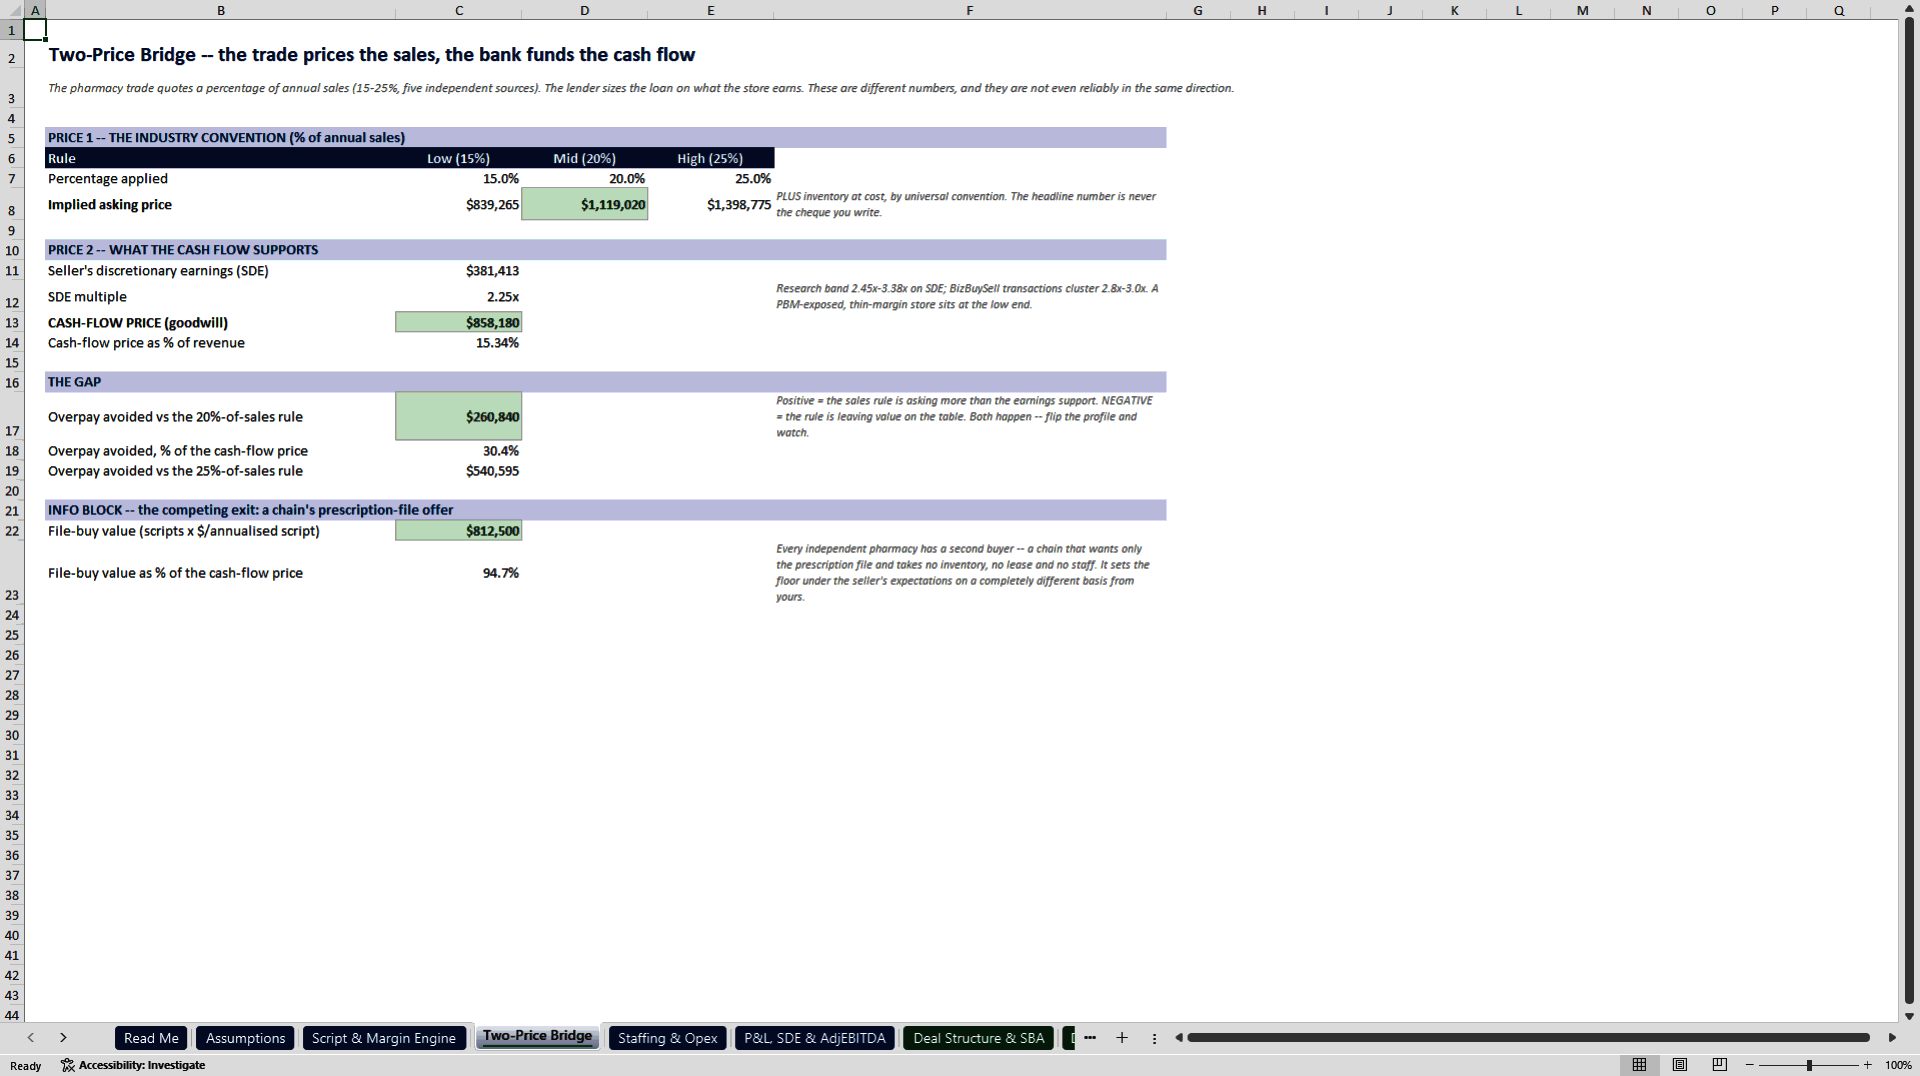
- Puts the cash-flow price of $858,180 beside the 20%-of-sales convention price of $1,119,020 and quantifies the $260,840 of overpay you avoid.
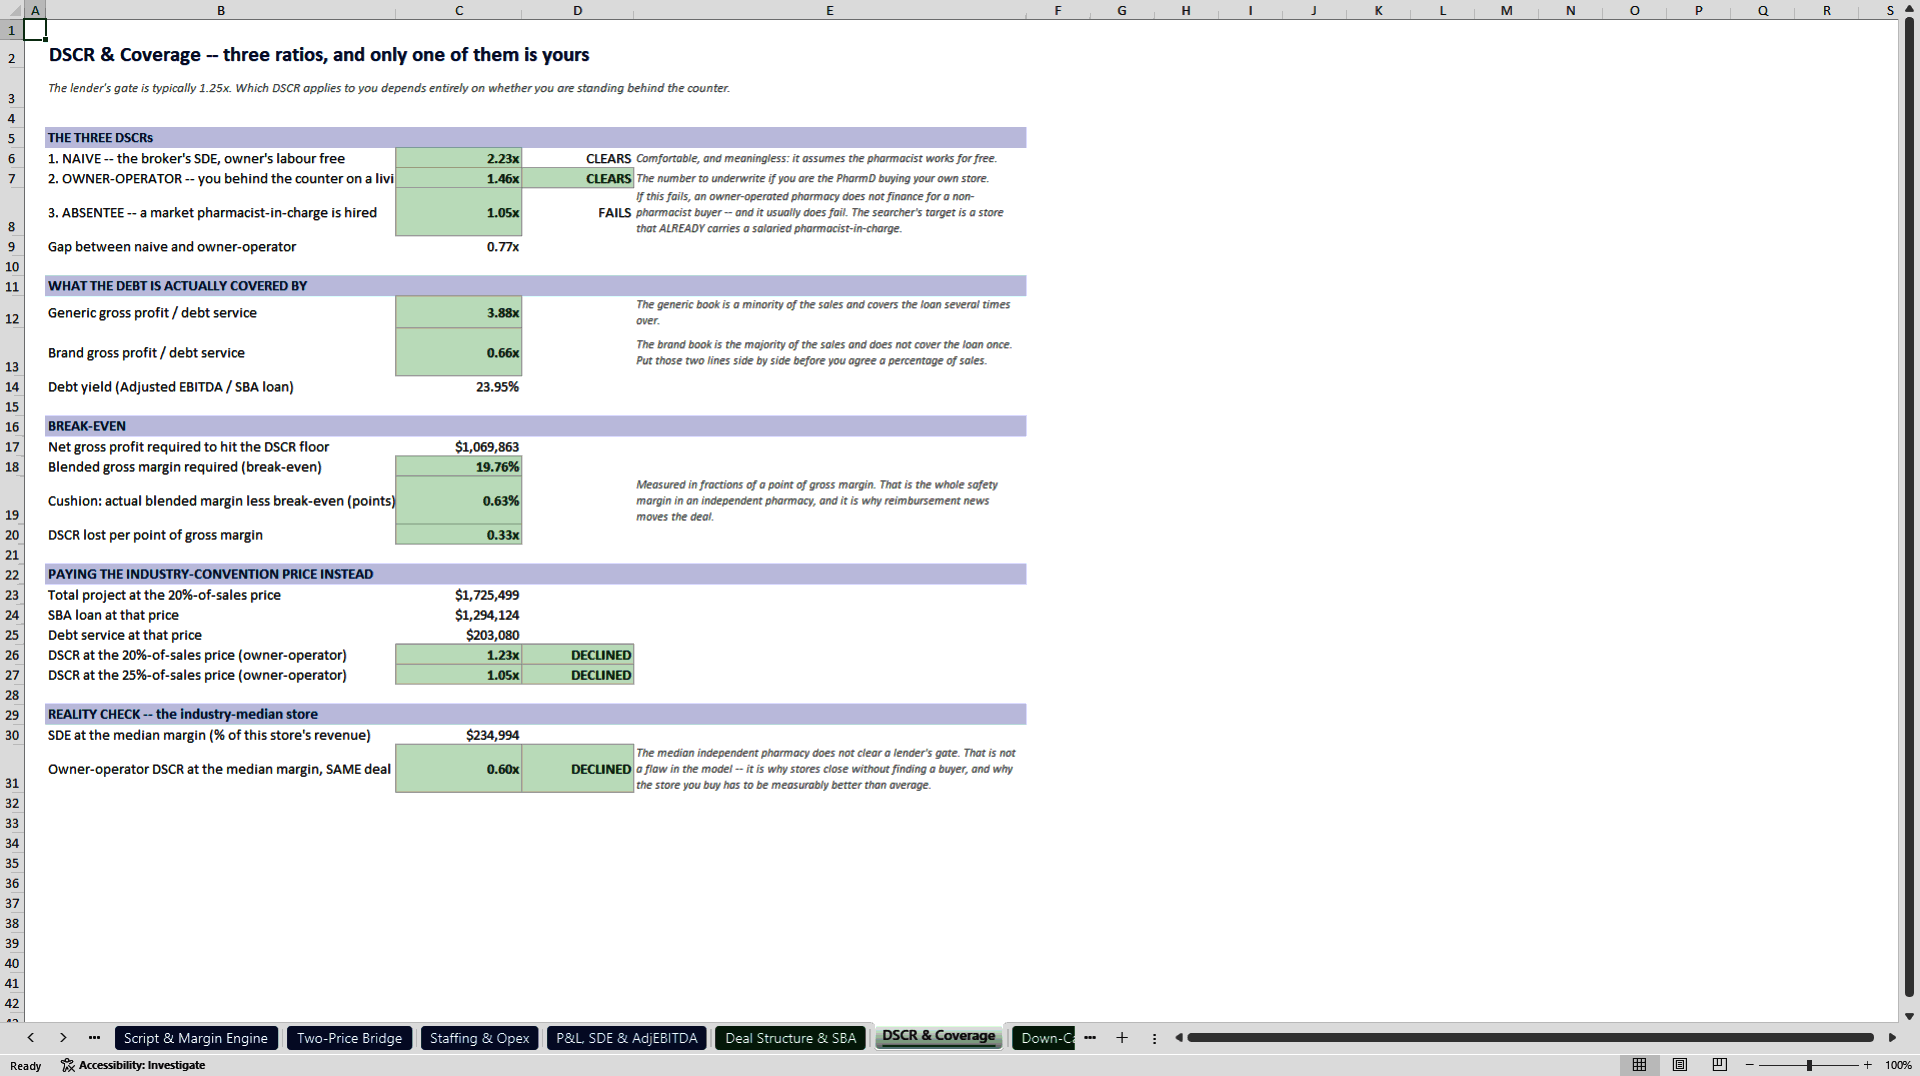
- Reports coverage three ways on the same deal, naive at 2.2265x, owner-operator at 1.4560x and absentee at 1.0521x, so you can see which buyer the deal actually finances.
INTEGRATED FINANCIAL MODEL EXCEL DESCRIPTION
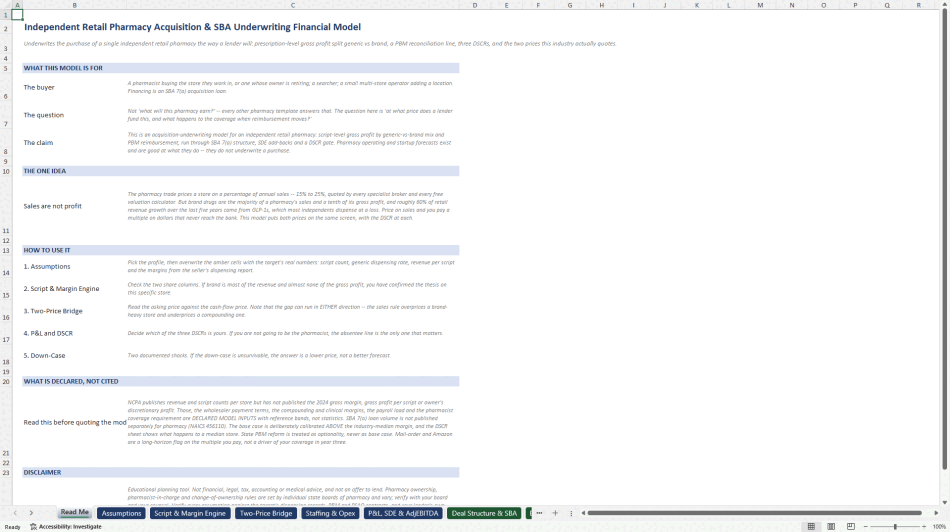
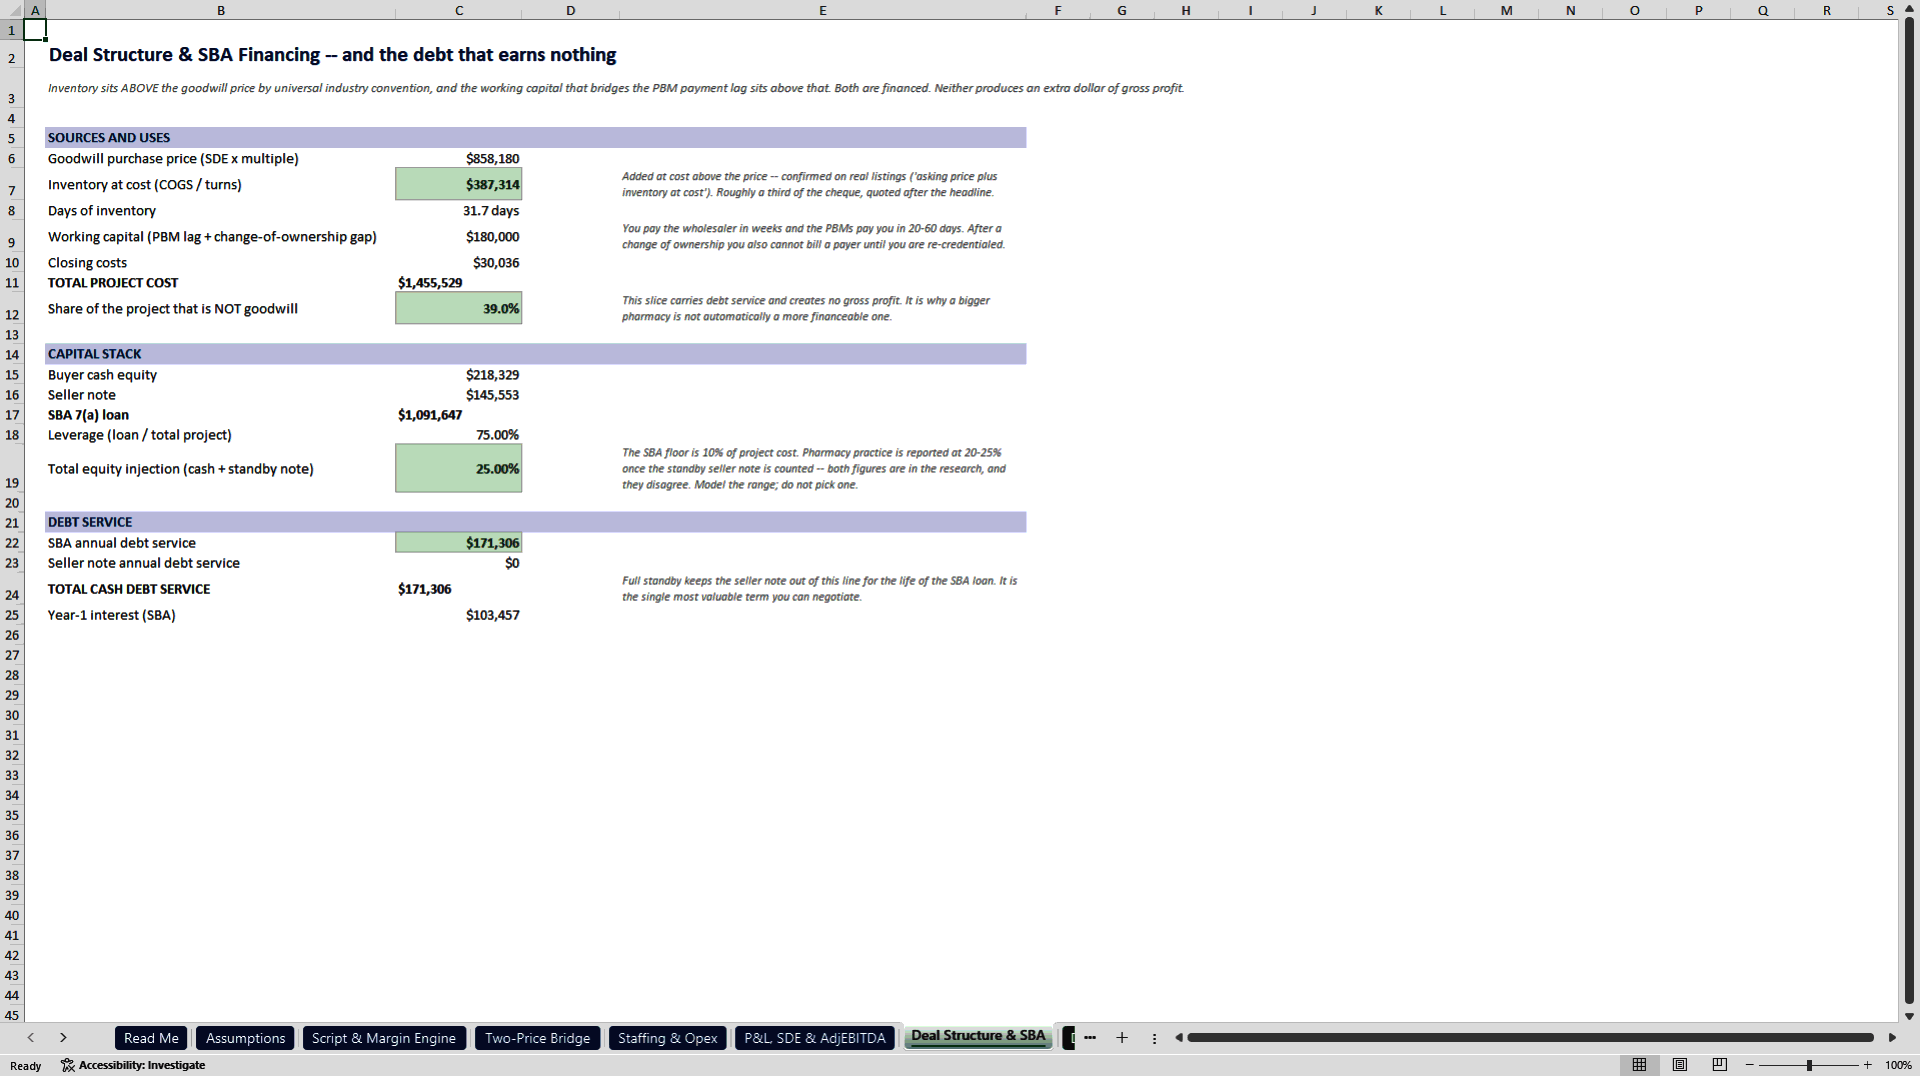
Every pharmacy template on the market forecasts a startup. This one underwrites a purchase. It is built for the buyer of an independent retail pharmacy using an SBA 7(a) loan, and for the advisor or lender testing the price.
The valuation error it intercepts is the sector convention itself. Independent pharmacies are commonly priced as a percentage of annual sales, in the range of 15 to 25%. But pharmacy revenue is a poisoned number: a brand prescription bills roughly eleven times a generic and earns roughly one twelfth of the margin rate. On the base case brand drugs are 57.62% of revenue and only 9.89% of gross profit, while generics are 27.81% of revenue and 58.23% of gross profit. The asking price is a percentage of the first number. The loan is repaid out of the second.
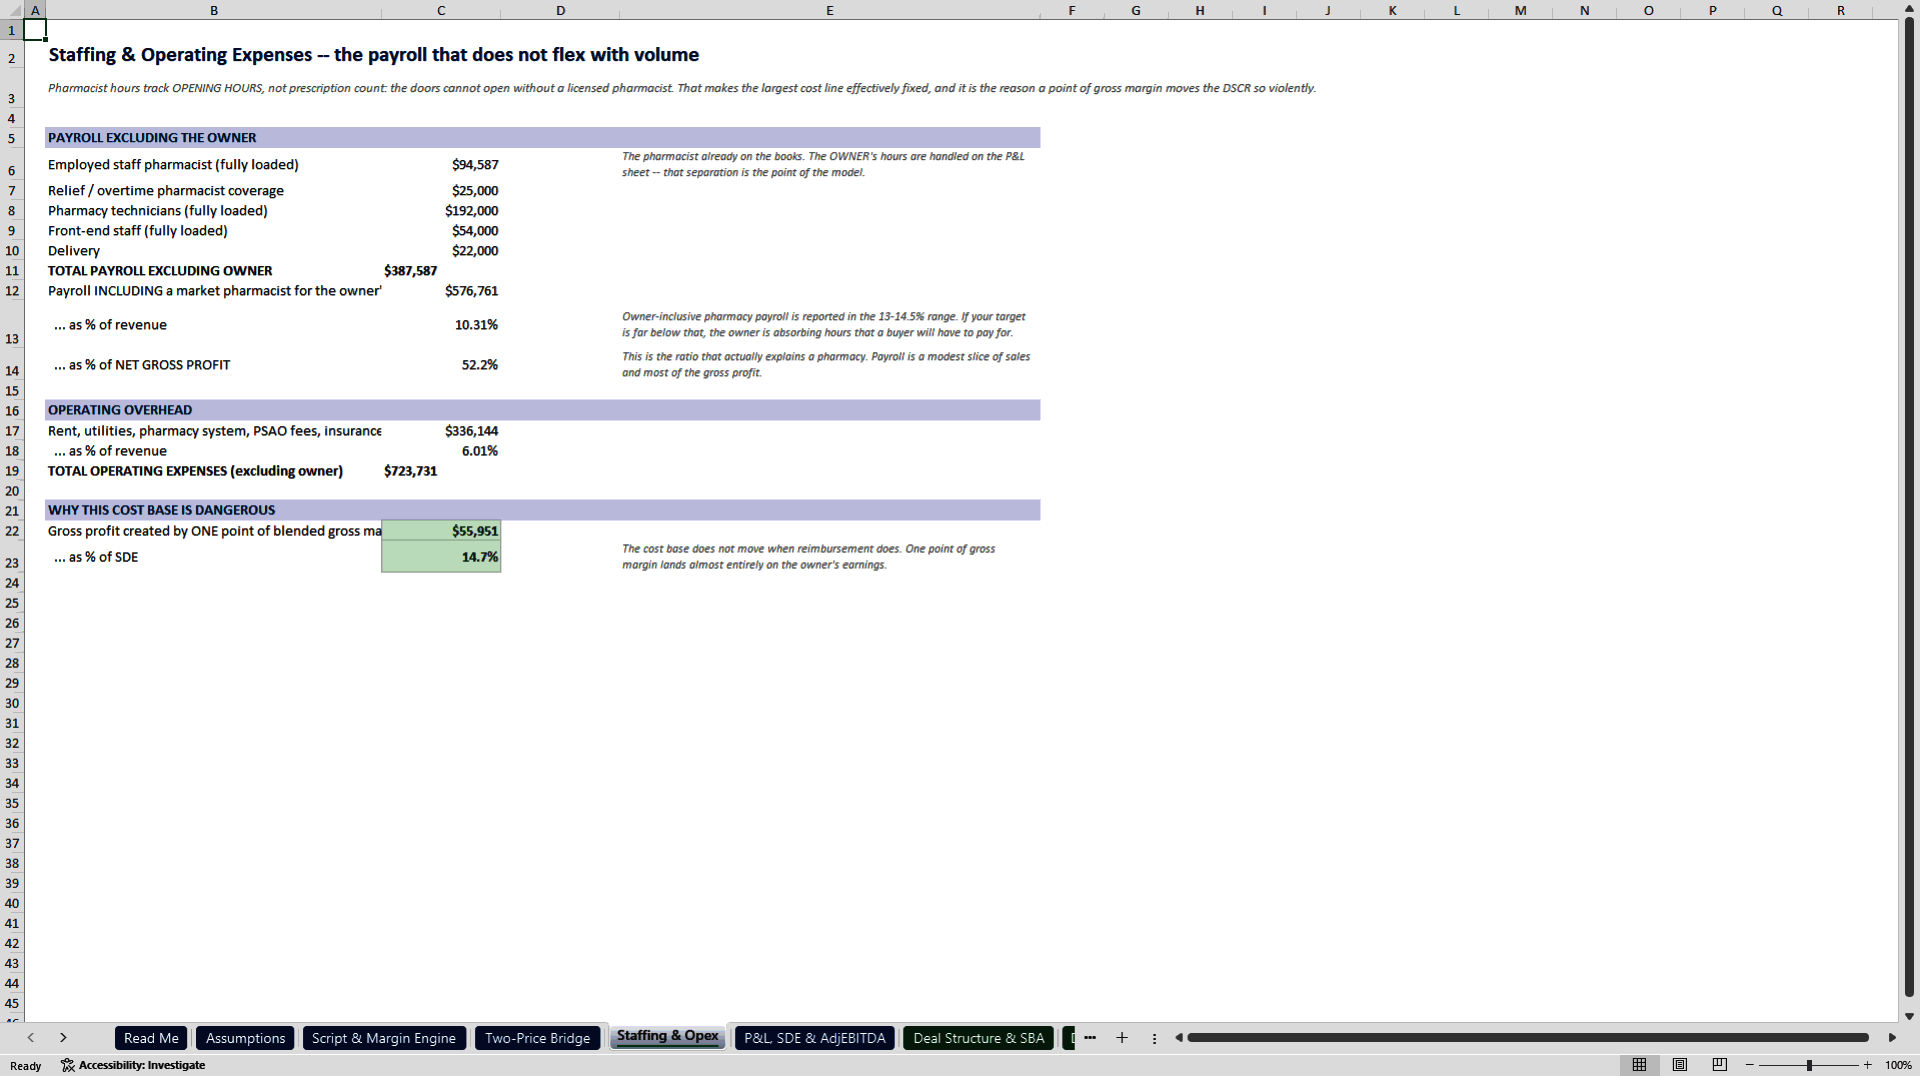
The engine is script-level. 65,000 prescriptions a year at an 84% generic dispensing rate split into 54,600 generic scripts at a 42.7% margin and 10,400 brand scripts at a 3.5% margin, plus front-end, compounding and clinical lines. Total revenue of $5,595,100 produces $1,140,995 of gross profit, and a PBM effective-rate and DIR reconciliation of minus $35,851 brings it to $1,105,144, or 19.75%. Gross profit per script is $11.96 against an average charge of $73.54. SDE is $381,413, which is 6.82% of revenue but 34.51% of net gross profit, and it is the second ratio that means anything.
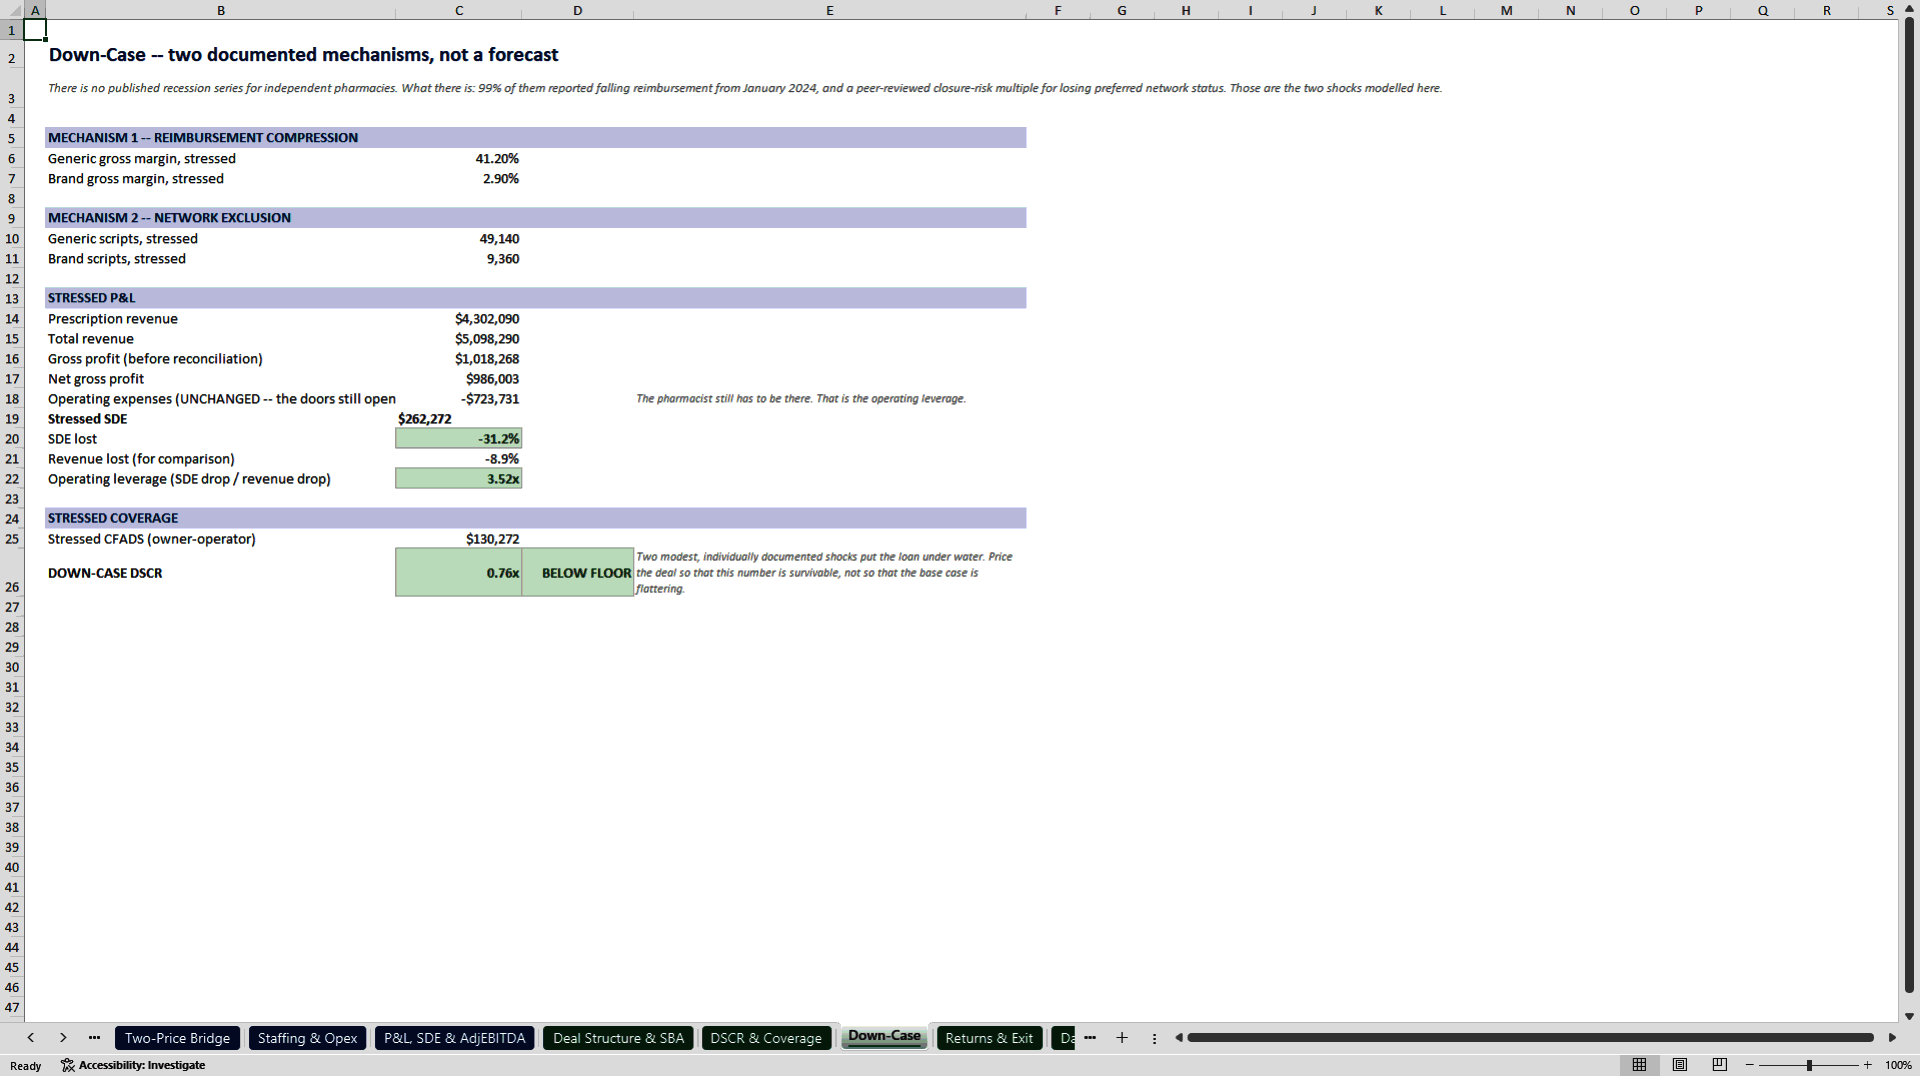
The two-price bridge is the heart of the model. A cash-flow price at 2.25x SDE is $858,180, or 15.34% of sales. The industry-convention price at 20% of sales is $1,119,020. The difference, $260,840 or 30.4%, is the overpay you avoid. At the convention price coverage falls to 1.2282x and the deal is declined; at 25% of sales it is 1.0517x. Coverage is shown three ways on the cash-flow price: naive 2.2265x, owner-operator 1.4560x, and absentee 1.0521x, which fails. The down-case reads 0.7605x. Generic gross profit covers debt service 3.879x while brand gross profit covers only 0.659x, and the break-even blended gross margin leaves a cushion of 0.63 points, with 0.327x of coverage lost per point of margin.
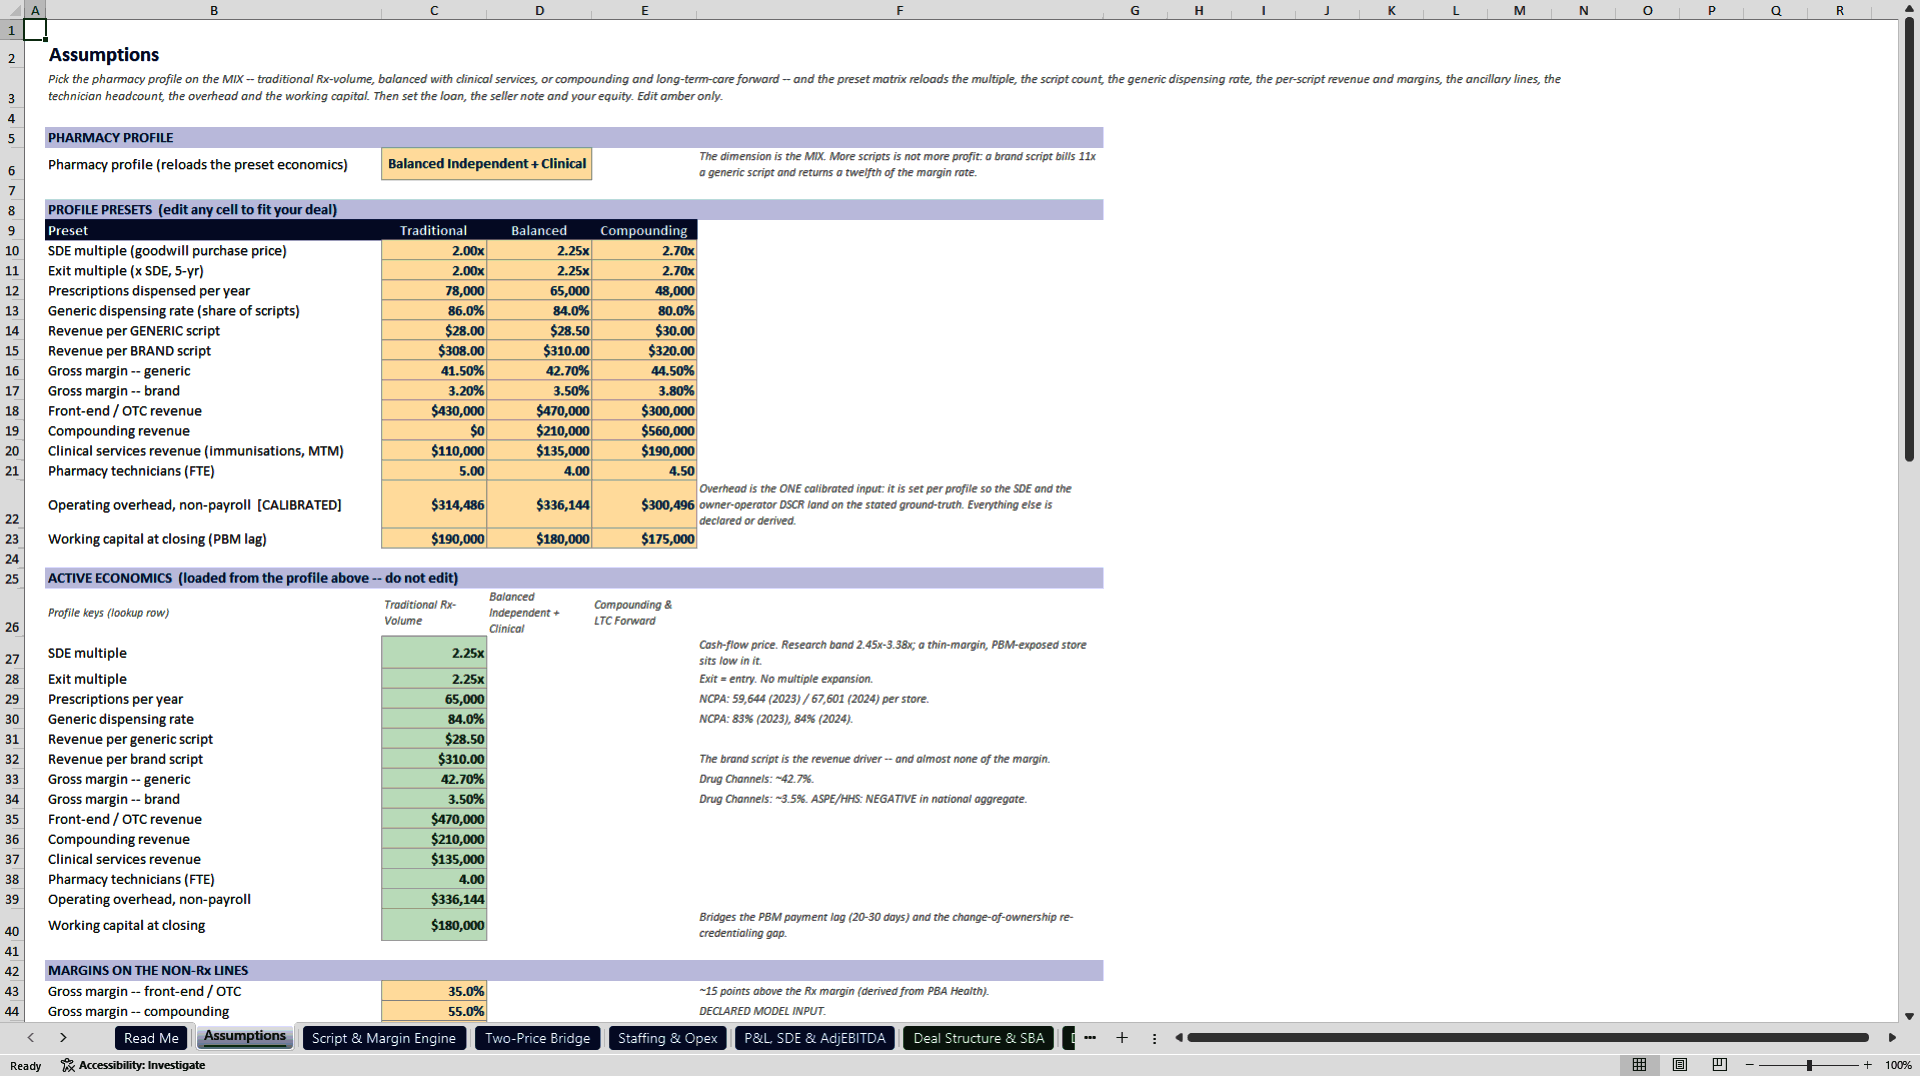
Three profiles run on one toggle, traditional Rx-volume, balanced independent with clinical, and compounding and LTC forward. Two of them overpay against the 20%-of-sales convention and one underpays, which is the point: the same rule of thumb errs in both directions.
Eleven sheets, Google Sheets compatible, no macros, with a PDF guide whose numbers are read live from the model. IRR is deliberately not calculated. The model does not claim to be the first pharmacy financial model, nor that no template models reimbursement; it claims that no existing template breaks reimbursement into generic-versus-brand margin per script. Educational planning tool, not financial, legal, tax or investment advice.
Got a question about the product? Email us at support@flevy.com or ask the author directly by using the "Ask the Author a Question" form. If you cannot view the preview above this document description, go here to view the large preview instead.
Source: Best Practices in Integrated Financial Model Excel: Independent Pharmacy Acquisition Underwriting Model Excel (XLSX) Spreadsheet, ProformaWorks
ABOUT THE AUTHOR
ProformaWorks builds acquisition-grade financial models for Main Street and lower-middle-market businesses - the kind of deal financed with an SBA 7(a) loan or a small commercial facility.
Every model answers one question: does this deal pencil at the bank? That means SDE or NOI rebuilt from the seller's own numbers, the add-backs a lender will and will not accept, a debt-service
... [read more]
Ask the Author a Question
You must be logged in to contact the author.




























