

FinTech Business 10-Year 3 Statement Financial Model – Excel XLSX
Excel (XLSX)
BENEFITS OF THIS DOWNLOADABLE EXCEL DOCUMENT
- Delivers a comprehensive framework for building an investor-ready FinTech financial model tailored to your startup's growth strategy.
- Equips you with a structured system to analyze unit economics, forecast performance, and stress-test assumptions with institutional-grade precision.
- Empowers your team to develop a board-ready, fully integrated 3-statement model designed to support fundraising, lending, and strategic decision-making.
FINTECH EXCEL DESCRIPTION
Curated by McKinsey-trained Executives
💳 FinTech Startup Financial Model – 10-Year Forecast
The Ultimate Excel Financial Model for FinTech Founders, Operators & Investors
Stop burning runway guessing your unit economics. Stop paying $25,000 for a Big Four consultant to build what you can own forever.
If you're launching, scaling, or financing a FinTech startup, your financial model is NOT a spreadsheet.
It's your #1 fundraising weapon. Your Series A armor. Your term sheet accelerator.
And this model gives you – fully built and formula-verified – exactly what VCs, growth equity firms, and fintech lenders demand to see before wiring a single dollar.
💼 What You Get
✅ 14 Fully Linked Excel Worksheets
✅ 1,974+ Active, Verified Excel Formulas
✅ 10-Year Annual Forecast (Year 1 – Year 10)
✅ Complete 3-Statement Model: Income Statement, Balance Sheet & Cash Flow
✅ 15 Separate Revenue Streams Built Entirely from Operational Drivers
✅ Full User Acquisition, Cohort Retention & Churn Model
✅ CAC, LTV & LTV/CAC Ratio Calculated for Every Year
✅ Sensitivity Analysis, 5-Scenario Comparison & EBITDA Stress Tables
✅ Executive Dashboard with 16 KPI Cards & Full 10-Year Trend Charts
✅ 80+ Blue-Coded Assumption Inputs – Change One Cell, Everything Updates
✅ Zero Formula Errors – Verified by Automated Recalculation Scan Across All 1,974 Formulas
✅ Works in Microsoft Excel & Google Sheets
This is not a generic SaaS template with a FinTech label slapped on it.
This is a complete, FinTech-specific financial modeling system – built from the ground up around payment volume, interchange economics, subscription tiers, lending spreads, regulatory capital, and cohort-based user retention.
🎯 Who This Is For
• FinTech founders raising Pre-Seed, Seed, Series A, or Series B capital
• Payments, BNPL, neobank, and embedded finance startups preparing investor-ready models
• Private equity firms and growth equity investors underwriting FinTech platform acquisitions
• Venture capital analysts building bottoms-up gross transaction volume and take rate models
• FinTech operators building board-ready annual operating plans and OKR frameworks
• Lending and BNPL startups modeling loan book growth, interest spread, and default provisions
• Consumer finance founders quantifying LTV/CAC and cohort-level payback periods
• FP&A analysts and fractional CFOs serving early and growth-stage FinTech clients
• Investment bankers and M&A advisors representing FinTech sell-side mandates
• MBA and CFA candidates learning institutional-grade FinTech financial modeling
If you build, fund, operate, or analyze a FinTech business – this model was engineered specifically for you.
🔥 Why Most FinTech Financial Models Fail
Generic templates focus on:
• Simple revenue = last year × a growth percentage – no operational drivers whatsoever
• No concept of gross transaction volume, take rates, or payment processing economics
• No user funnel: no acquisition, no activation rate, no monthly churn, no cohort retention
• No CAC tracking, no LTV calculation, no LTV/CAC ratio – the metrics every FinTech investor asks first
• No subscription tier modeling: no Free, Pro, or Enterprise tier dynamics
• No interchange revenue, FX spread, float income, or BNPL revenue lines
• No lending model: no loan book roll-forward, no interest spread, no loan loss provisions
• No regulatory capital requirements, no KYC/AML cost modeling
• No working capital mechanics specific to FinTech: no deferred revenue, no customer deposits
• No headcount plan by role – just a single salary line that grows at an arbitrary percentage
This model fixes every single one of those failures – from the ground up.
📚 What's Inside – Every Tab, Every Formula
Tab 1: Dashboard
• 16 auto-updating KPI cards: Total Revenue, Gross Profit, EBITDA, Net Income, Cash Balance, Gross Margin %, EBITDA Margin %, Net Margin %, CAC, LTV, LTV/CAC Ratio, Active Users, Paying Users, GTV, ARPU, and Revenue per Employee
• Full 10-year financial summary table spanning all critical P&L, cash flow, and user metrics
• 6 embedded trend charts: Revenue Growth, EBITDA & Net Income, Active User Growth, Cash Balance, Gross Margin %, and Headcount – all formula-driven, zero manual entry
• Color-scale conditional formatting alerts: negative EBITDA highlighted automatically, cash balance deterioration flagged in real time
• Designed for investor presentations, board reporting, Series A data rooms, and lender packages
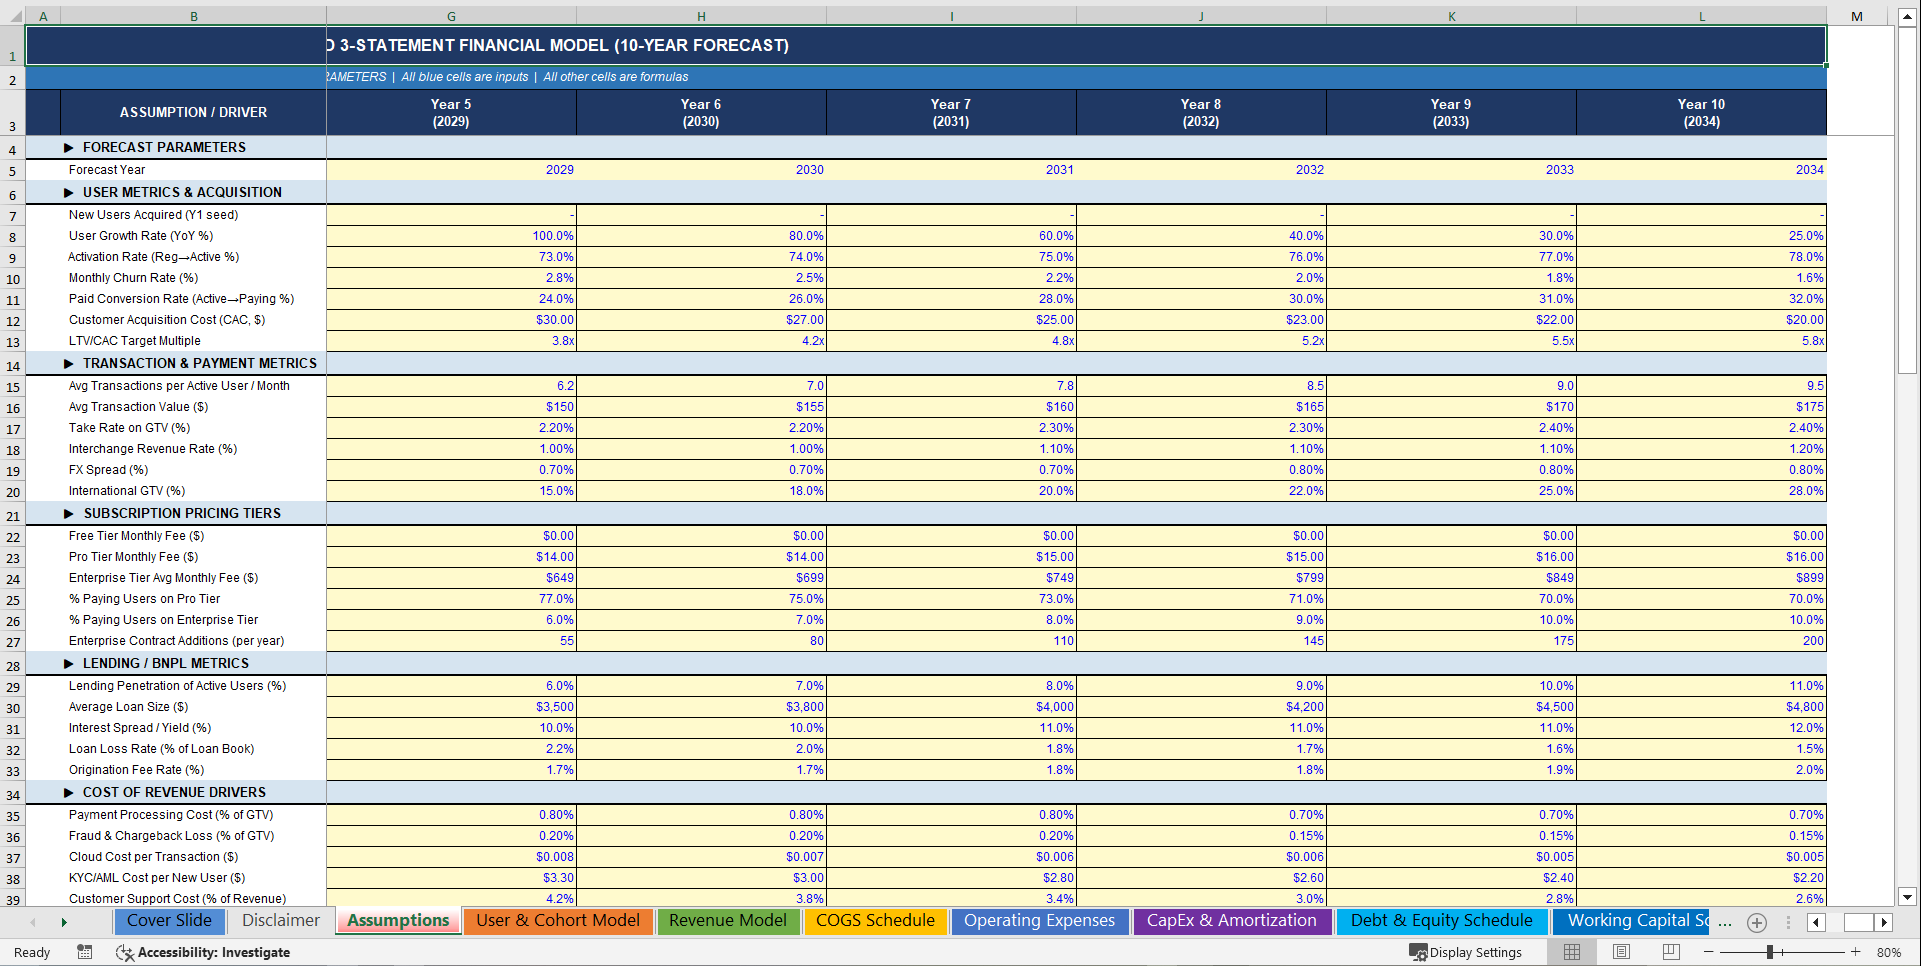
Tab 2: Assumptions
• 80+ blue-coded input cells – the single source of truth controlling every formula in the model
• Section 1 – User Metrics & Acquisition: starting user base, user growth rate, activation rate, monthly churn rate, paid conversion rate, CAC, and LTV/CAC target multiple
• Section 2 – Transaction & Payment Metrics: average transactions per active user per month, average transaction value, take rate on GTV, interchange revenue rate, FX spread, international GTV percentage
• Section 3 – Subscription Pricing Tiers: Free tier, Pro tier monthly fee, Enterprise tier average monthly fee, percentage of users on each tier, enterprise contract additions per year
• Section 4 – Lending / BNPL Metrics: lending penetration rate, average loan size, interest spread, loan loss rate, origination fee rate
• Section 5 – Cost of Revenue Drivers: payment processing cost as % of GTV, fraud and chargeback loss rate, cloud cost per transaction, KYC/AML cost per new user, customer support cost %, partner revenue share %
• Section 6 – Operating Expense Assumptions: R&D/technology %, sales and marketing %, G&A %, stock-based compensation %, annual raise %
• Section 7 – Headcount Plan by Role: CEO, CTO, CFO, Engineering, Product, Sales, Marketing, Compliance, Support, Operations – salary and headcount for every year, with payroll tax, benefits, and bonus baked in
• Section 8 – CapEx & Depreciation: total CapEx as % of revenue, capitalized software %, PP&E %, software useful life, PP&E useful life, regulatory capital deposit %
• Section 9 – Working Capital: DSO, DPO, deferred revenue months, customer deposit % of GTV
• Section 10 – Financing: equity raised by year, venture debt issuance, interest rate, debt repayment schedule, convertible note balance, beginning cash
• Section 11 – Tax & Other: corporate tax rate, NOL carryforward, WACC, inflation, float income yield
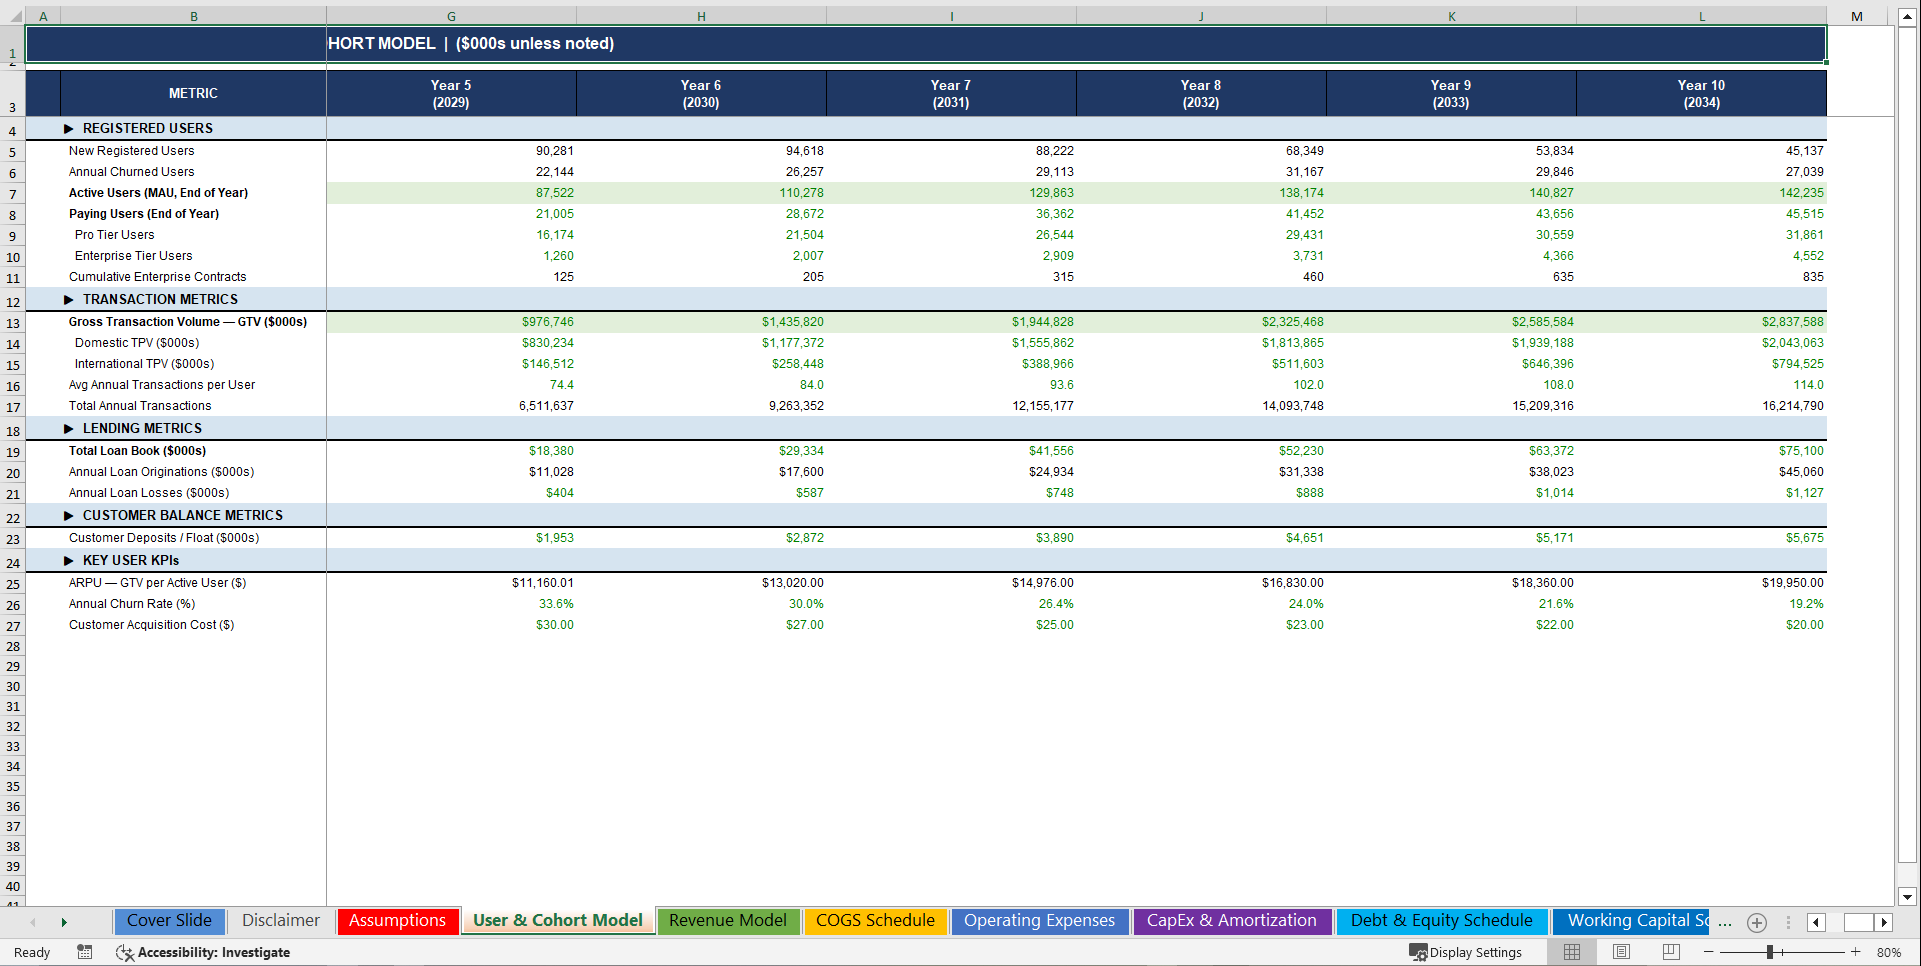
Tab 3: User & Cohort Model
• Annual user funnel built entirely from operational drivers – not a single percentage guess
• New registered users acquired each year, driven by prior active base × growth rate
• Active users (MAU) modeled with explicit activation rate and monthly churn compounding
• Paying users derived from active users × paid conversion rate – the monetization engine
• Pro tier users and Enterprise tier users broken out separately with cumulative contract tracking
• Gross Transaction Volume (GTV) = Active Users × Transactions per User per Month × 12 × Average Transaction Value – the foundational driver of all payment revenue
• Domestic and international TPV split by configurable geography assumption
• Total annual transactions calculated and linked to cloud cost per-transaction model
• Loan book roll-forward: lending penetration × active users × average loan size, updated every year
• Annual loan originations and loan loss provisions calculated and linked to COGS
• Customer deposits and float balance calculated as a percentage of GTV
• LTV/CAC ratio, ARPU, and annual churn rate output for every year – the four metrics every FinTech investor will open to first
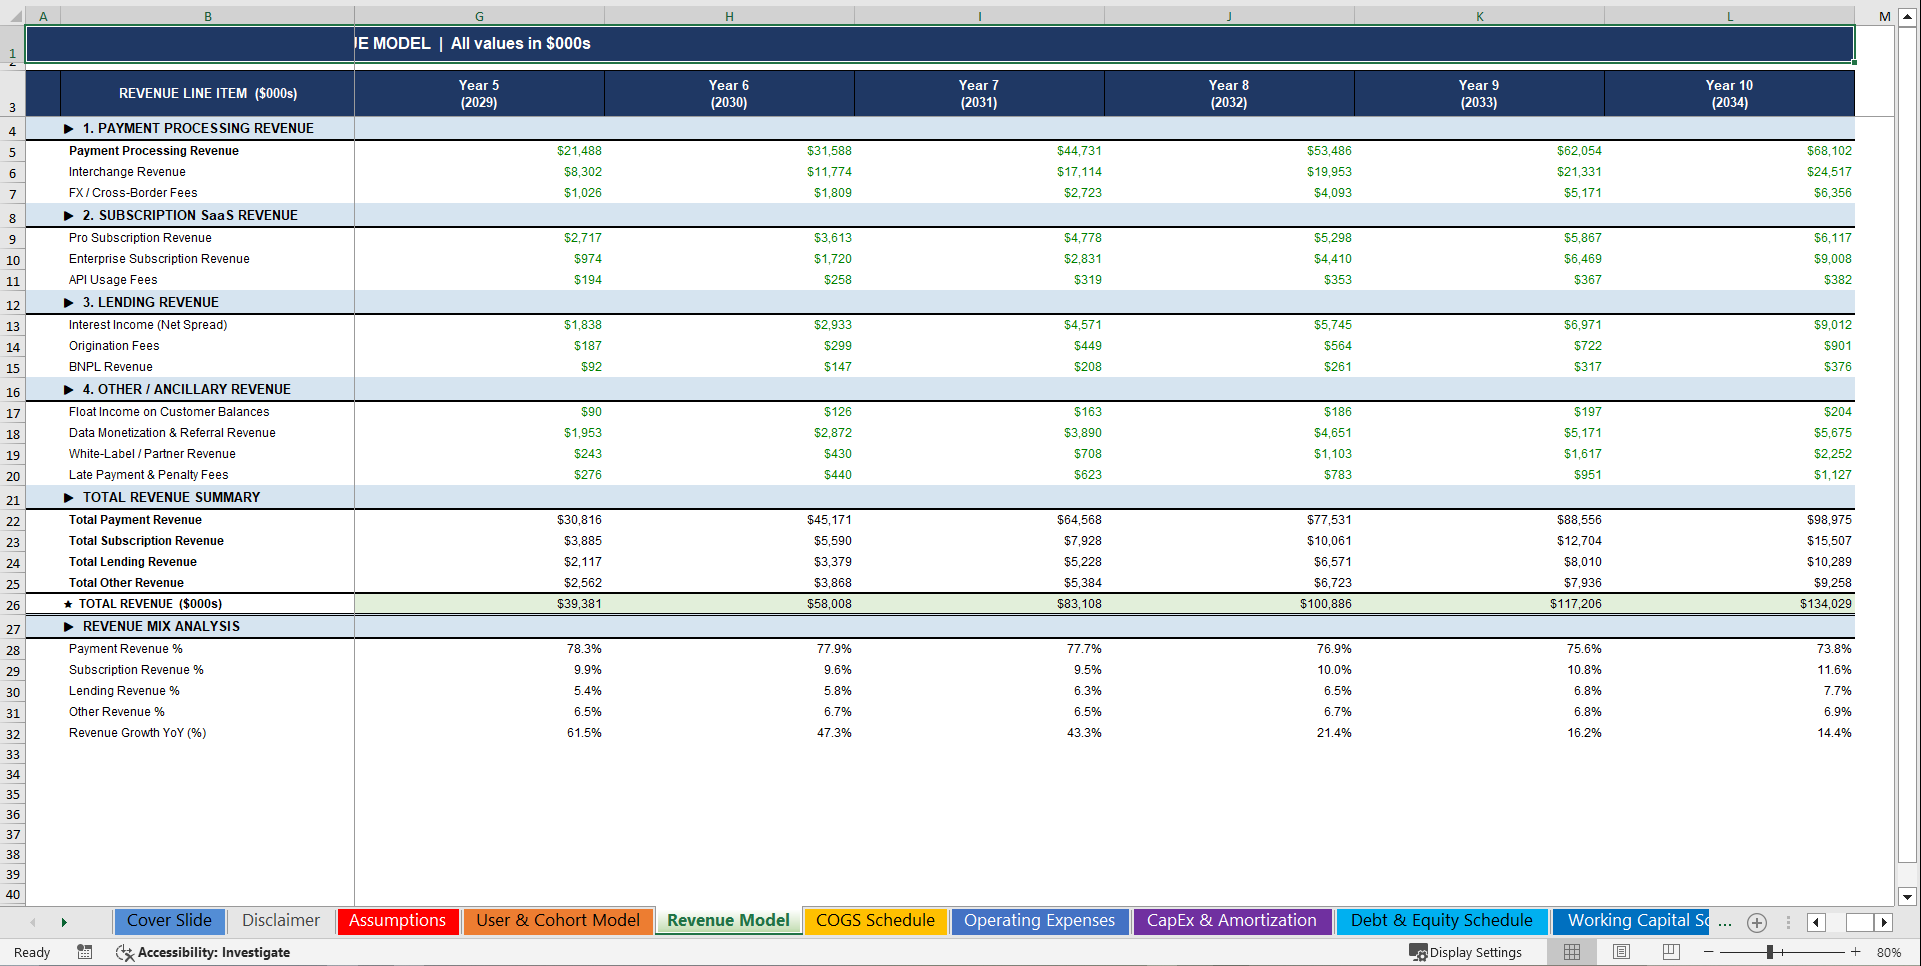
Tab 4: Revenue Model
• Revenue Stream 1 – Payment Processing: GTV × take rate, the core monetization driver
• Revenue Stream 2 – Interchange Revenue: domestic TPV × interchange rate
• Revenue Stream 3 – FX / Cross-Border Fees: international TPV × configurable FX spread
• Revenue Stream 4 – Pro Subscription Revenue: Pro users × monthly fee × 12
• Revenue Stream 5 – Enterprise Subscription Revenue: cumulative enterprise contracts × monthly fee × 12
• Revenue Stream 6 – API Usage Fees: computed from Pro user base at configurable penetration rate
• Revenue Stream 7 – Interest Income: loan book × net interest spread
• Revenue Stream 8 – Origination Fees: annual originations × configurable origination fee rate
• Revenue Stream 9 – BNPL Revenue: BNPL book × yield assumption
• Revenue Stream 10 – Float Income: customer deposit balance × treasury yield assumption
• Revenue Stream 11 – Data Monetization & Referral Revenue: GTV-based ancillary income
• Revenue Stream 12 – White-Label / Partner Revenue: enterprise contract-driven licensing fees
• Revenue Stream 13 – Late Payment & Penalty Fees: loan book-driven fee income
• Revenue mix analysis by product line for every year – watch the shift from payments to SaaS as the business matures
• Year-over-year revenue growth automatically calculated – no manual inputs required
Tab 5: COGS Schedule
• 7 line-item COGS schedule fully driven by GTV, transaction count, and revenue – zero hardcoded guesses
• Payment processing costs: GTV × configurable processing cost rate with annual efficiency improvement
• Fraud losses and chargebacks: GTV × fraud loss rate – directly stress-testable from Assumptions
• Variable cloud and hosting costs: total annual transactions × cloud cost per transaction
• KYC/AML verification: new registered users × per-user cost, declining with scale
• Customer support costs: revenue-percentage driven with annual efficiency improvement
• Partner revenue share: revenue-percentage driven, declining as direct channels scale
• Loan loss provisions: pulled directly from User & Cohort Model loan loss calculation
• Gross profit and gross margin percentage output for every year – watch margins expand from ~45% to ~75% as operating leverage kicks in
Tab 6: Operating Expenses
• Full headcount cost model by role – 10 teams, 8 role categories, individually salary-tracked
• Compensation formula: Headcount × Salary × (1 + Payroll Tax + Benefits + Bonus) – fully dynamic per year
• Engineering and Product team costs fully separated and linked to R&D expense line
• Paid acquisition spend modeled as CAC × new users acquired – directly tied to unit economics
• Brand, content, and other marketing separated from people costs and acquisition spend
• Legal, compliance, and regulatory broken out separately – critical for FinTech cost structures
• Finance, audit, and accounting costs modeled independently
• SBC modeled as a percentage of revenue and linked directly to equity reserve on Balance Sheet
• EBITDA and EBITDA margin output for every year – the operating leverage story every growth investor demands
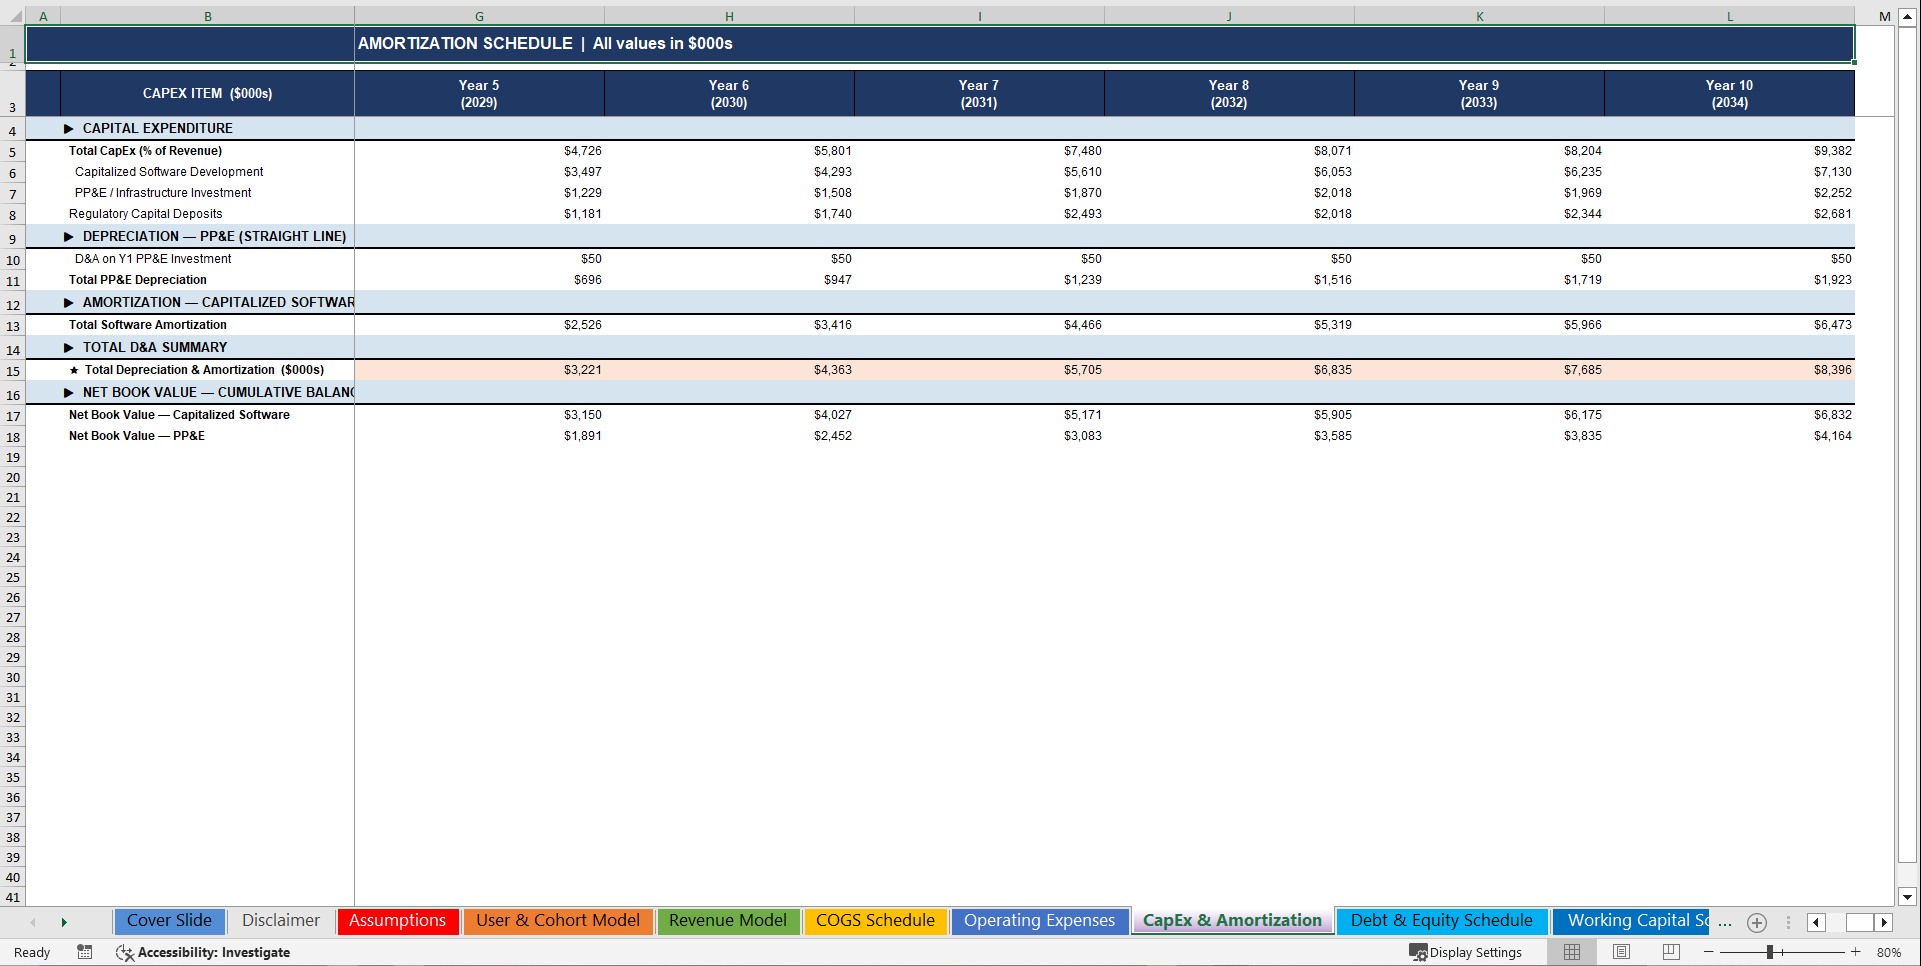
Tab 7: CapEx & Amortization Schedule
• Total CapEx modeled as a percentage of revenue with configurable annual glide path
• Capitalized software development and PP&E infrastructure split by configurable percentage
• Regulatory capital deposits modeled as percentage of revenue, cumulative on Balance Sheet
• Straight-line depreciation on PP&E over configurable useful life – rolling multi-year calculation
• Straight-line amortization on capitalized software over configurable useful life
• Net book value roll-forward for capitalized software and PP&E – both fully linked to Balance Sheet
• Total D&A feeding directly into Income Statement EBITDA-to-EBIT bridge
Tab 8: Debt & Equity Schedule
• Venture debt waterfall: beginning balance + new issuance − repayments = ending balance for every year
• Interest expense calculated on average debt balance at configurable annual rate
• Convertible note balance tracked and linked to Balance Sheet non-current liabilities
• Equity raise modeling with configurable capital in any year, cumulative paid-in capital tracked
• Total financing inflows per year feeding directly into Cash Flow Statement
Tab 9: Working Capital Schedule
• Accounts Receivable: revenue × DSO / 365, year-over-year delta calculated for CF Statement
• Accounts Payable: processing and infrastructure costs × DPO / 365, delta for CF Statement
• Deferred Revenue: subscription revenue × months of deferred revenue assumption, delta for CF Statement
• Customer Deposits: pulled from User & Cohort Model, delta feeds CF Statement
• Net Working Capital summary and total NWC change for every year – the indirect method input every CFO signs off on
Tab 10: Income Statement
• Full GAAP-format P&L for Years 1 through 10
• Net Revenue pulled directly from Revenue Model – no manual re-entry
• Total COGS pulled directly from COGS Schedule
• Gross Profit and Gross Margin % – watch the expansion from 45% to 75% over 10 years
• Operating expenses broken into R&D, Sales & Marketing, G&A, and SBC
• EBITDA and EBITDA Margin % – the metric driving every FinTech valuation multiple
• D&A pulled from CapEx Schedule – EBITDA to EBIT bridge fully automated
• Interest expense on venture debt – pulled from Debt & Equity Schedule
• Pre-Tax Income with configurable tax rate and NOL carryforward logic built in
• Net Income and Net Margin % – turns positive between Year 4 and Year 6 in the base case
Tab 11: Balance Sheet
• Current Assets: Cash hard-linked from Cash Flow Statement, AR from Working Capital, Prepaid modeled at 1% of revenue
• Non-Current Assets: Capitalized Software NBV and PP&E NBV from CapEx Schedule, Regulatory Capital Deposits cumulative roll-forward
• Current Liabilities: AP from Working Capital, Accrued Expenses at 3% of revenue, Current Portion of Debt
• Non-Current Liabilities: Long-Term Venture Debt, Convertible Notes
• Equity: Paid-In Capital from cumulative equity raises, SBC Reserve roll-forward, Retained Earnings cumulative net income roll-forward
• Balance check formula confirms Total Assets = Total Liabilities + Equity for every single year – zero reconciliation risk, zero investor red flags
Tab 12: Cash Flow Statement (Indirect Method)
• Operating Activities: Net Income + D&A + SBC + changes in AR, AP, Deferred Revenue, and Customer Deposits
• Investing Activities: Capitalized software spend, PP&E investment, Regulatory Capital Deposits
• Financing Activities: Equity raised, venture debt issued, debt repayment
• Net change in cash per year with beginning and ending cash roll-forward fully chained
• Ending cash hard-linked to Balance Sheet cash line – the integration test every FinTech lender runs before approving a term sheet
• Monthly burn rate and cash runway in months – auto-calculated, conditional-formatted to flag sub-12-month runway
Tab 13: Sensitivity Analysis
• Table 1 – Take Rate × Churn Rate EBITDA Sensitivity Matrix: Year 5 EBITDA across every combination of take rate and churn rate scenarios – instantly reveals the revenue and retention thresholds for profitability
• Table 2 – CAC × Processing Cost EBITDA Sensitivity Matrix: Year 5 EBITDA across every combination of customer acquisition cost and processing fee scenarios – quantifies your breakeven unit economics
• Five Full Business Scenarios: Base Case, High Growth, Recession, Regulatory Shock, and AI Automation Efficiency – each showing Year 5 and Year 10 Revenue, EBITDA, EBITDA Margin, and Net Income
Tab 14: Alert Legend & Model Guide
• Complete color coding reference: blue inputs, black formulas, green cross-sheet links – institutional standard formatting throughout
• Alert condition reference: cash runway triggers, EBITDA flags, balance check warnings
• Full model navigation guide – every tab described with its key inputs and outputs
🔢 Excel Functions & Formula Mechanics Used
• SUM / SUMIF – revenue aggregation, COGS rollups, OpEx totals across all 10 years
• IF / nested IF – Year 1 ramp logic, zero-guard formulas eliminating all #DIV/0! errors, balance check pass/fail indicators
• MAX / MIN – debt repayment floors, tax loss carryforward logic, cash floor calculations
• ROUND – user count rounding throughout cohort model for institutional precision
• Cross-sheet formula links – every forecast tab references Assumptions, User & Cohort Model, Revenue Model, COGS Schedule, OpEx, CapEx, Debt & Equity, and Working Capital
• Cohort roll-forward – active user base chains year-over-year with explicit churn compounding
• Inventory / Loan Book roll-forward – prior year balance + new originations − losses, chained across all 10 years
• Retained earnings roll-forward – prior year cumulative balance + current year net income, auto-chained across all 10 years
• Working capital delta calculations – change in AR, AP, Deferred Revenue, and Customer Deposits for indirect Cash Flow Statement
• Balance check formula – Total Assets minus Total Liabilities & Equity verified to zero for all 10 years
• LTV/CAC formula – built from GTV per user, repeat transaction rate, and gross margin – the unit economics metric every FinTech investor will open to first
💎 PLUS: Sensitivity & Scenario Analysis Built In
This is NOT a static model with one set of outputs.
It includes:
1️⃣ Take Rate × Churn Rate EBITDA Sensitivity Matrix
A full sensitivity table showing Year 5 EBITDA across every combination of payment take rate and annual churn rate. Instantly reveals how sensitive your business is to pricing compression and retention degradation – the two variables every payments investor will stress-test in their first 15 minutes of diligence.
2️⃣ CAC × Processing Cost EBITDA Sensitivity Matrix
A full sensitivity table showing Year 5 EBITDA across every combination of customer acquisition cost and variable processing fee. Quantifies your breakeven CAC threshold and reveals exactly how much pricing power you have on the cost side – the analysis that separates credible FinTech models from back-of-envelope projections.
3️⃣ Five Full Business Scenarios
Base Case – conservative user acquisition with realistic take rate and churn assumptions
High Growth – aggressive marketing spend, strong conversion improvement, and rapid enterprise expansion
Recession – demand softness, CAC spike, and churn elevation stress test
Regulatory Shock – compliance cost surge and take rate compression from regulatory intervention
AI Automation Efficiency – improved margin profile driven by AI-enabled cost reduction and automation leverage
💰 Why This Model Is Different
This model delivers:
✔ Revenue built from active users, gross transaction volume, and take rate – not a growth percentage multiplied against last year
✔ 15 FinTech-specific revenue streams: payments, interchange, FX, subscriptions, enterprise contracts, API fees, lending, BNPL, float income, data monetization, white-label licensing, origination fees, and more
✔ Full customer economics: CAC, LTV, LTV/CAC, cohort retention, monthly churn, cumulative paying user base
✔ FinTech-specific cost structure: KYC/AML per-user costs, cloud cost per transaction, fraud loss rate, regulatory capital deposits
✔ Lending model fully integrated: loan book roll-forward, interest spread, loan loss provisions linked to P&L
✔ Institutional-grade 3-statement integration – every number ties, every balance sheet balances, every cash flow reconciles
✔ Fully transparent assumption architecture – one tab with 80+ blue inputs controls 1,974 formulas across 14 sheets
✔ Headcount model by role with salary, hiring plan, payroll tax, benefits, and bonus – the depth of analysis Series A investors demand
✔ Sensitivity analysis built for investor Q&A, lender stress testing, and board-level scenario planning
✔ Zero formula errors – verified by automated scan across every formula in the model
It's built for venture-backed FinTech startups, payments and neobank founders, FinTech private equity, and growth equity investors – not generic SaaS templates recycled with a different label.
🧠 Built for Real Capital Decisions
This model helps you:
• Close your Series A with a credible, bottoms-up gross transaction volume model that VCs can actually underwrite
• Build a lender-ready financial package for venture debt, revenue-based financing, and growth credit facilities
• Present to growth equity and private equity with a clean, fully linked 3-statement model that survives diligence
• Stress-test your take rate, CAC, and churn assumptions before committing capital to a user acquisition strategy
• Understand your FinTech unit economics: LTV/CAC, ARPU, revenue per employee, EBITDA per active user
• Model your path to regulatory capital compliance without hiring a $500-per-hour consulting team
• Compress months of financial modeling work into hours – and walk into your next investor meeting prepared
🚨 The Cost of NOT Having This
Every fundraise you run without a proper FinTech model risks:
• Losing a Series A because your revenue model is a straight-line GTV guess with no take rate logic
• Failing lender due diligence because your cash flow statement doesn't reconcile to your balance sheet
• Overpaying for a FinTech acquisition because you didn't model loan loss provisions or regulatory capital requirements
• Getting destroyed in investor Q&A because you can't explain the relationship between your churn rate and your LTV/CAC ratio
• Spending $20,000–$30,000 on a Big Four consultant to build what you can own, reuse, and update forever for a fraction of the cost
One term sheet won with a credible model could return this investment ten thousand times over.
⚡ Stop Building From Scratch. Start Closing Term Sheets.
If you're serious about:
• Fundraising from institutional investors with a credible, bottoms-up FinTech revenue model
• Underwriting FinTech acquisitions with proper unit economics, take rate analysis, and loan book modeling
• Building a board-ready financial plan your CFO, your lead investor, and your lender would all be proud of
• Saving weeks of financial modeling time on your next raise, acquisition, or strategic plan
This model is your unfair advantage.
👉 Get the FinTech Financial Model the Right Way
No hardcoded revenue projections.
No broken formula links.
No wasted weekends reverse-engineering someone else's broken template.
Just a complete, verified, FinTech-specific 3-statement financial model – 14 tabs, 1,974 active formulas – ready to deploy on your next raise, acquisition, or operating plan the moment you download it.
Download the FinTech Startup Financial Model today – and walk into your next investor meeting with institutional-grade unit economics, a fully balanced balance sheet, and the financial credibility to close.
Keywords:
FinTech financial model Excel, FinTech 3-statement financial model, FinTech startup financial model template, payments company financial model, neobank financial model Excel, BNPL financial model, embedded finance financial model, FinTech revenue model, FinTech investor model, FinTech EBITDA model, FinTech cash flow model, FinTech CAC LTV model, customer acquisition cost FinTech, LTV CAC ratio FinTech model, FinTech unit economics model, FinTech working capital model, FinTech lending model, loan book financial model, FinTech interest spread model, loan loss provision model, FinTech regulatory capital model, KYC AML cost model, FinTech interchange revenue model, take rate financial model, gross transaction volume model, GTV TPV financial model, FinTech subscription model, FinTech SaaS revenue model, FinTech enterprise contract model, FinTech churn model, cohort retention FinTech model, FinTech user acquisition model, FinTech active users model, paying users financial model, FinTech float income model, FinTech ARPU model, FinTech headcount model, FinTech Series A model, FinTech Series B model, FinTech venture debt model, FinTech convertible note model, FinTech private equity model, FinTech venture capital model, FinTech fundraising model, FinTech acquisition model, FinTech underwriting model, FinTech sensitivity analysis, FinTech scenario analysis, FinTech balance sheet model, FinTech income statement, FinTech cash flow statement indirect method, payments startup financial model, DTC FinTech model, FinTech pro forma Excel, advanced Excel FinTech model, institutional FinTech model Excel, financial model with sensitivity analysis, financial model with scenario analysis, financial model with debt schedule, financial model with working capital, financial model with cohort model, financial model with dashboard, FinTech revenue per employee, FinTech gross margin model, FinTech operating leverage model, FinTech stock-based compensation model, FinTech depreciation amortization schedule, FinTech PP&E model, FinTech capitalized software model, FinTech regulatory deposits model, FP&A Excel template FinTech, FinTech operating model, FinTech board ready financial plan, McKinsey FinTech model, FinTech CFO toolkit, Strategy & Transformation, Growth Strategy, Strategic Planning, Strategy Frameworks, Innovation Management, Pricing Strategy, Core Competencies, Strategy Development, Business Transformation, Marketing Plan Development, Product Strategy, Breakout Strategy, Competitive Advantage, Mission, Vision, Values, Strategy Deployment & Execution, Innovation, Vision Statement, Core Competencies Analysis, Corporate Strategy, Product Launch Strategy, BMI, Blue Ocean Strategy, Breakthrough Strategy, Business Model Innovation, Business Strategy Example, Corporate Transformation, Critical Success Factors, Customer Segmentation, Customer Value Proposition, Distinctive Capabilities, Enterprise Performance Management, KPI, Key Performance Indicators, Market Analysis, Market Entry Example, Market Entry Plan, Market Intelligence, Market Research, Market Segmentation, Market Sizing, Marketing, Michael Porter's Value Chain, Organizational Transformation, Performance Management, Performance Measurement, Platform Strategy, Product Go-to-Market Strategy, Reorganization, Restructuring, SWOT, SWOT Analysis, Service 4.0, Service Strategy, Service Transformation, Strategic Analysis, Strategic Plan Example, Strategy Deployment, Strategy Execution, Strategy Frameworks Compilation, Strategy Methodologies, Strategy Report Example, Value Chain, Value Chain Analysis, Value Innovation, Value Proposition, Vision Statement, Corporate Strategy, Business Development, Business plan pdf, business plan, PDF, Business Plan DOC, Business Plan Template, PPT, Market strategy playbook, strategic market planning, competitive analysis tools, market segmentation frameworks, growth strategy templates, product positioning strategy, market execution toolkit, strategic alignment playbook, KPI and OKR frameworks, business growth strategy guide, cross-functional strategy templates, market risk management, market strategy PowerPoint doc, guide, ebook, e-book ,McKinsey Change Playbook, Organizational change management toolkit, Change management frameworks 2025, Influence model for change, Change leadership strategies, Behavioral change in organizations, Change management PowerPoint templates, Transformational leadership in change, supply chain KPIs, supply chain KPI toolkit, supply chain PowerPoint template, logistics KPIs, procurement KPIs, inventory management KPIs, supply chain performance metrics, manufacturing KPIs, supply chain dashboard, supply chain strategy KPIs, reverse logistics KPIs, sustainability KPIs in supply chain, financial supply chain KPIs, warehouse KPIs, digital supply chain KPIs, 1200 KPIs, supply chain scorecard, KPI examples, supply chain templates, Corporate Finance SOPs, Finance SOP Excel Template, CFO Toolkit, Finance Department Procedures, Financial Planning SOPs, Treasury SOPs, Accounts Payable SOPs, Accounts Receivable SOPs, General Ledger SOPs, Accounting Policies Template, Internal Controls SOPs, Finance Process Standardization, Finance Operating Procedures, Finance Department Excel Template, FP&A Process Documentation, Corporate Finance Template, Finance SOP Toolkit, CFO Process Templates, Accounting SOP Package, Tax Compliance SOPs, Financial Risk Management Procedures.
NOTE: Our digital products are sold on an "as is" basis, making returns and refunds unavailable post-download. Please preview and inquire before purchasing. Please contact us before purchasing if you have any questions! This policy aligns with the standard Flevy Terms of Usage.
Got a question about the product? Email us at support@flevy.com or ask the author directly by using the "Ask the Author a Question" form. If you cannot view the preview above this document description, go here to view the large preview instead.
TOPIC FAQ
What are the essential components of a FinTech 3-statement financial model?
A FinTech 3-statement model integrates a driver-based Income Statement, Balance Sheet, and indirect-method Cash Flow Statement so every line flows from operational drivers like GTV, transactions, and user cohorts. Institutional models also include working-capital schedules, capex/amortization, and financing schedules across a multi-year horizon such as a 10-year forecast.How should revenue streams be modeled for a payments or neobank business?
Model revenue as multiple product lines tied to operational drivers: payment processing (GTV × take rate), interchange (TPV × interchange rate), FX fees, subscription tiers, API fees, lending interest, origination fees, and float income. The model described builds 15 separate revenue streams driven from GTV, transactions, and user tiers.How do cohort retention, churn, and CAC/LTV interact in FinTech unit economics?
Cohort models roll active users forward with activation and monthly churn compounding, which drives paying users, GTV, and repeat transactions. CAC funds new-user acquisition; LTV is derived from cohort monetization and gross margin, and the model outputs CAC, LTV, and the LTV/CAC ratio for each forecast year.What sensitivity and scenario analyses matter most for FinTech forecasts?
Key analyses stress-test take rate versus churn and CAC versus processing cost to reveal EBITDA sensitivity. Useful scenario sets include Base, High Growth, Recession, Regulatory Shock, and efficiency-driven automation. Institutional templates include 2 sensitivity matrices plus multi-scenario outputs for Year 5 and Year 10 metrics.What should I look for when buying a FinTech financial model template?
Prioritize driver-based revenue linked to GTV and take rates, an integrated 3-statement build, cohort retention and CAC/LTV mechanics, loan-book and regulatory capital modeling, headcount-by-role planning, and built-in sensitivity/scenario analysis. A product that documents assumptions with blue-coded inputs and spans multiple tabs (e.g., 14 tabs) is preferable.How much customization and input control is typical in a FinTech model?
Expect a single assumptions tab controlling formula-driven outputs with many editable inputs. The referenced model centralizes inputs in 80+ blue-coded cells so changing one assumption updates all linked sheets, and it is compatible with Microsoft Excel and Google Sheets for further customization.If I’m raising Series A, which model outputs will investors scrutinize first?
Investors typically review unit economics and retention metrics first: CAC, LTV, LTV/CAC ratio, churn, ARPU, and cohort retention trends. They will also check that cash flow reconciles to the balance sheet and that runway and monthly burn are clearly presented, often over a 10-year forecast.How can a financial model support underwriting a FinTech acquisition or loan facility?
A model supports underwriting by projecting revenue mix, loan-book roll-forward, interest spreads, loan loss provisions, regulatory capital deposits, working-capital changes, and financing waterfalls so buyers and lenders can test valuation and covenant scenarios with concrete loan loss and regulatory capital outputs.Source: Best Practices in Fintech, Integrated Financial Model Excel: FinTech Business 10-Year 3 Statement Financial Model Excel (XLSX) Spreadsheet, SB Consulting
ABOUT THE AUTHOR
SB Consulting is dedicated to empowering businesses to communicate their ideas with impact. This consulting firm specializes in teaching organizations how to create effective corporate and management presentations. With training from top-tier global consulting firms, including McKinsey, BCG, and Porsche Consulting, extensive expertise in presentation design and ... [read more]
Ask the Author a Question
You must be logged in to contact the author.
