Financial statement analysis PPT: Learn key ratio analysis, financial reporting, and interpretation techniques. Download this expert presentation template now. Financial Statement Analysis is a 43-slide PPT PowerPoint presentation slide deck (PPT) available for immediate download upon purchase.
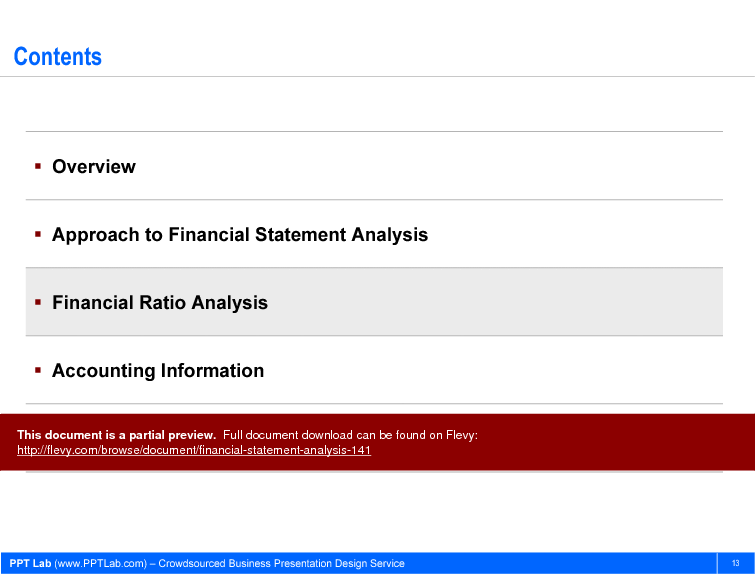
This document explains the financial statement analysis process. Most slides are instructional and covered topics include the financial statement analysis process, financial ratios analysis, accounting information (assumptions, principles, policies, procedures), and others.
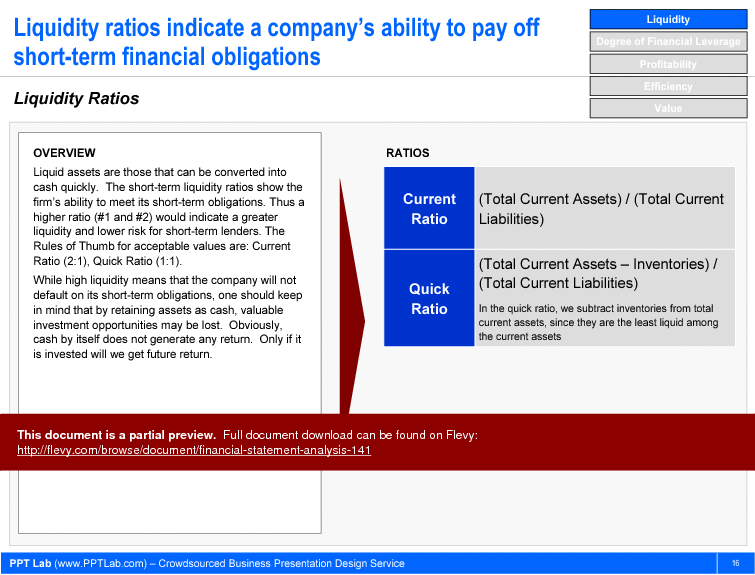
Financial statement analysis involves analyzing the firm's financial statements to extract information that can facilitate decision-making. For example, an analysis of the financial statement can reveal:
• whether the firm will be able to meet its long-term debt commitment,
• whether the firm is financially distressed,
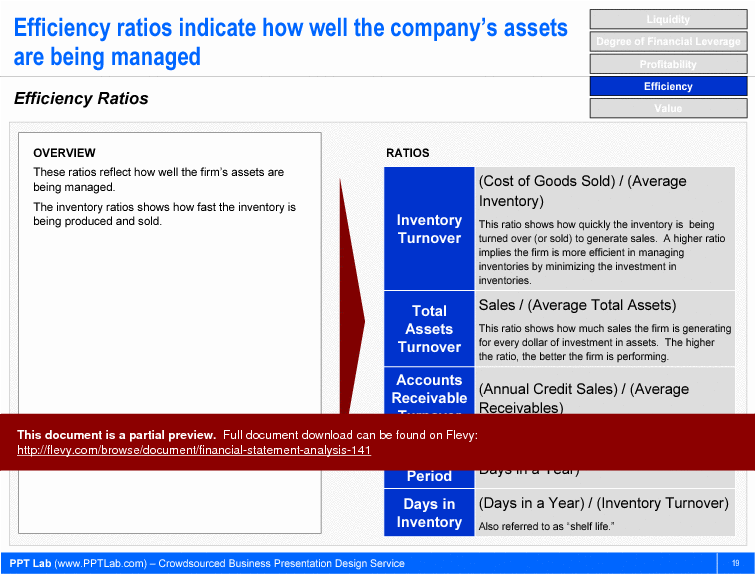
• whether the company is using its physical assets efficiently,
• whether the firm has an optimal financing mix,
• whether the firm is generating adequate return for its shareholders,
• whether the firm can sustain its competitive advantage, and so forth.
Performance of a firm can be assessed by computing key ratios and analyzing:
• How is the firm performing relative to the industry?
• How is the firm performing relative to the leading firms in their industry?
• How does the current year performance compare to the previous year(s)?
• What are the variables driving the key ratios?
• What are the linkages among the ratios?
• What do the ratios reveal about the future prospects of the firm for various stakeholders such as shareholders, bondholders, employees, customers, etc.?
Financial analysis is performed by both internal management and external groups. Firms would perform such an analysis in order to evaluate their overall current performance, identify problem/opportunity areas, develop budgets and implement strategies for the future.
External groups (e.g. investors, regulators, lenders, suppliers, customers) also perform financial analysis in deciding whether to invest in a particular firm, whether to extend credit, etc. There are several rating agencies (such as Moody's, Standard & Poors) that routinely perform financial analysis of firms in order to arrive at a composite rating.
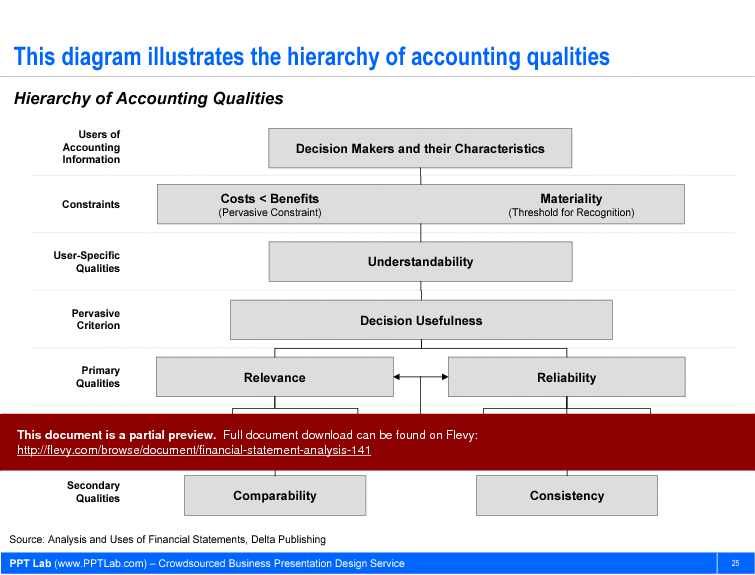
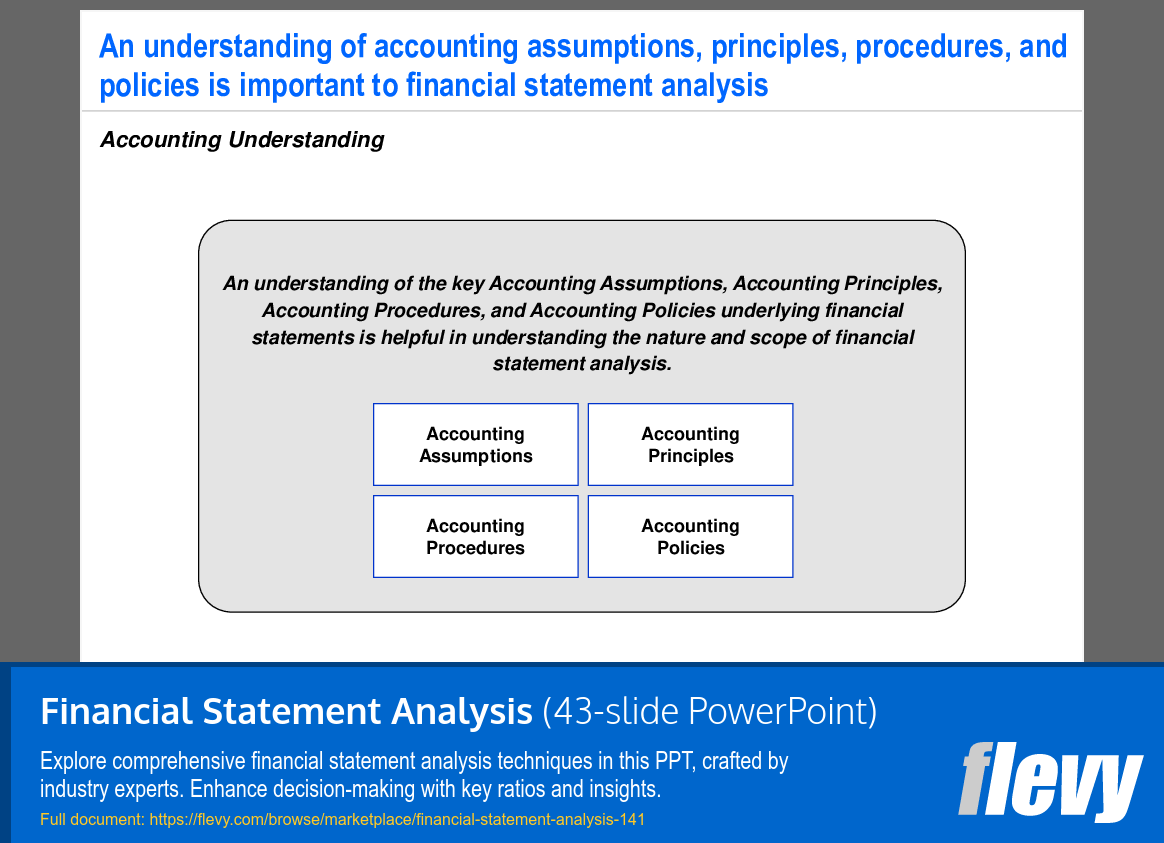
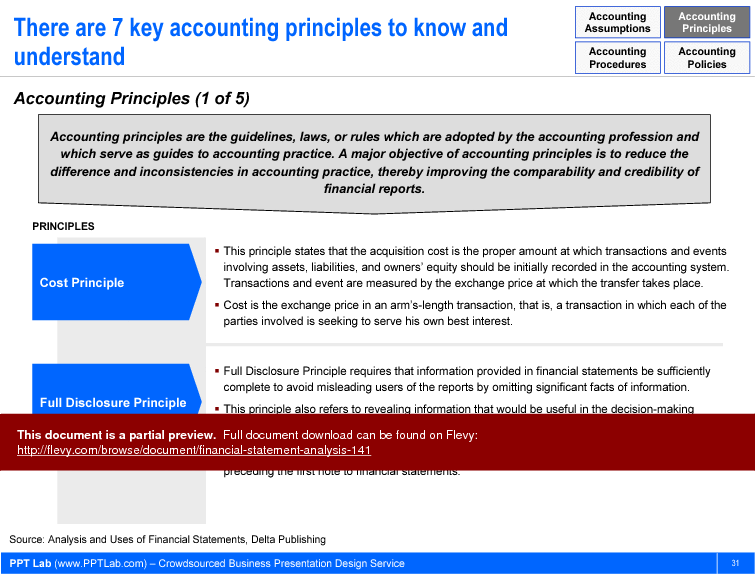
The document also covers the hierarchy of accounting qualities, emphasizing the importance of relevance and reliability in decision-making. Key accounting principles such as the cost principle and the materiality principle are explained in detail to enhance understanding.
Got a question about the product? Email us at support@flevy.com or ask the author directly by using the "Ask the Author a Question" form. If you cannot view the preview above this document description, go here to view the large preview instead.
This PPT slide outlines a five-phase approach to ratio analysis for assessing financial health and valuation. The first phase involves selecting comparable firms based on growth, technology, and size, ensuring similar financial characteristics for reliable ratios. The second phase focuses on calculating key financial ratios, expressed as V/x, where V is the firm's value and x is a financial variable. The third phase averages the ratios from comparables, discarding outliers to enhance accuracy. The fourth phase applies these averaged ratios to the company being valued, translating them into actionable insights. Finally, the fifth phase involves making a valuation judgment based on the calculated values, disregarding methodologies that produce outliers for a more rigorous analysis. This structured approach aids decision-making in valuation contexts.
This PPT slide outlines a structured 12-step approach to financial statement analysis, starting with acquiring financial statements for 3 to 5 years, including balance sheets, income statements, and cash flow statements. Historical data is essential for trend analysis and assessing company performance. The second step involves scanning for significant fluctuations in revenues or asset values, which may indicate underlying issues or opportunities. The third step focuses on reviewing the accompanying notes of financial statements, providing critical insights that clarify the main numbers and detail accounting policies affecting results. This systematic methodology enhances financial analysis and informed decision-making.
This PPT slide outlines key qualitative characteristics of accounting information:
"Bias" refers to measurement tendencies that skew data, leading to misinterpretations. "Comparability" emphasizes identifying similarities and differences across economic phenomena for effective benchmarking. "Completeness" highlights the necessity of including all relevant information for accurate financial representation. "Conservatism" involves prudently addressing uncertainties to consider risks in financial reporting. "Consistency" ensures stable accounting practices over time, essential for performance tracking. "Feedback Value" indicates how information helps users confirm or adjust prior expectations, reinforcing financial analysis. Lastly, "Materiality" addresses the significance of omissions or misstatements in financial reporting, underscoring the need for accuracy and thoroughness.
This PPT slide outlines the hierarchy of accounting qualities essential for decision-making. "Decision Makers and their Characteristics" form the foundation of the framework, emphasizing user needs. Key constraints include the balance of costs and benefits, indicating that accounting quality must justify its costs against benefits. Materiality sets the threshold for recognition in financial reporting. User-specific qualities highlight "Understandability" as critical for decision usefulness, which is further divided into relevance and reliability. Relevance encompasses predictive value, feedback value, and timeliness, while reliability includes verifiability, representational faithfulness, and neutrality. Secondary qualities like comparability and consistency enhance the utility of financial statements, aiding users in assessing and comparing financial information across periods or entities.
This PPT slide highlights critical insights on financial statements for investors. "Wall Street Is Not Your Friend" indicates the stock market's zero-sum nature, urging scrutiny of financial advice due to industry transparency issues. "Proforma Earnings Announcements" reveals the common use of pro forma earnings that exclude certain expenses, raising concerns about earnings manipulation without standardized reporting. SEC Chief Economist Lynn Turner cites a $101 billion discrepancy between unaudited pro forma and audited earnings. "Frequent Restructuring Charges and Write-Downs" points out that companies may misclassify routine restructuring costs as extraordinary, misleading investors on core profitability. "Reserve Reversals" discusses how management may manipulate reported profits using reserves intended for restructuring, distorting the financial picture for investors.
This PPT slide focuses on profitability ratios, essential metrics for assessing financial health. Key profitability ratios include Net Profit Margin, which indicates the percentage of revenue remaining after expenses; Return on Assets (ROA), measuring asset utilization for profit generation; and Return on Equity (ROE), assessing returns on shareholders' equity. Earnings per Common Share (EPS) reflects profitability per share, crucial for investors, while the Payout Ratio shows the proportion of earnings distributed as dividends, indicating financial strategy. Comparing these ratios with similar companies reveals performance trends, aiding investment and operational decisions. Understanding profitability ratios is vital for evaluating financial viability and growth prospects.
This PPT slide provides an overview of financial ratio analysis as a diagnostic tool for identifying company issues and opportunities. Financial ratios are defined as relationships between 2 numerical values, requiring context through comparisons to historical data or industry benchmarks for significance. Two primary comparison methods are outlined: analyzing historical ratios for internal trends and comparing ratios with similar firms for external insights. This dual approach enables organizations to assess performance relative to their past and peers. Key areas of insight derived from financial ratios include liquidity, financial leverage, profitability, efficiency, and value, which are critical dimensions of financial performance that inform executive decision-making. Financial ratio analysis focuses on extracting actionable insights to drive strategic initiatives.
This PPT slide outlines essential accounting concepts for financial statement analysis: Accounting Assumptions, Accounting Principles, Accounting Procedures, and Accounting Policies. Each component shapes the framework for preparing and interpreting financial statements. A solid grasp of these concepts is necessary for assessing the reliability and relevance of financial data. Understanding underlying assumptions enhances the ability to evaluate how different accounting policies affect a company's financial portrayal. These components have practical implications for decision-making, emphasizing that financial analysis requires a deep understanding of the principles and procedures governing financial reporting.
This PPT slide outlines 2 fundamental accounting principles: the Materiality Principle and the Conservatism Principle. The Materiality Principle mandates the disclosure of information that could significantly impact investor or creditor decisions, emphasizing professional judgment in defining materiality. The Conservatism Principle advocates for a cautious approach in financial reporting, requiring the anticipation and recording of potential losses while gains are only recognized when realized. This principle prevents overstatement of assets and understatement of liabilities, ensuring realistic financial statements. A practical application is valuing inventory at the lower of cost or market, reinforcing that conservative estimates mitigate risks associated with business uncertainty. Together, these principles promote transparency and reliability in financial reporting.
Source: Best Practices in Financial Analysis PowerPoint Slides: Financial Statement Analysis PowerPoint (PPT) Presentation Slide Deck, PPT Lab
PPT Lab is a presentation design firm specializing in business frameworks and PowerPoint templates. Our team is comprised of ex-consultants from McKinsey, E&Y, Bearing Point, and boutique consulting firms. We have worked with hundreds of clients globally, ranging from mid-size manufacturing companies to global Fortune 500 conglomerates.
All of our documents are of the
... [read more] same quality produced by top-tier consulting firms and utilize the Consulting Presentation Framework.
The average daily rate of a McKinsey consultant is $6,625 (not including expenses). The average price of a Flevy document is $65.
Trusted by over 10,000+ Client Organizations
Since 2012, we have provided business templates to over 10,000 businesses and organizations of all sizes, from startups and small businesses to the Fortune 100, in over 130 countries.
Read Customer Testimonials
"Flevy is now a part of my business routine. I visit Flevy at least 3 times each month.
Flevy has become my preferred learning source, because what it provides is practical, current, and useful in this era where the business world is being rewritten.
many challenges and there is the need to make the right decisions in a short time, with so much scattered information, we are fortunate to have Flevy. Flevy investigates, selects, and puts at our disposal the best of the best to help us be successful in our work.
"
– Omar Hernán Montes Parra, CEO at Quantum SFE
"I have found Flevy to be an amazing resource and library of useful presentations for lean sigma, change management and so many other topics. This has reduced the time I need to spend on preparing for my performance consultation. The library is easily accessible and updates are regularly provided. A wealth of great information."
– Cynthia Howard RN, PhD, Executive Coach at Ei Leadership
"One of the great discoveries that I have made for my business is the Flevy library of training materials.
As a Lean Transformation Expert, I am always making presentations to clients on a variety of topics: Training, Transformation, Total Productive Maintenance, Culture, Coaching, Tools, Leadership Behavior, etc. Flevy
It is well worth the money to purchase these presentations. Sure, I have the knowledge and information to make my point. It is another thing to create a presentation that captures what I want to say. Flevy has saved me countless hours of preparation time that is much better spent with implementation that will actually save money for my clients.
"
– Ed Kemmerling, Senior Lean Transformation Expert at PMG
"FlevyPro has been a brilliant resource for me, as an independent growth consultant, to access a vast knowledge bank of presentations to support my work with clients. In terms of RoI, the value I received from the very first presentation I downloaded paid for my subscription many times over! The
quality of the decks available allows me to punch way above my weight – it's like having the resources of a Big 4 consultancy at your fingertips at a microscopic fraction of the overhead.
"
– Roderick Cameron, Founding Partner at SGFE Ltd
"As a niche strategic consulting firm, Flevy and FlevyPro frameworks and documents are an on-going reference to help us structure our findings and recommendations to our clients as well as improve their clarity, strength, and visual power. For us, it is an invaluable resource to increase our impact and value."
– David Coloma, Consulting Area Manager at Cynertia Consulting
"FlevyPro provides business frameworks from many of the global giants in management consulting that allow you to provide best in class solutions for your clients."
– David Harris, Managing Director at Futures Strategy
"Last Sunday morning, I was diligently working on an important presentation for a client and found myself in need of additional content and suitable templates for various types of graphics. Flevy.com proved to be a treasure trove for both content and design at a reasonable price, considering the time I
saved. I encountered a download issue during the ordering process. However, a quick email to Flevy's support team, even on a Sunday (!!!), resulted in assistance within less than an hour, allowing me to download the content I needed. Fantastic job, Flevy! I give 5 stars for both content/price and customer service. Thank you!
"
– M. E., Chief Commercial Officer, International Logistics Service Provider
"My FlevyPro subscription provides me with the most popular frameworks and decks in demand in today’s market. They not only augment my existing consulting and coaching offerings and delivery, but also keep me abreast of the latest trends, inspire new products and service offerings for my practice, and educate me
Download our free compilation of 50+ Strategy & Transformation slides and templates. Frameworks include McKinsey 7-S, Balanced Scorecard, Disruptive Innovation, BCG Curve, and many more.