
 Click main image to view in full screen.
Financial Ratios & Diagnostics: 65 Ratios, Bands, Scores – Excel XLSX
Excel (XLSX) + supplemental PDF


BENEFITS OF THIS DOWNLOADABLE EXCEL DOCUMENT
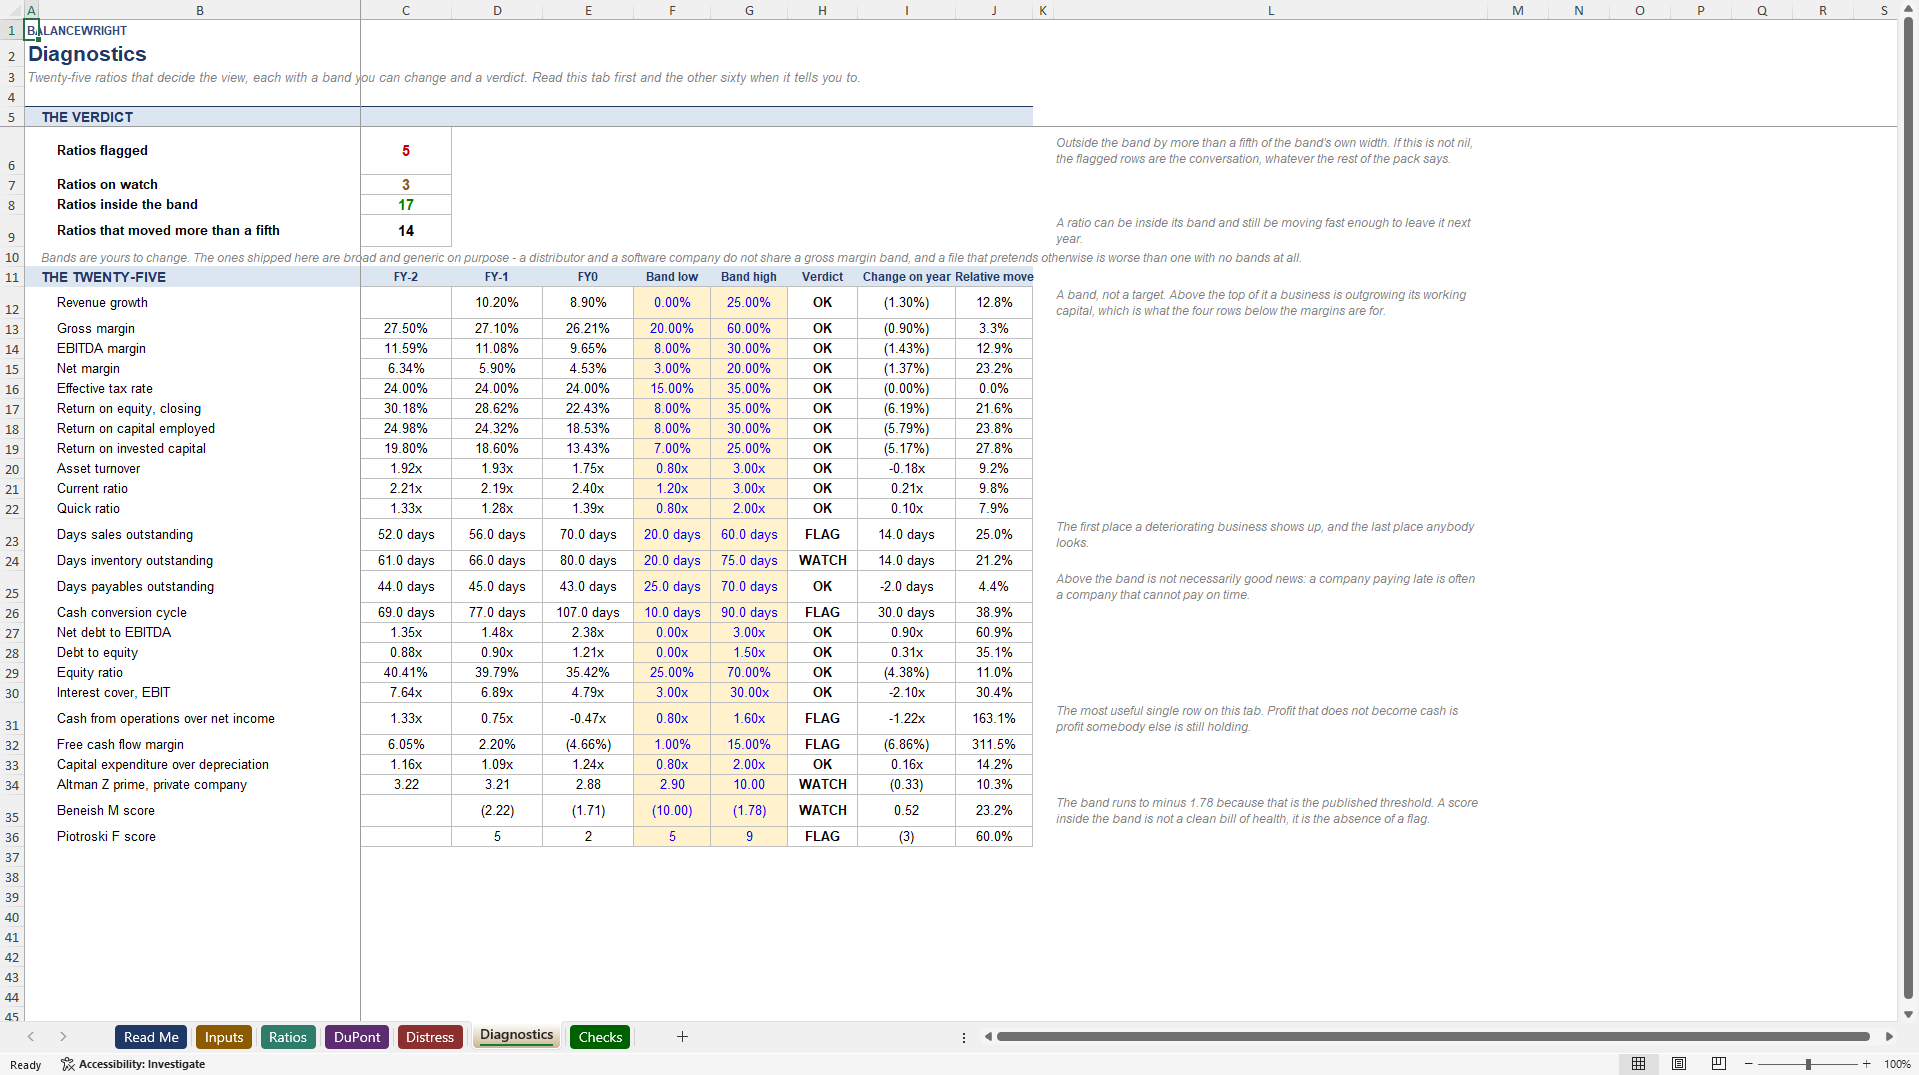
- Twenty-five ratios carry a band you can change and a verdict of OK, WATCH or FLAG, so the pack tells you which number to worry about instead of leaving you to guess.
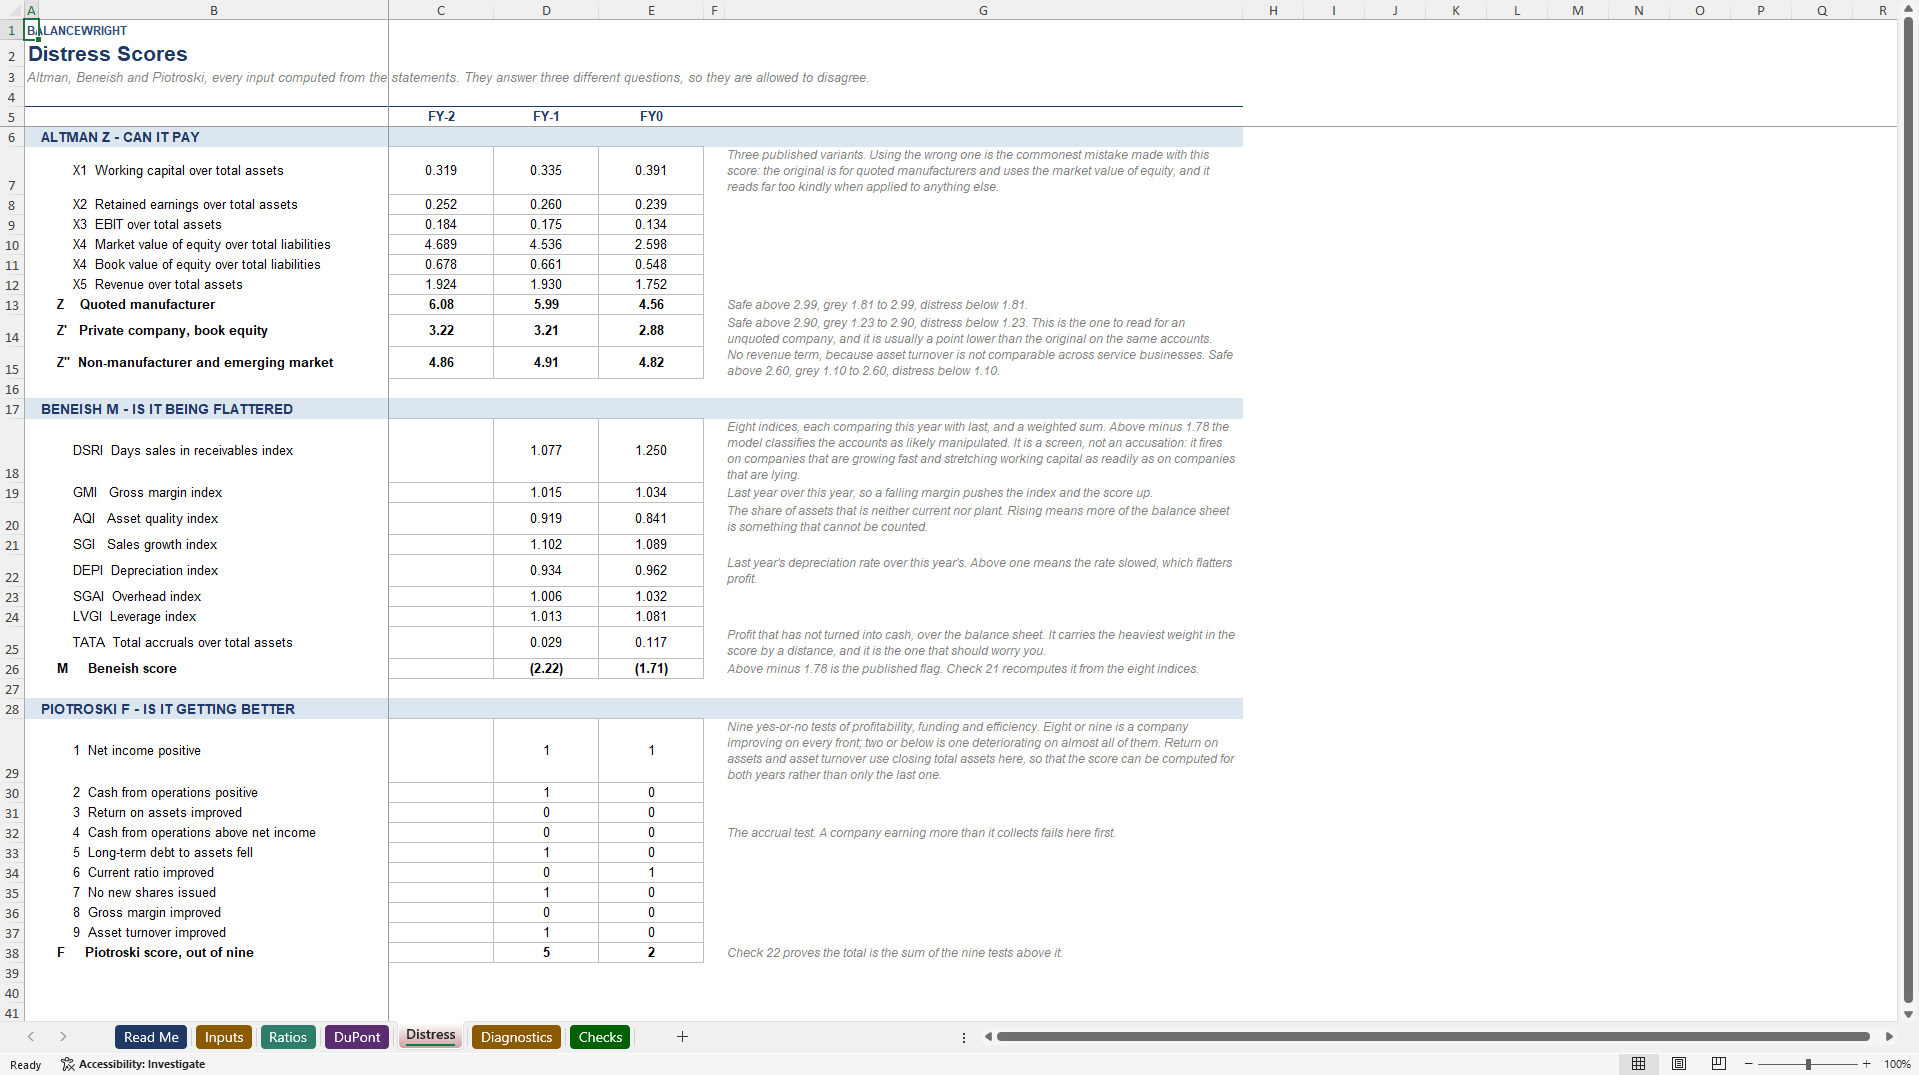
- Altman Z in all three published variants, Beneish M from its eight indices and Piotroski F from its nine tests, every input computed from the statements rather than typed.
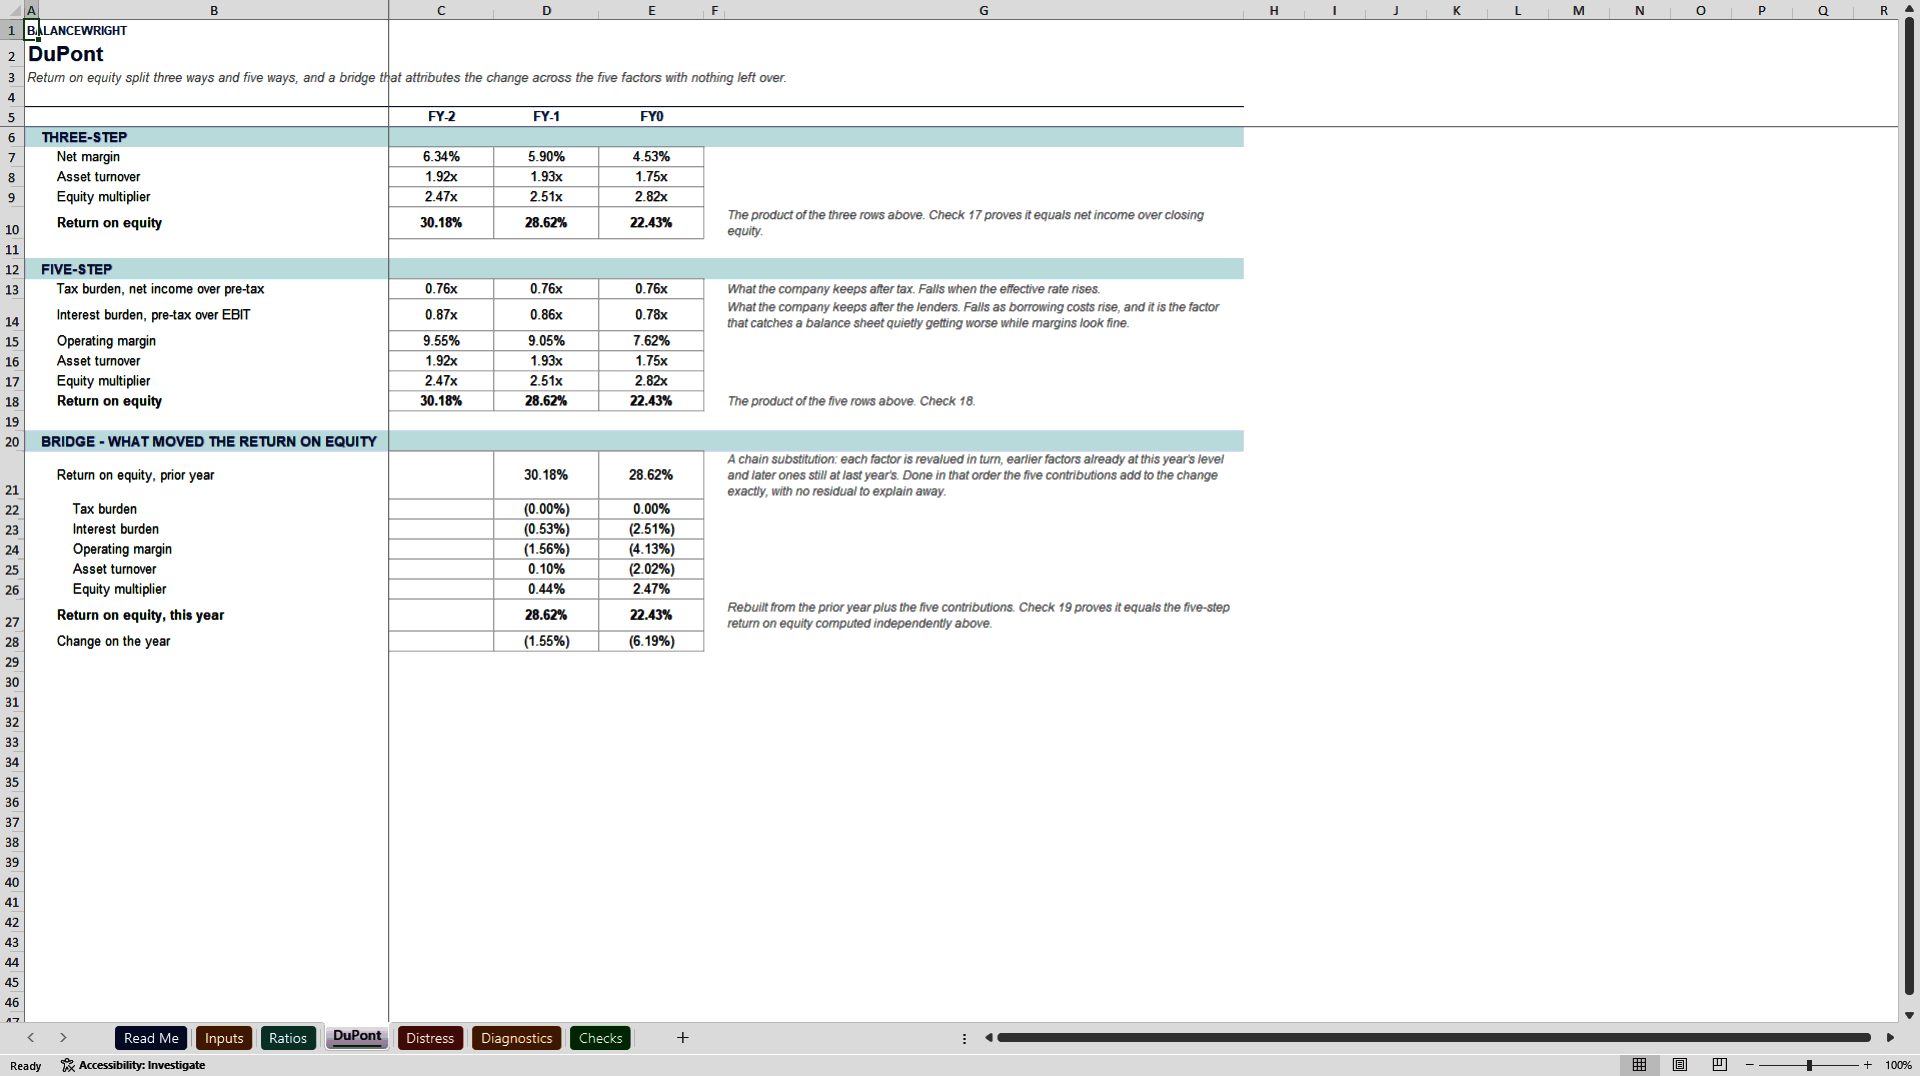
- A DuPont bridge by chain substitution, so the five factors add to the change in return on equity exactly, with no residual to explain away.
FINANCIAL ANALYSIS EXCEL DESCRIPTION
A ratio pack that reports sixty-five numbers and no opinion has moved the work, not done it. Somebody still has to know that fifty-two days sales outstanding is fine and seventy is not, that a current ratio of 2.4 says nothing useful on its own, and that the row which matters most on the whole sheet is usually cash from operations over net income. That knowledge is what people are actually paying for, and almost no template ships it.
This one does.
WHAT IT DOES
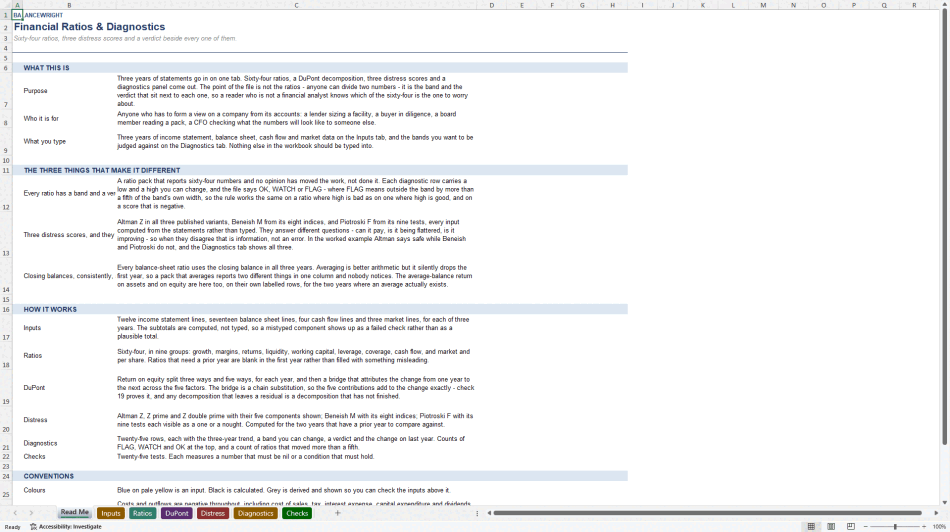
Three years of income statement, balance sheet, cash flow and market data go in on one tab. Out come sixty-five ratios in nine groups, a DuPont decomposition with a bridge that closes exactly, three distress scores with every component visible, and a diagnostics panel that puts a band and a verdict next to the twenty-five ratios that decide the view. Seven tabs, 590 live formulas, twenty-five built-in checks.
THE THREE THINGS THAT MAKE IT DIFFERENT
1. Every ratio that matters has a band and a verdict. Twenty-five rows carry a low and a high you can change, and the file says OK, WATCH or FLAG. FLAG means outside the band by more than a fifth of the band's own width – a rule chosen deliberately, because it behaves the same way on a ratio where high is bad as on one where high is good, and it still works on a score that is negative, which a simple twenty-per-cent-outside rule does not.
2. Three distress scores, and they are allowed to disagree. Altman Z in all three published variants, Beneish M from its eight indices, and Piotroski F from its nine tests – every input computed from the statements rather than typed. They answer three different questions: can it pay, is it being flattered, is it getting better. When they disagree that is information, not an error. Using the wrong Altman variant is the commonest mistake made with that score, so all three are here with a note beside each saying which company it is for.
3. Closing balances, consistently, with the average shown separately. Every balance-sheet ratio uses the closing balance in all three years. Averaging is better arithmetic, but it silently drops the first year, so a pack that averages is reporting two different things in one column and nobody notices. The average-balance return on assets and on equity are here too, on their own labelled rows, for the two years where an average actually exists.
THE WORKED EXAMPLE, WHICH IS THE ARGUMENT
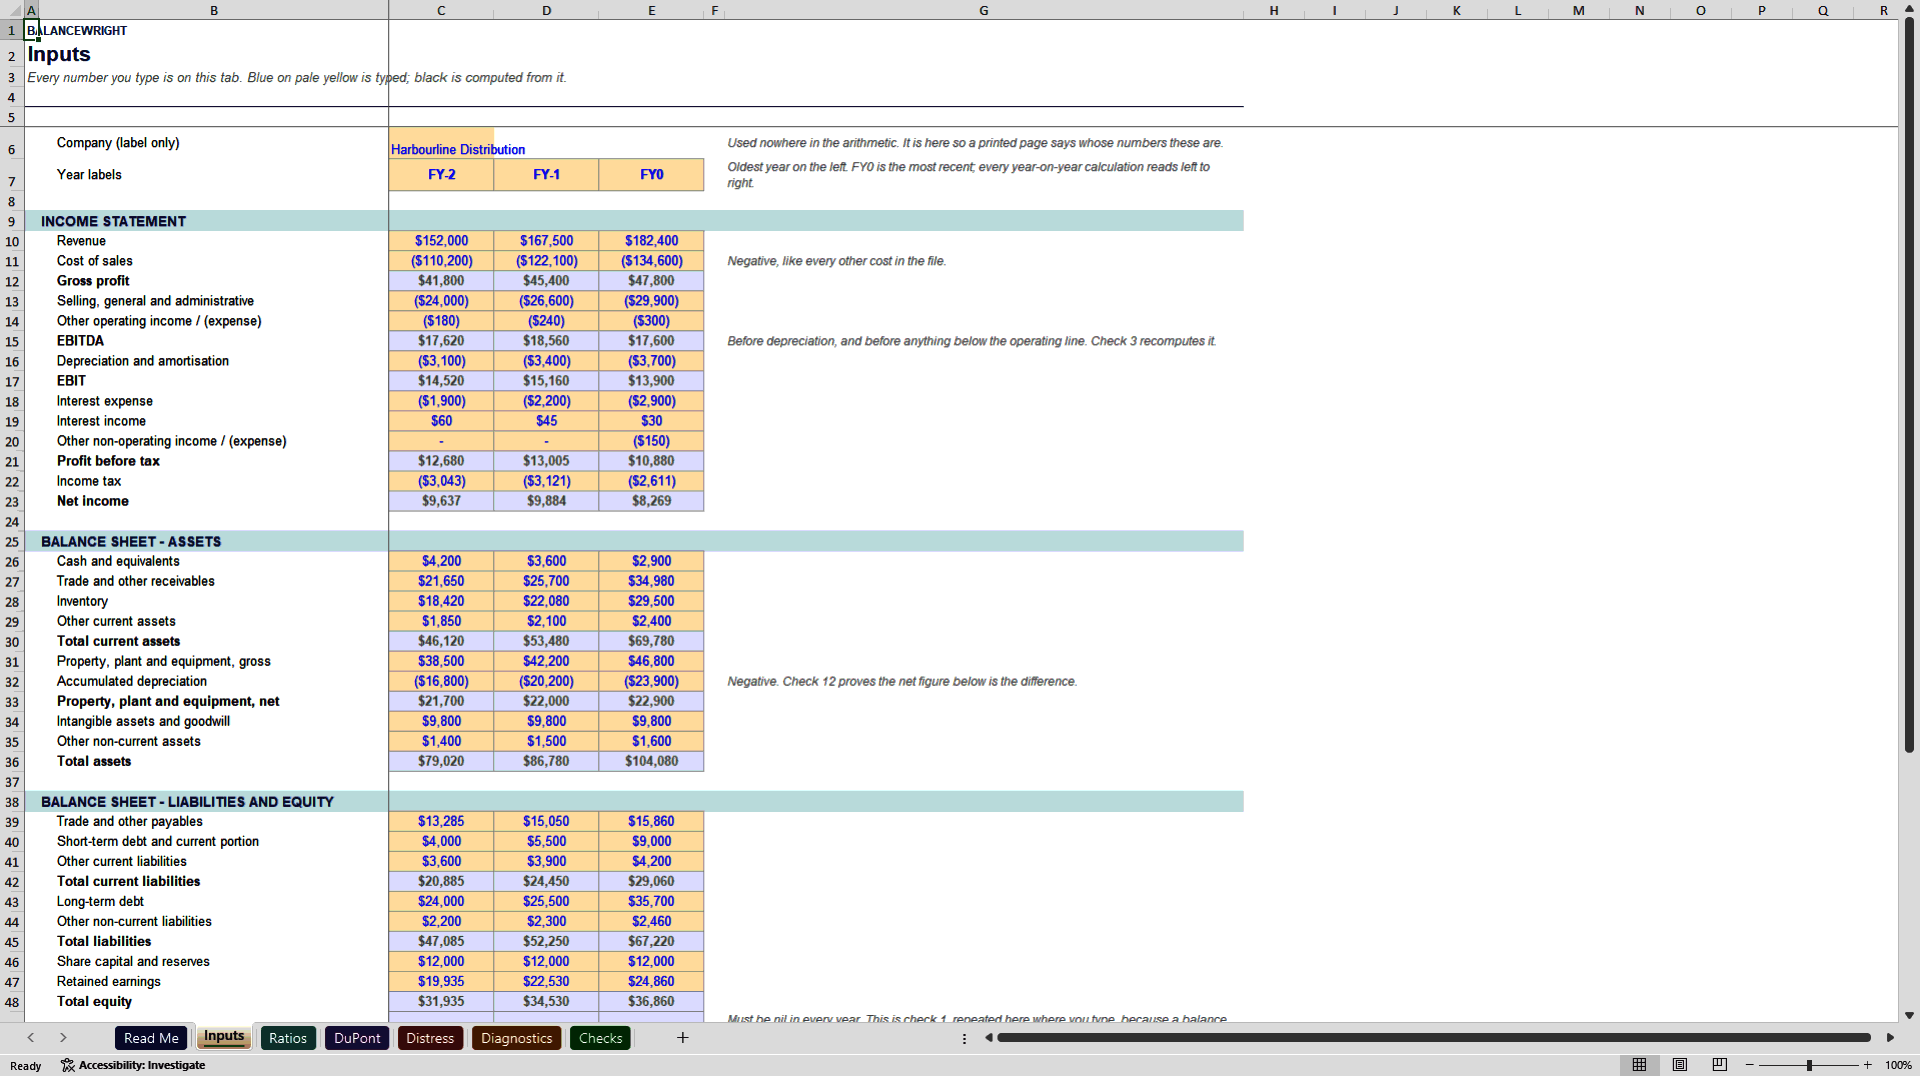
Harbourline Distribution. Revenue grows from $152.0m to $182.4m. Gross margin slips from 27.5 to 26.2 per cent, EBITDA margin from 11.6 to 9.7. Net income $8.3m, return on equity 22.4 per cent, interest cover 4.8 times, net debt 2.4 times EBITDA, dividend paid. Every profitability ratio in the file is inside its band. On those numbers most packs would stop.
This one puts five flags on the page:
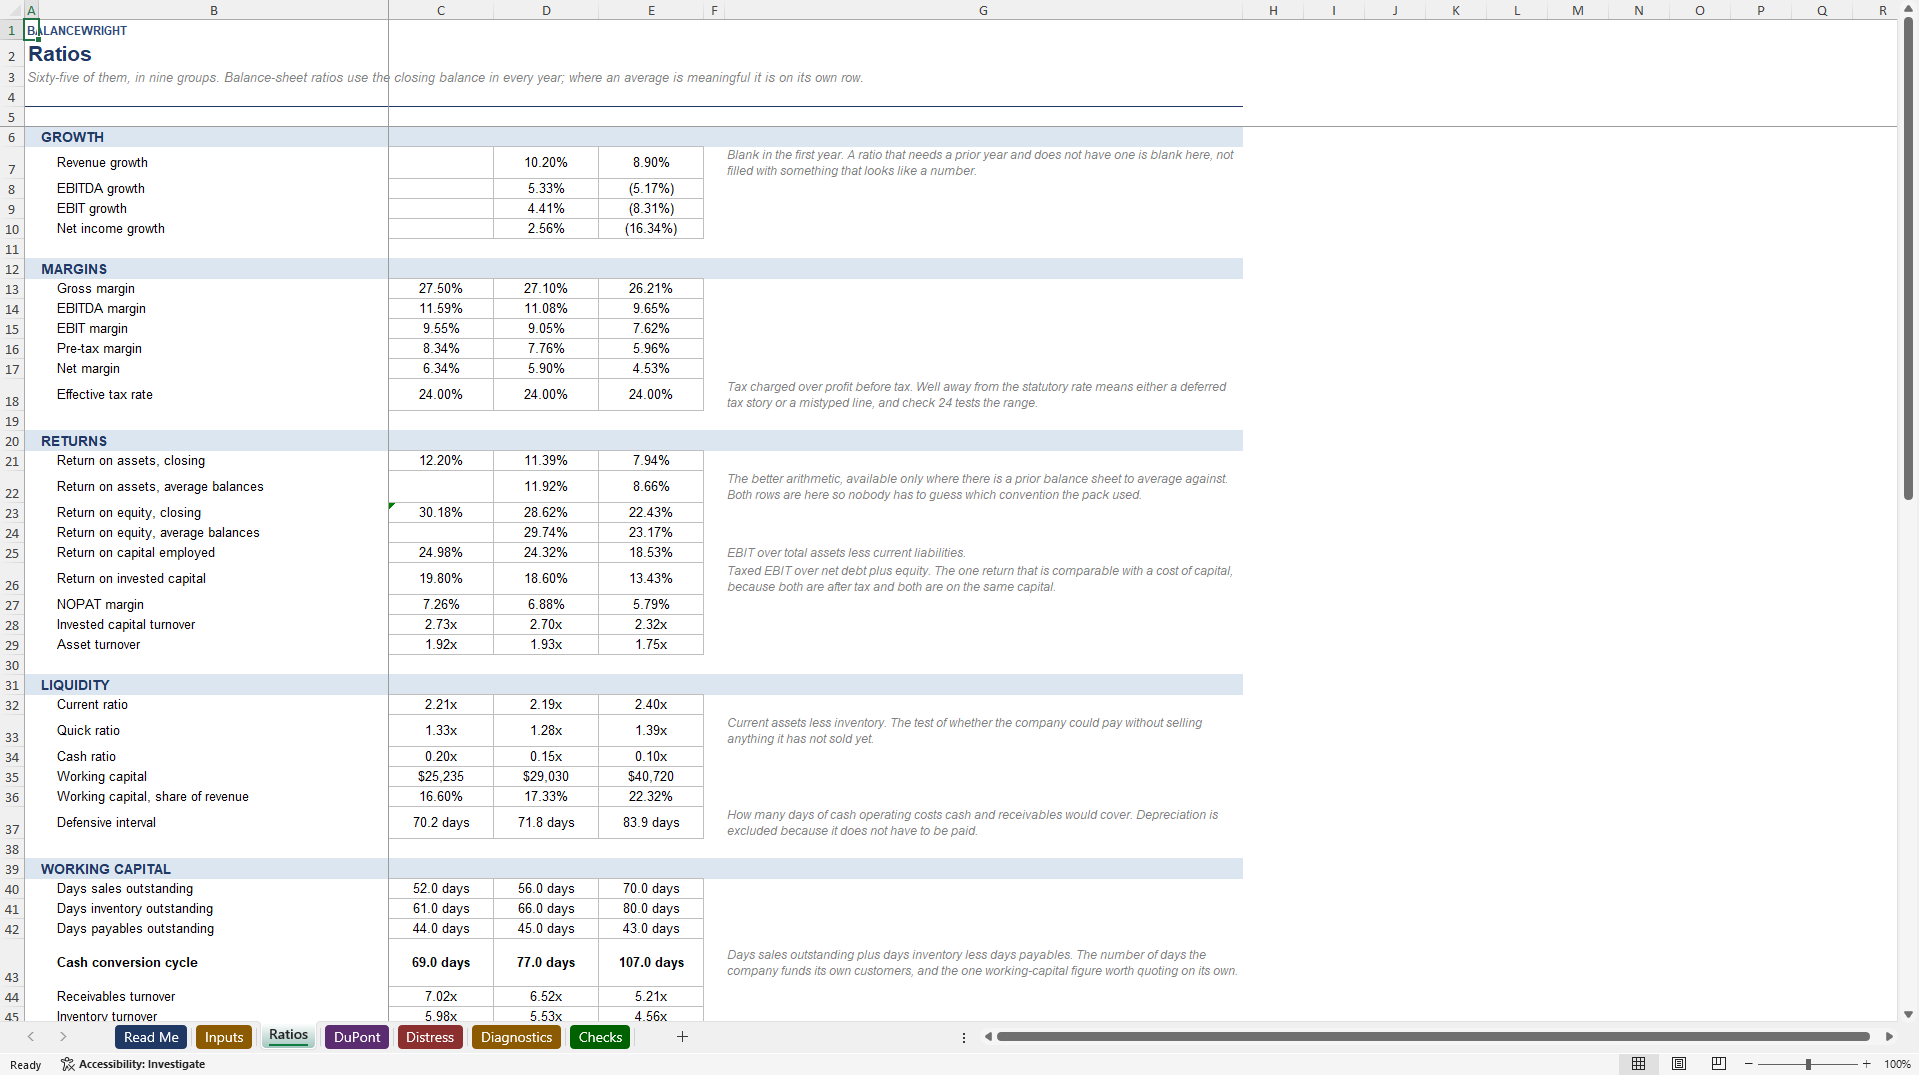
Days sales outstanding: 52 to 56 to 70 days.
Cash conversion cycle: 69 to 77 to 107 days.
Cash from operations over net income: 1.33 to 0.75 to minus 0.47.
Free cash flow margin: 6.1 to 2.2 to minus 4.7 per cent.
Piotroski F: five out of nine, then two out of nine.
And three more on watch: inventory days, Altman Z prime into the grey zone, and Beneish M crossing its published threshold from minus 2.22 to minus 1.71.
The company is profitable, covered on interest, modestly levered and paying a dividend. It is also funding twenty-six more days of its customers' working capital than it was two years ago and has stopped generating cash entirely. That is the gap this workbook exists to close.
WHAT IS IN THE FILE
Read Me – what it is, who it is for, and the conventions it uses.
Inputs – twelve income statement lines, seventeen balance sheet lines, four cash flow lines and three market lines, for each of three years. Every subtotal is computed, so a mistyped component shows up as a failed check rather than as a plausible total. The balance check sits on this tab, under the equity block, where you can see it while you type.
Ratios – sixty-five, in nine groups: growth, margins, returns, liquidity, working capital, leverage, coverage, cash flow, and market and per share.
DuPont – return on equity split three ways and five ways, and a bridge that attributes the change across the five factors by chain substitution, so the contributions add to the change exactly with no residual.
Distress – Altman Z, Z prime and Z double prime with their components; Beneish M with its eight indices; Piotroski F with its nine tests each shown as a one or a nought.
Diagnostics – twenty-five rows with trend, band, verdict, change on the year and the size of that change, and four counts at the top.
Checks – twenty-five tests.
THE CHECKS
Thirteen are the statements tying to themselves: every subtotal recomputed from its components, the balance sheet balancing in every year, every cost line an outflow. Then the cross-checks between rows written independently – days sales outstanding times receivables turnover has to come to 365, both DuPont decompositions have to reproduce net income over closing equity, enterprise value rebuilt from the share price and the individual debt lines. Then the scores, each recomputed from its own components. And last, the one most packs leave out: retained earnings have to move by net income less dividends, which ties the income statement to the balance sheet across years and fails on a revaluation, a buyback or a restatement.
All twenty-five were independently re-derived in 269 separate comparisons against a second, from-scratch Python implementation of every ratio, every DuPont contribution and all three distress scores, with Altman, Beneish and Piotroski rebuilt from their published definitions rather than from the workbook's own components.
WHAT IT IS NOT
It is not a forecast – three years of history, no projection, no valuation. It is not an audit; the checks test internal consistency, not whether the statements are true. It does not adjust for accounting policy: two companies on different lease, revenue recognition or inventory conventions are not comparable, and no ratio pack will tell you that. It does not know your industry, which is exactly why the bands are inputs rather than constants. It has no segment analysis.
FORMAT
One Microsoft Excel workbook (.xlsx). Opens in Excel 2016 and later, Microsoft 365, LibreOffice Calc, Apple Numbers and Google Sheets. No macros, no add-ins, no external links, no password protection, no locked cells, iterative calculation off. Blue on pale yellow is an input; nothing else in the file should be typed into. A guide and preview PDF is included.
Building this from scratch takes a competent financial modeller two to four days.
Got a question about the product? Email us at support@flevy.com or ask the author directly by using the "Ask the Author a Question" form. If you cannot view the preview above this document description, go here to view the large preview instead.
Source: Best Practices in Financial Analysis, Key Performance Indicators Excel: Financial Ratios & Diagnostics: 65 Ratios, Bands, Scores Excel (XLSX) Spreadsheet, Balancewright
ABOUT THE AUTHOR

Balancewright builds working financial models for subscription and recurring-revenue businesses -- cohort retention, revenue movement, unit economics, cash flow and scenario forecasting.
Every model is formula-driven end to end. No locked cells, no passwords, no macros and no external links, so any calculation can be inspected, adapted and audited. Each file ships with a visible
... [read more]
Ask the Author a Question
You must be logged in to contact the author.




























