 Click main image to view in full screen. Unlock all 15 preview images:
Dental Practice Financial Model - 60-Month Forecast – Excel XLSX
Excel (XLSX) + supplemental PDF


BENEFITS OF THIS DOWNLOADABLE EXCEL DOCUMENT
- 🦷 Connect 15 dental treatments, 15 provider profiles and shared chair capacity to 60 months of clinical production, recognized revenue and financial forecasts.
- 📊 Analyze practice profitability, cash flow and investment value with 4 linked scenarios, 8 native dashboard charts, integrated financial statements and DCF valuation.
- 🏦 Streamline dental practice financial planning with 25 connected worksheets, equipment CAPEX, debt schedules, liquidity controls, a 5 × 5 valuation sensitivity matrix and a 40-page guide.
DENTAL SERVICES EXCEL DESCRIPTION
🦷 DENTAL PRACTICE FINANCIAL MODEL
60-MONTH SIGNATURE EDITION
✨ CONNECT CLINICAL CAPACITY, PROFITABILITY & BUSINESS VALUE
Build a clearer understanding of dental practice economics with a comprehensive five-year Excel financial planning model.
The Dental Practice Financial Model connects patient treatment demand, clinician availability, treatment-chair capacity, procedure pricing, insurance allowance assumptions, operating expenses, equipment investment, debt financing and business valuation within one structured workbook.
Designed for dental clinic owners, practice founders, healthcare consultants, financial analysts, business advisers and educators, this editable model supports the evaluation of illustrative dental practice operating and financial scenarios.
With 25 interconnected worksheets, 60 monthly forecast periods, 15 editable treatment categories, 15 sample provider profiles, four selectable scenarios and eight native Excel dashboard charts, the model brings clinical operations and financial performance together.
All sample inputs and outputs are fictional and must be adapted to the dental practice and jurisdiction being evaluated.
━━━━━━━━━━━━━━━━━━━━
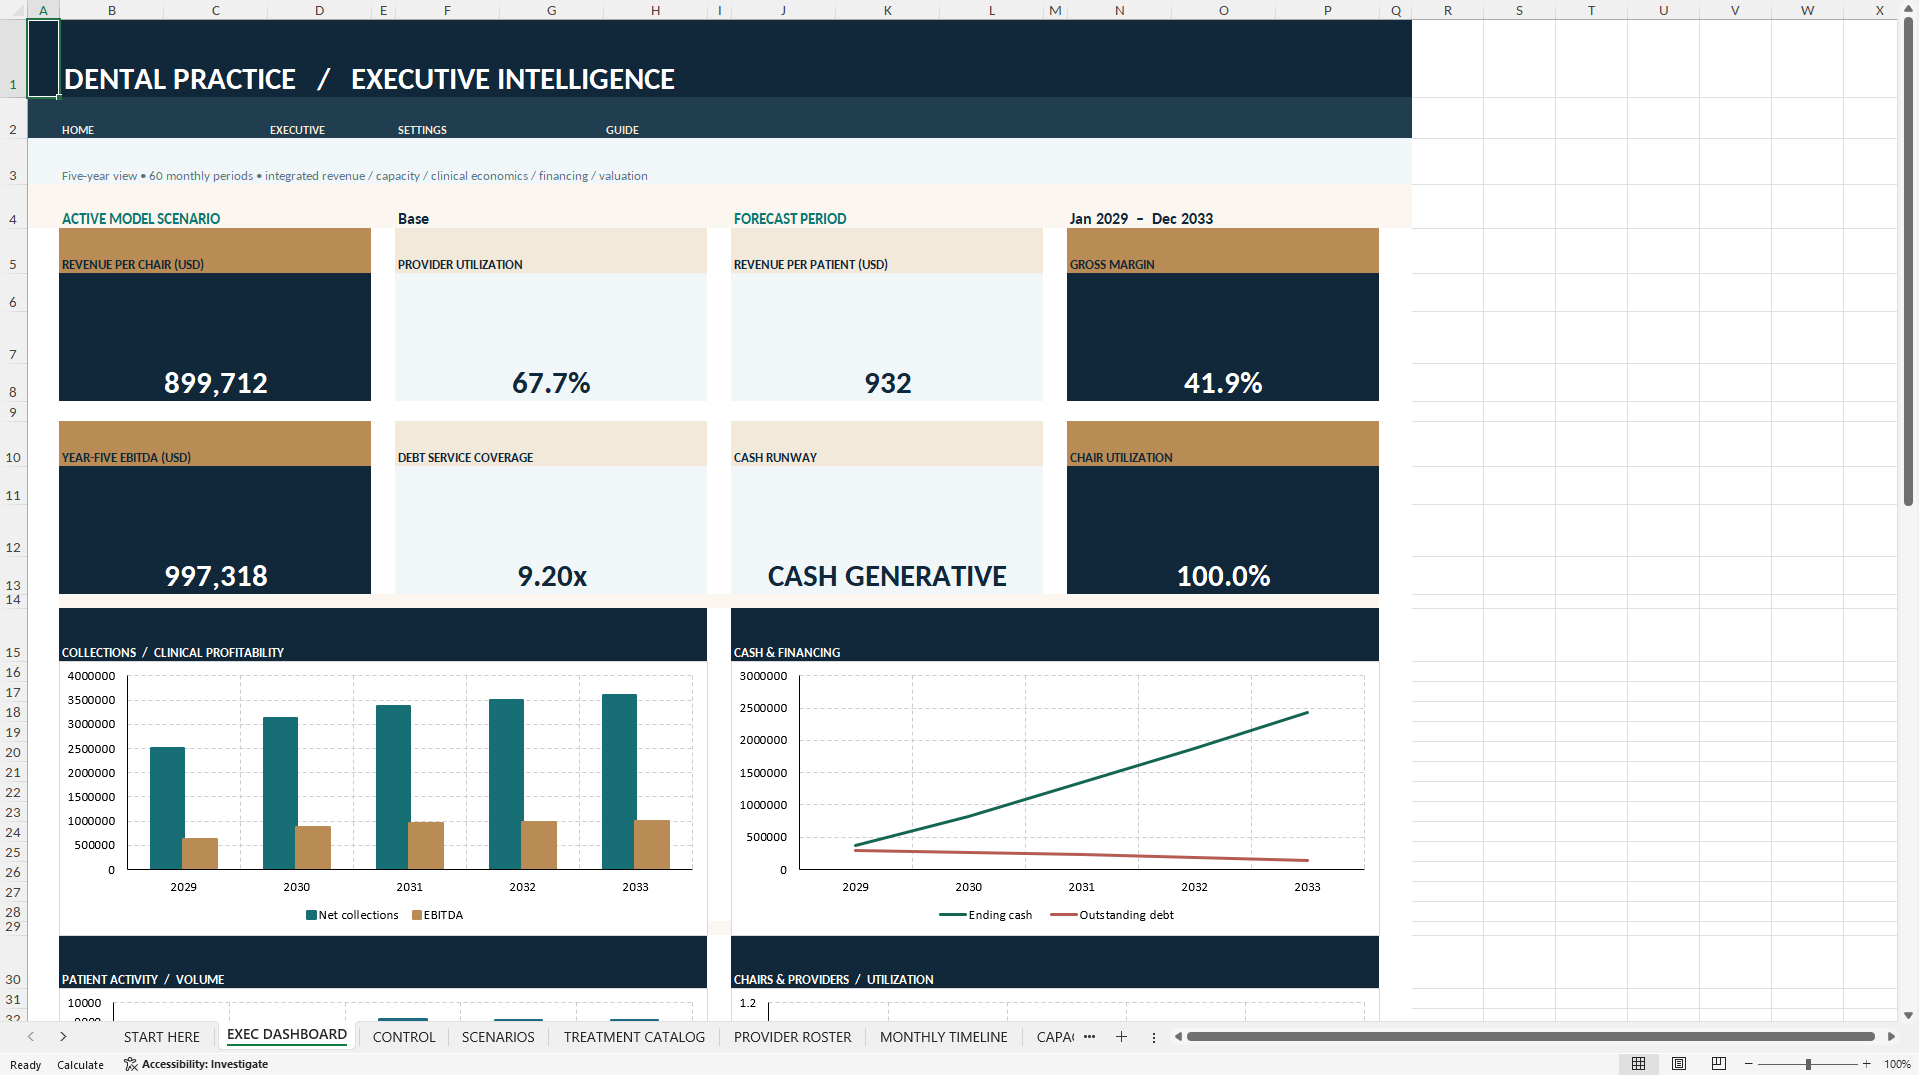
📊 EXECUTIVE DENTAL PRACTICE DASHBOARD
Monitor the most important clinical, operational and financial indicators from one dedicated executive dashboard.
Eight native Excel charts are linked to the workbook's financial and operating schedules.
Key dashboard metrics include:
• Revenue per Treatment Chair
• Provider Utilization
• Revenue per Modeled Patient-Equivalent
• Gross Profit Margin
• Year-Five EBITDA
• Debt Service Coverage
• Simplified Cash Runway
• Treatment-Chair Utilization
The dashboard connects financial results with the availability of dentists, hygienists and shared treatment-chair resources.
This allows users to investigate whether modeled patient demand can actually be accommodated within the available clinical capacity.
━━━━━━━━━━━━━━━━━━━━
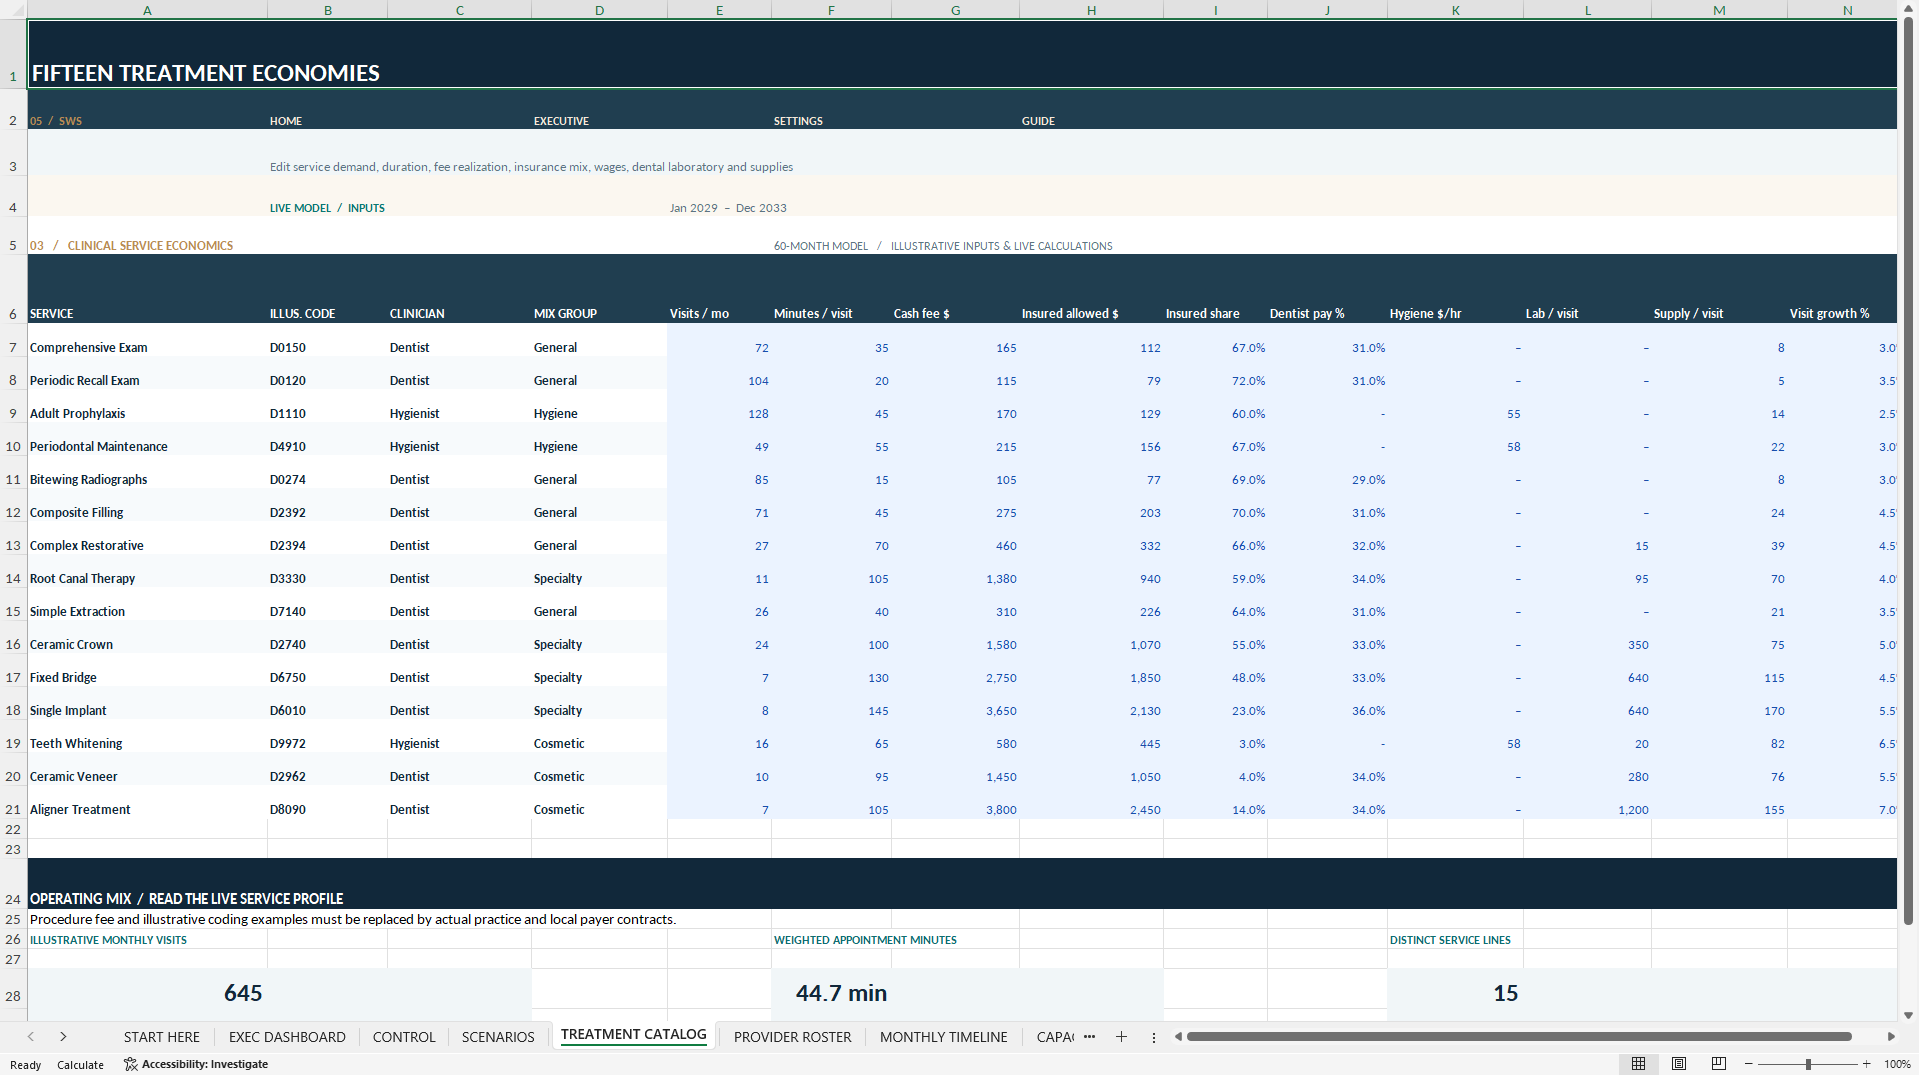
🦷 TREATMENT CATALOG & PROCEDURE ECONOMICS
Build financial projections around the services provided by a dental practice.
The TREATMENT CATALOG includes 15 editable illustrative treatment categories covering:
🪥 Preventive Dentistry & Hygiene
🦷 General Dental Treatments
🔬 Diagnostic Procedures
🛠️ Restorative Dentistry
✨ Cosmetic Dental Services
🏥 Selected Specialty Treatments
Editable treatment assumptions include:
• Monthly Procedure Demand
• Treatment Duration
• Cash and Self-Pay Prices
• Insurance Allowed Fees
• Insured Patient Volume Share
• Dentist Compensation Percentages
• Hygienist Hourly Costs
• Dental Laboratory Costs
• Clinical Supplies
• Treatment-Specific Growth Rates
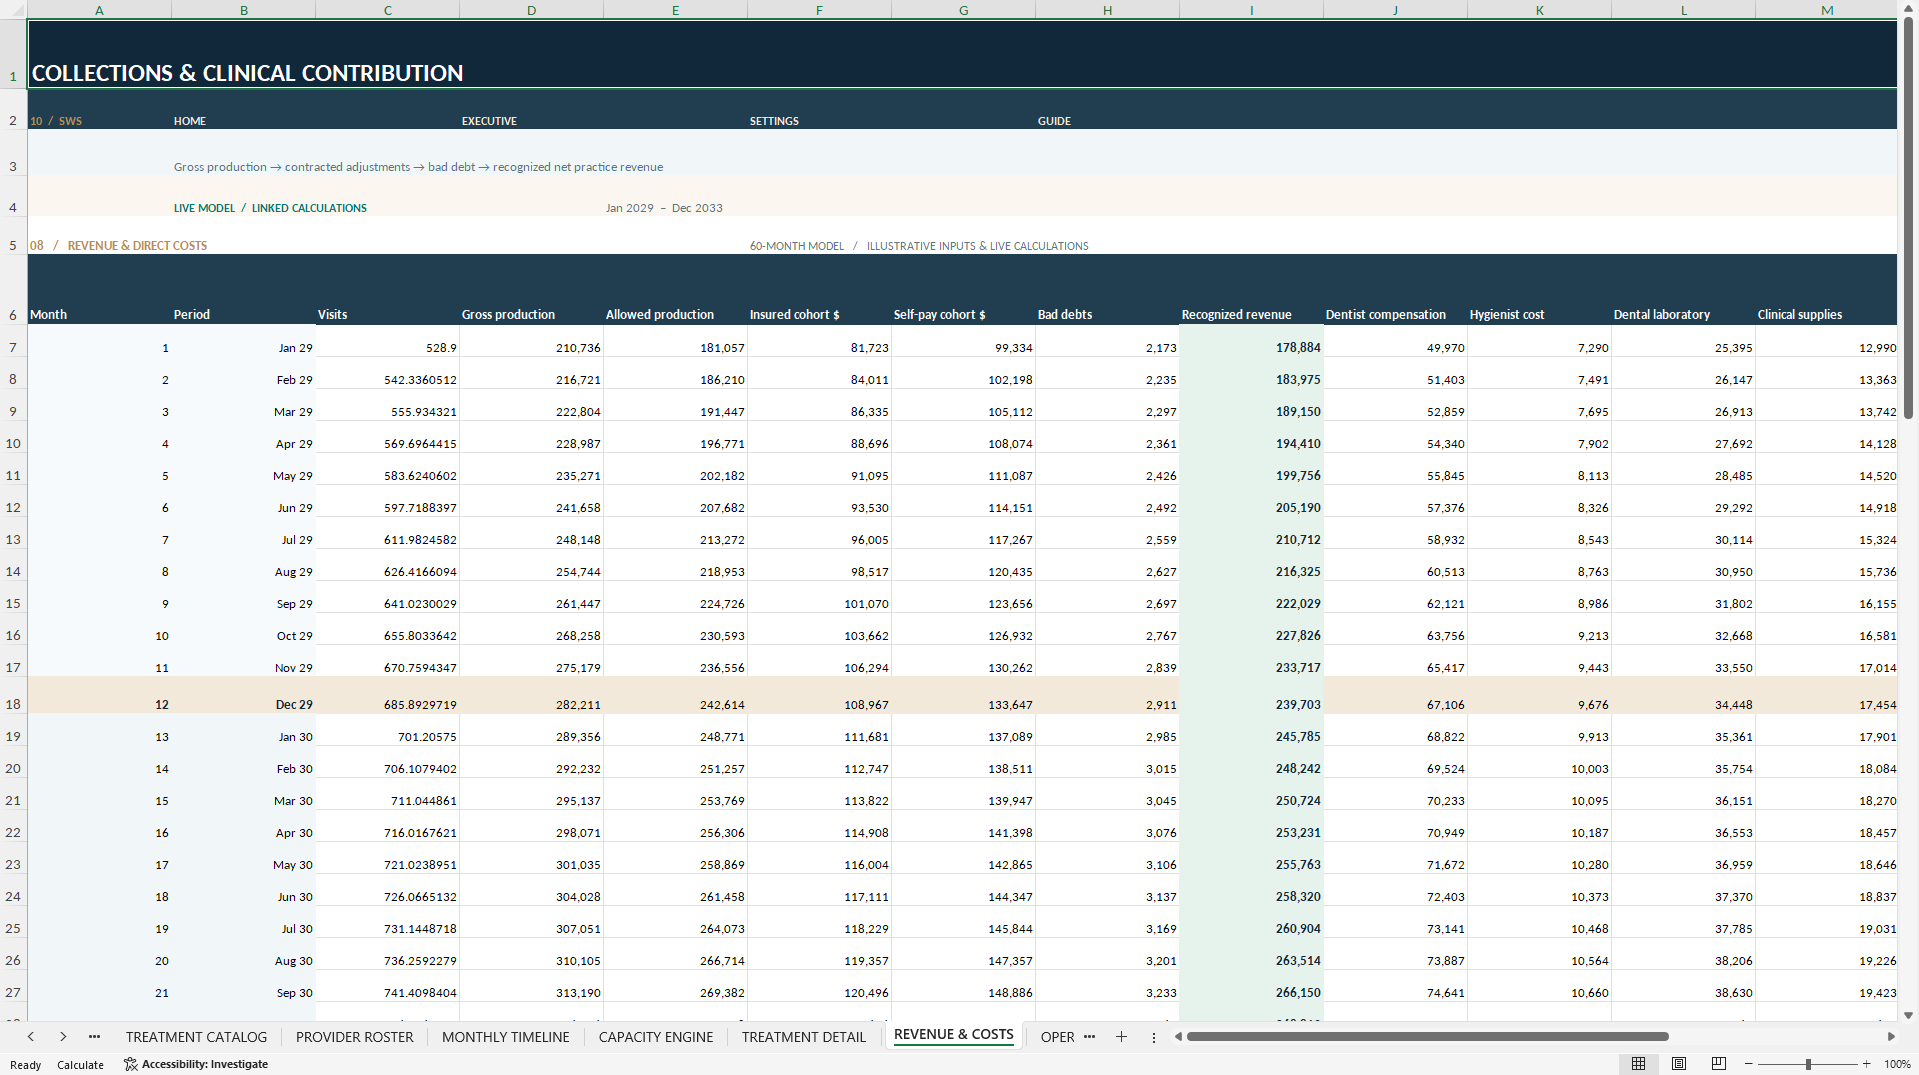
The model separates gross treatment production, blended allowed production, contractual differences, assumed bad debt and recognized revenue.
Insurance allowed fees represent simplified contracted amounts rather than actual insurer claims adjudication or payment settlement.
The treatment catalog contains 15 structurally fixed categories in this edition.
━━━━━━━━━━━━━━━━━━━━
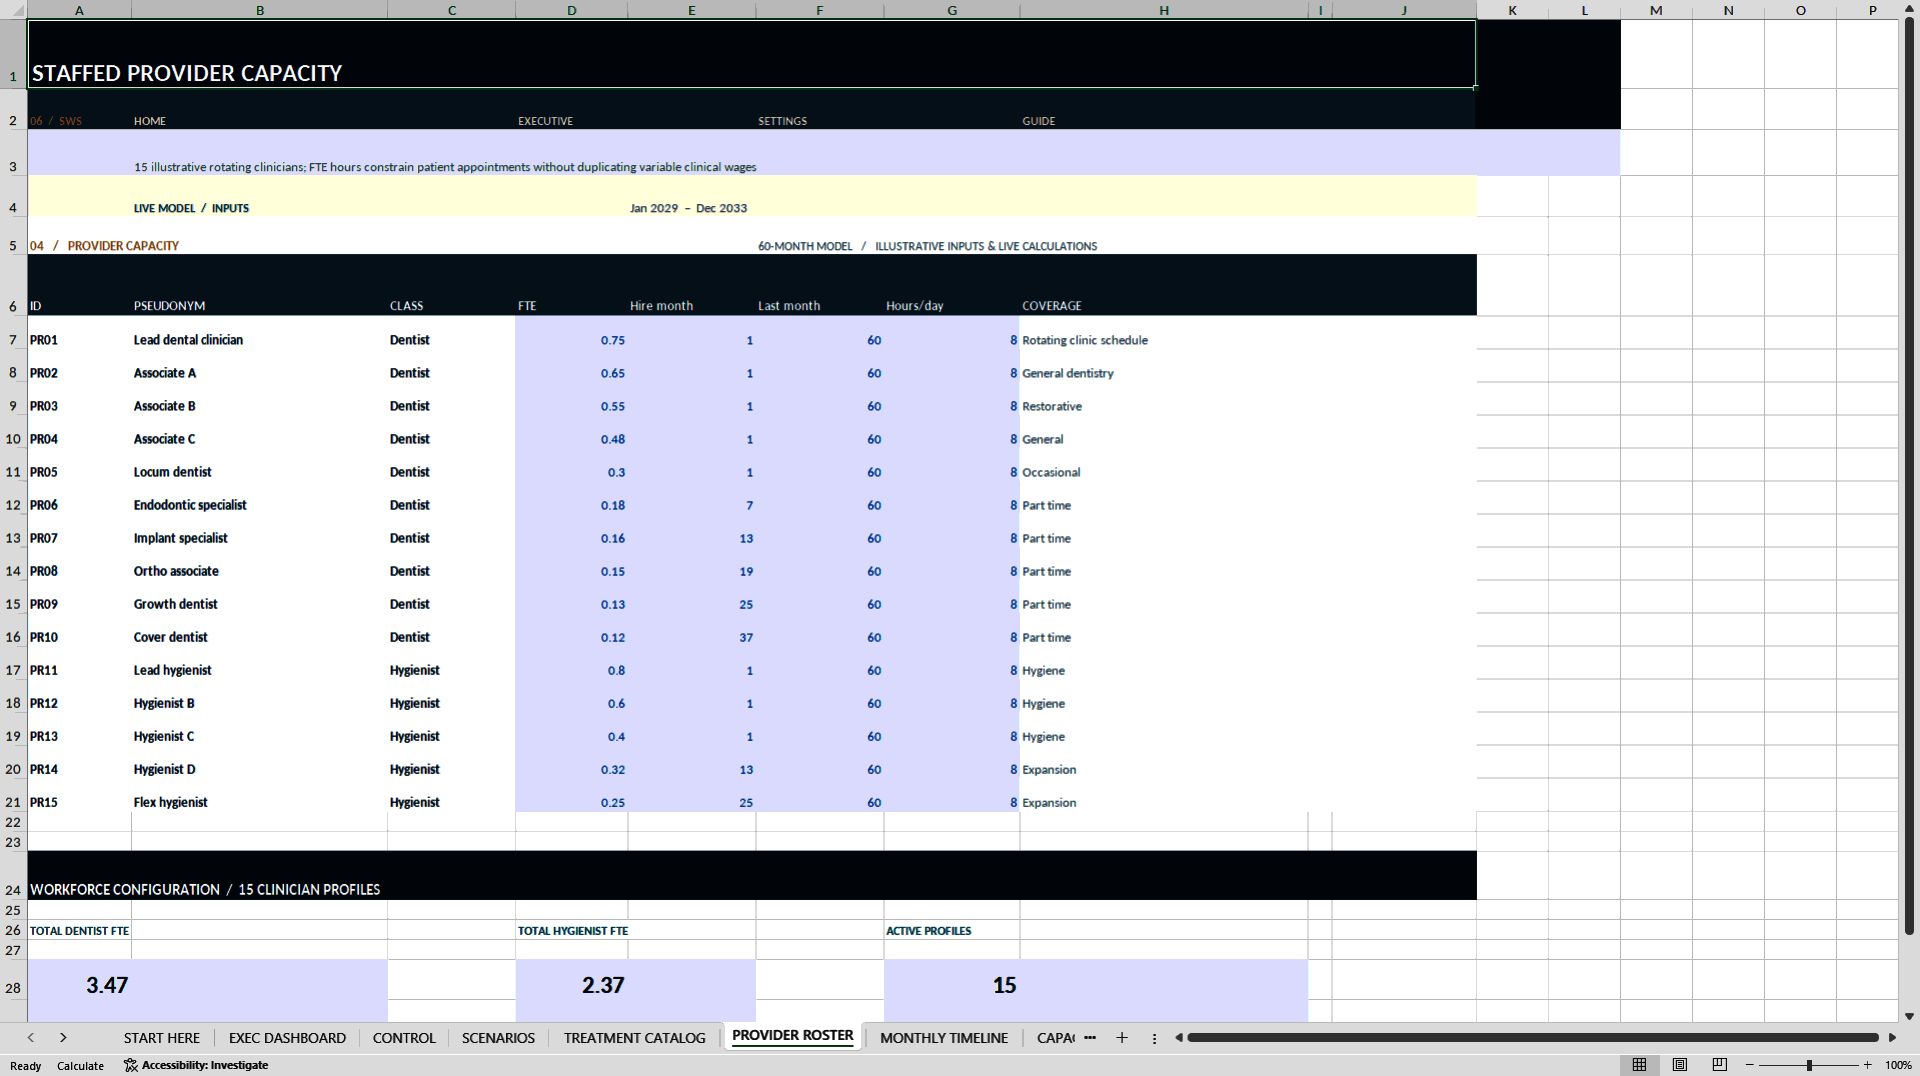
👩⚕️ PROVIDER ROSTER & CLINICAL CAPACITY
Connect treatment demand directly with available clinical resources.
The PROVIDER ROSTER contains 15 editable staff profiles.
Configure:
• Professional Classification
• Dentist and Hygienist Resources
• Full-Time Equivalent (FTE)
• Active Employment Periods
• Available Clinical Hours
• Provider Efficiency
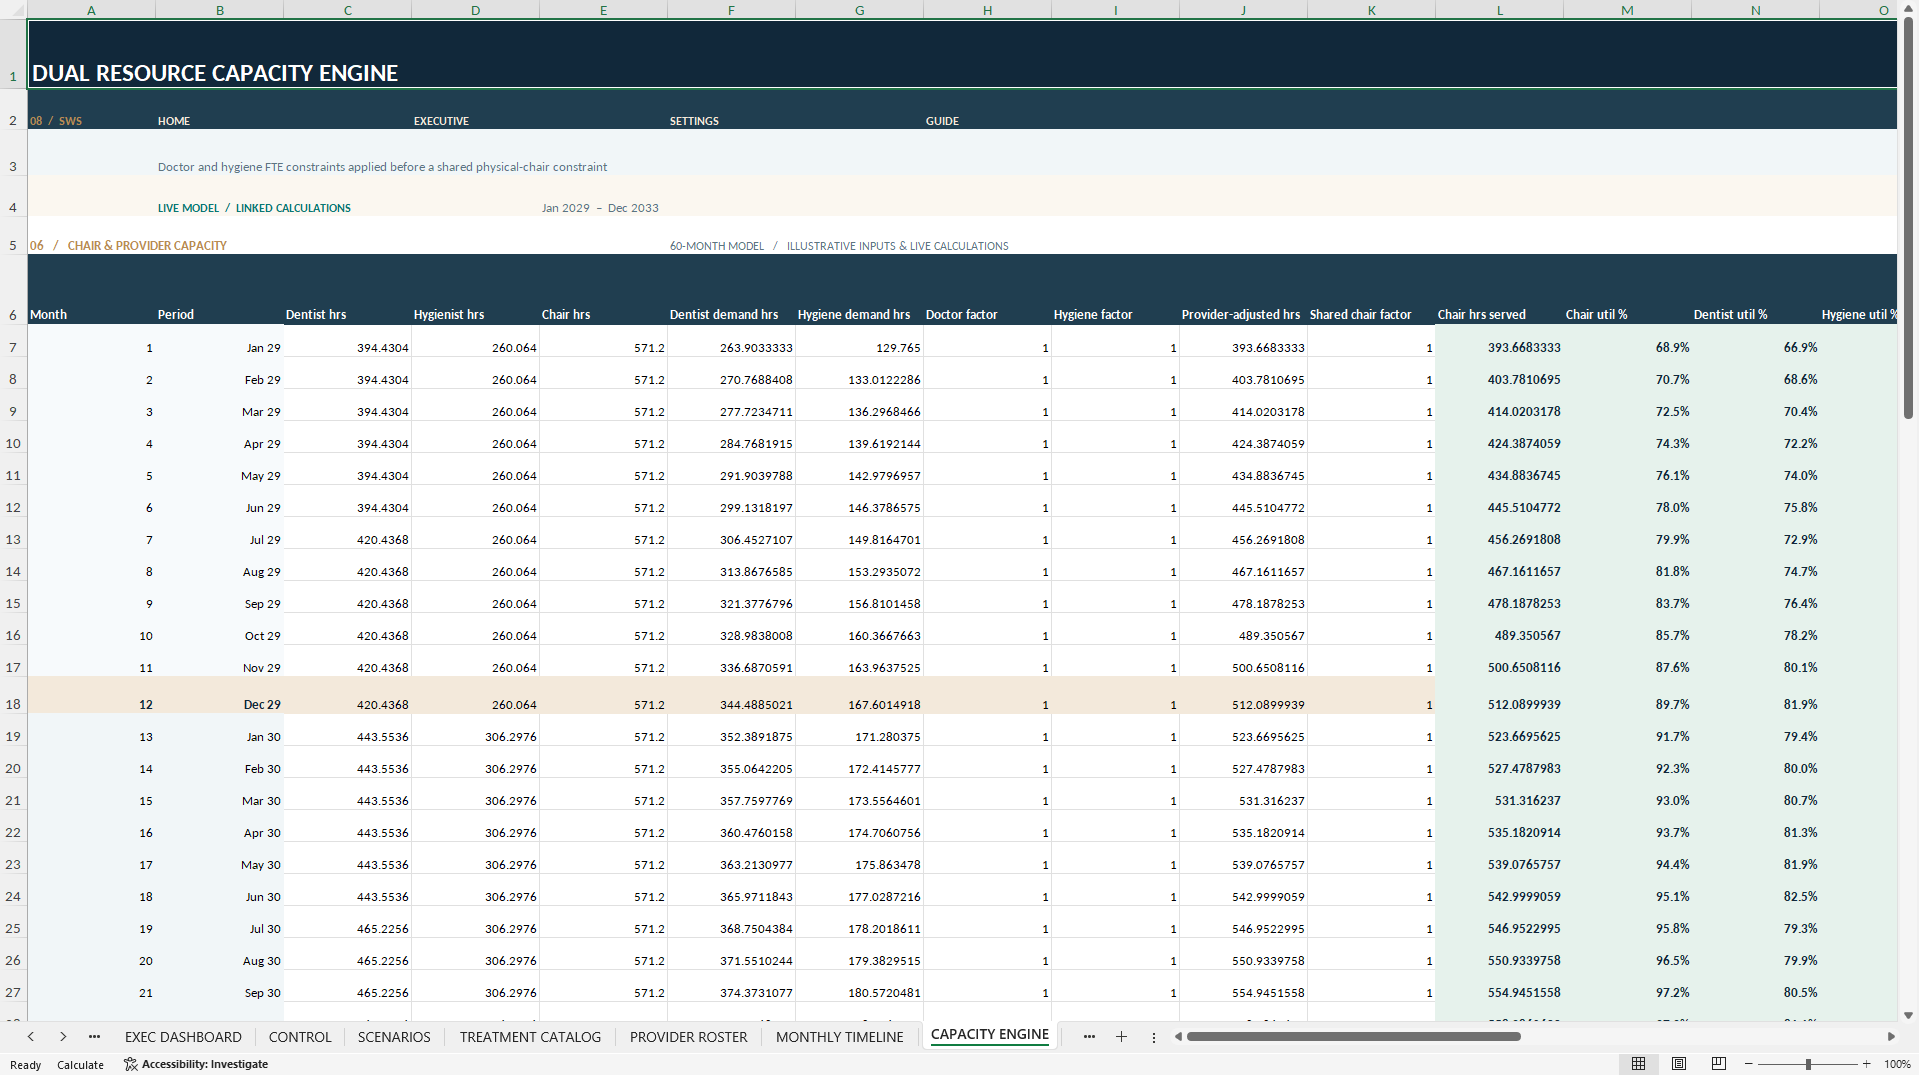
The CAPACITY ENGINE evaluates treatment activity against two operational constraints.
① CLINICIAN AVAILABILITY
Procedure volumes are first constrained by the available dentist and hygienist hours.
② SHARED TREATMENT-CHAIR CAPACITY
The model then applies the combined capacity of the available treatment chairs.
Modeled served procedures and utilization feed the connected revenue, operations and financial schedules.
This resource-envelope approach helps distinguish potential treatment demand from the volume that the modeled practice can accommodate.
The workbook is not an appointment scheduling system, electronic health record or patient management platform.
━━━━━━━━━━━━━━━━━━━━
📅 60-MONTH FORECAST & FIVE-YEAR PLANNING
Evaluate dental practice performance across 60 consecutive monthly forecast periods.
The original illustrative timeline covers January 2029 through December 2033.
The starting date can be changed in CONTROL to shift the modeled calendar.
Detailed schedules include:
• MONTHLY TIMELINE
• CAPACITY ENGINE
• TREATMENT DETAIL
• REVENUE & COSTS
• OPERATING EXPENSES
• DEBT & FINANCING
• WORKING CAPITAL
A connected ANNUAL SUMMARY consolidates operating and financial results into five reporting years.
The model includes 900 treatment-category/month calculation rows, representing 15 categories across 60 months.
Monthly treatment demand is modeled as expected volume and may contain decimal quantities.
Patient-equivalent calculations use an editable visits-per-patient assumption rather than counting identified patients.
━━━━━━━━━━━━━━━━━━━━
💰 REVENUE, DIRECT COSTS & OPERATING EXPENSES
Translate clinical activity into structured profitability projections.
Financial schedules include:
• Recognized Treatment Revenue
• Dentist Compensation
• Hygienist Labor
• Laboratory Expenses
• Clinical Consumables
• Employee Wage On-Costs
• Practice Rent
• Administrative Payroll
• Utilities
• Marketing
• Practice Software
• Other Operating Overheads
The connected calculations support analysis of revenue realization, direct treatment costs, gross profit and practice-level EBITDA.
Separate assumptions allow users to explore the interaction between treatment demand, reimbursement, staffing requirements and operating expenditure.
━━━━━━━━━━━━━━━━━━━━
🏗️ EQUIPMENT CAPEX, DEPRECIATION & FINANCING
Plan equipment investment and evaluate how financing assumptions affect dental clinic cash flow.
The model includes editable assumptions for:
• Opening Equipment and Property Assets
• Initial Expansion Capital Expenditure
• Annual Equipment CAPEX
• Asset Depreciation
• Existing Debt
• New Equipment Financing
• Interest Rates
• Loan Repayment Terms
• Owner Distributions
The debt schedule models simplified interest, scheduled principal repayments and debt service.
Accounts receivable, supplies inventory and supplier payables are connected to operating cash flow through the working capital schedule.
Financing calculations are simplified planning conventions rather than lender-specific underwriting models.
━━━━━━━━━━━━━━━━━━━━
🏦 THREE INTEGRATED FINANCIAL STATEMENTS
Follow operational activity through a complete monthly financial forecasting framework.
📄 INCOME STATEMENT
Analyze recognized revenue, clinical costs, gross profit, operating expenses, EBITDA, depreciation, interest, taxes and net income.
💵 CASH FLOW STATEMENT
Review operating cash generation, working capital, capital expenditure, financing movements, loan repayment, distributions and ending cash.
🏛️ BALANCE SHEET
Monitor cash, receivables, inventory, fixed assets, financial debt, supplier liabilities and equity.
The three connected statements support monthly financial analysis and feed the annual management summary.
━━━━━━━━━━━━━━━━━━━━
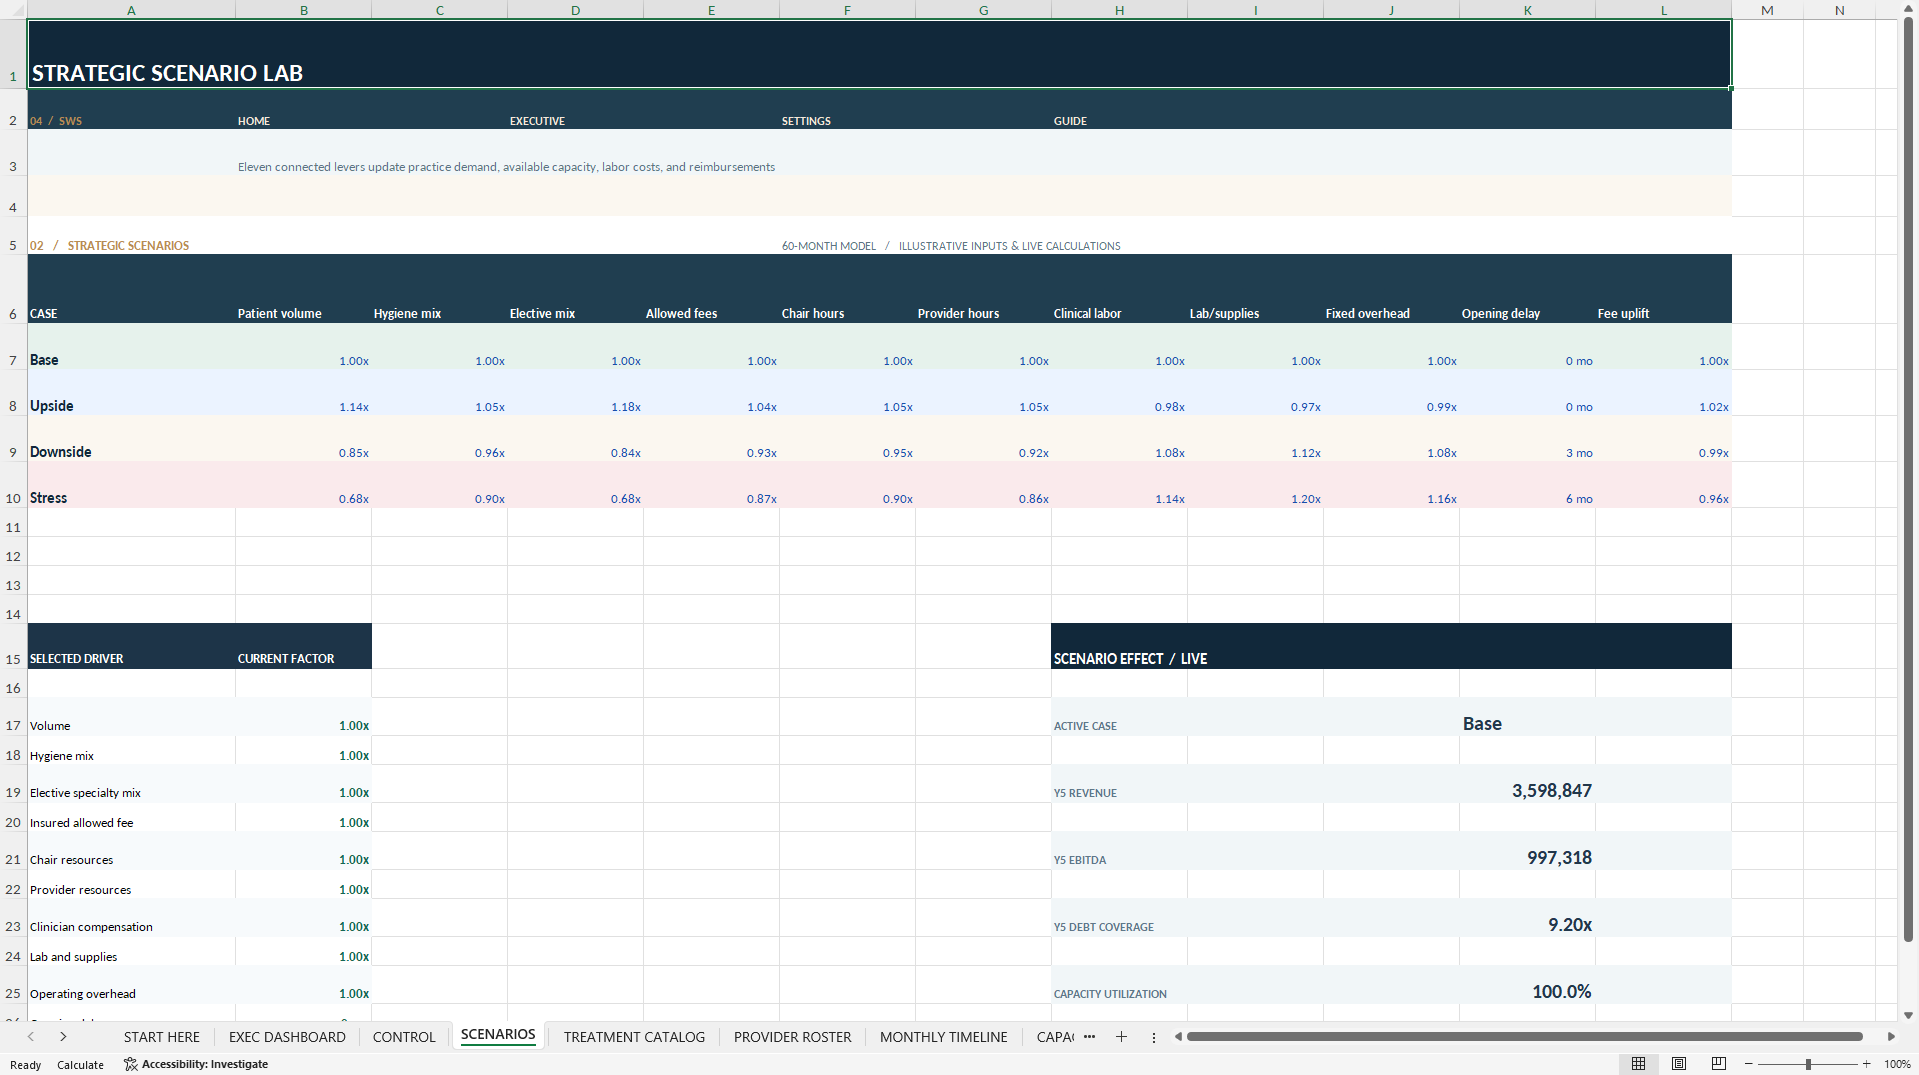
🔀 FOUR LINKED OPERATING SCENARIOS
Explore alternative clinic performance assumptions without maintaining separate copies of the financial model.
Select one of four scenarios in CONTROL:
🟢 BASE
Reference clinical, commercial and operating assumptions.
🔵 UPSIDE
More favorable modeled operating conditions.
🟠 DOWNSIDE
Adverse assumptions affecting clinical demand and profitability.
🔴 STRESS
A more severe set of operating and financial conditions.
Scenario drivers include:
• Patient and Procedure Demand
• Treatment Pricing
• Insured Allowance Levels
• Dentist and Hygienist Resources
• Treatment-Chair Capacity
• Procedure Mix
• Selected Clinical Costs
• Overhead Expenditure
• Launch Timing
The selected scenario recalculates the connected monthly operating schedules and financial statements.
Only one scenario is active at a time. The workbook does not maintain four independently stored complete forecasts simultaneously.
━━━━━━━━━━━━━━━━━━━━
📈 DCF VALUATION & BUSINESS INVESTMENT ANALYSIS
Evaluate an illustrative dental practice valuation using financial projections and editable valuation assumptions.
The VALUATION worksheet includes:
• Five-Year Unlevered Free Cash Flow
• Discounted Cash Flow (DCF)
• Editable Weighted Average Cost of Capital (WACC)
• Terminal Growth Assumptions
• Terminal Enterprise Value
• Illustrative EBITDA Exit Multiple
• Enterprise-to-Equity Value Bridge
• Opening Net Debt Adjustment
The model provides two illustrative enterprise valuation approaches.
① DCF-BASED VALUATION
Discount projected annual unlevered cash flows and a modeled terminal value using the selected discount rate.
② EBITDA EXIT MULTIPLE
Apply an editable valuation multiple to the modeled final-year EBITDA.
A separate SENSITIVITY worksheet provides a 5 × 5 matrix comparing valuation outcomes under different WACC and perpetual growth assumptions.
These calculations are simplified analytical estimates, not certified dental practice appraisals or purchase-price recommendations.
━━━━━━━━━━━━━━━━━━━━
✅ MODEL CHECKS & FINANCIAL CONTROLS
A dedicated MODEL CHECKS worksheet provides internal reconciliation across all 60 forecast months.
Implemented checks address:
✓ Monthly Balance Sheet Reconciliation
✓ Cash Movement Consistency
✓ Debt Balance Roll-Forward
✓ Fixed Asset Roll-Forward
✓ Clinical Capacity Constraints
✓ Treatment Revenue Relationships
✓ Input Integrity
✓ Operational Hours
✓ Selected Financial Statement Links
Financial liquidity warnings should be assessed alongside the hard-formula checks.
⚠️ IMPORTANT CASH FLOW DISCLOSURE
The original fictional model assumptions contain liquidity pressure in selected scenarios.
Base and Upside fall below the configured USD 100,000 minimum cash reserve at least once.
The supplied scenario documentation also identifies:
• Downside: 10 Negative-Cash Months
• Stress: 56 Negative-Cash Months
These scenario counts are documented model outcomes, not independently reverified desktop recalculation results.
Negative cash balances and reserve shortfalls represent financing risks requiring further investigation.
They are not automatically eliminated through artificial additional borrowing.
A structural model-check PASS does not guarantee adequate liquidity or commercial viability.
━━━━━━━━━━━━━━━━━━━━
📦 WHAT'S INCLUDED
📗 1 EDITABLE EXCEL FINANCIAL MODEL (.XLSX)
25 organized worksheets:
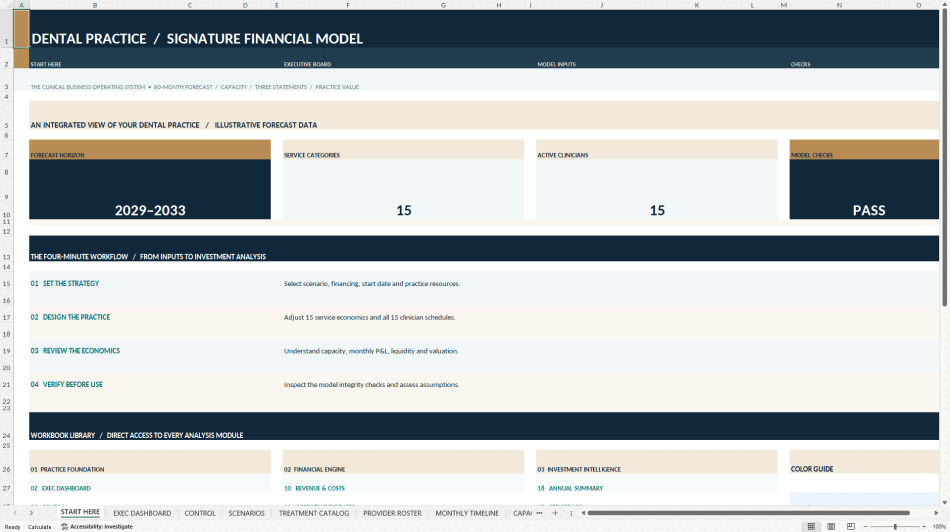
01 – START HERE
02 – EXEC DASHBOARD
03 – CONTROL
04 – SCENARIOS
05 – TREATMENT CATALOG
06 – PROVIDER ROSTER
07 – MONTHLY TIMELINE
08 – CAPACITY ENGINE
09 – TREATMENT DETAIL
10 – REVENUE & COSTS
11 – OPERATING EXPENSES
12 – CAPEX & DEPRECIATION
13 – DEBT & FINANCING
14 – WORKING CAPITAL
15 – INCOME STATEMENT
16 – CASH FLOW
17 – BALANCE SHEET
18 – ANNUAL SUMMARY
19 – SERVICE MIX
20 – VALUATION
21 – SENSITIVITY
22 – MODEL CHECKS
23 – CHART DATA
24 – USER GUIDE
25 – SOURCE NOTES
📘 1 PROFESSIONAL HOW-TO-USE PDF GUIDE
40 pages of English documentation covering:
• Model Setup and Navigation
• Editable Inputs and Assumptions
• Treatment Catalog
• Provider and Chair Capacity
• Reimbursement Conventions
• Revenue Recognition
• Clinical and Operating Costs
• Equipment CAPEX and Depreciation
• Debt and Financing
• Working Capital
• Integrated Financial Statements
• Scenario Selection
• DCF Valuation and Sensitivity
• Internal Model Checks
• Cash Flow Warnings
• Limitations and Troubleshooting
━━━━━━━━━━━━━━━━━━━━
🧭 HOW TO USE THE MODEL
① CONFIGURE YOUR PRACTICE
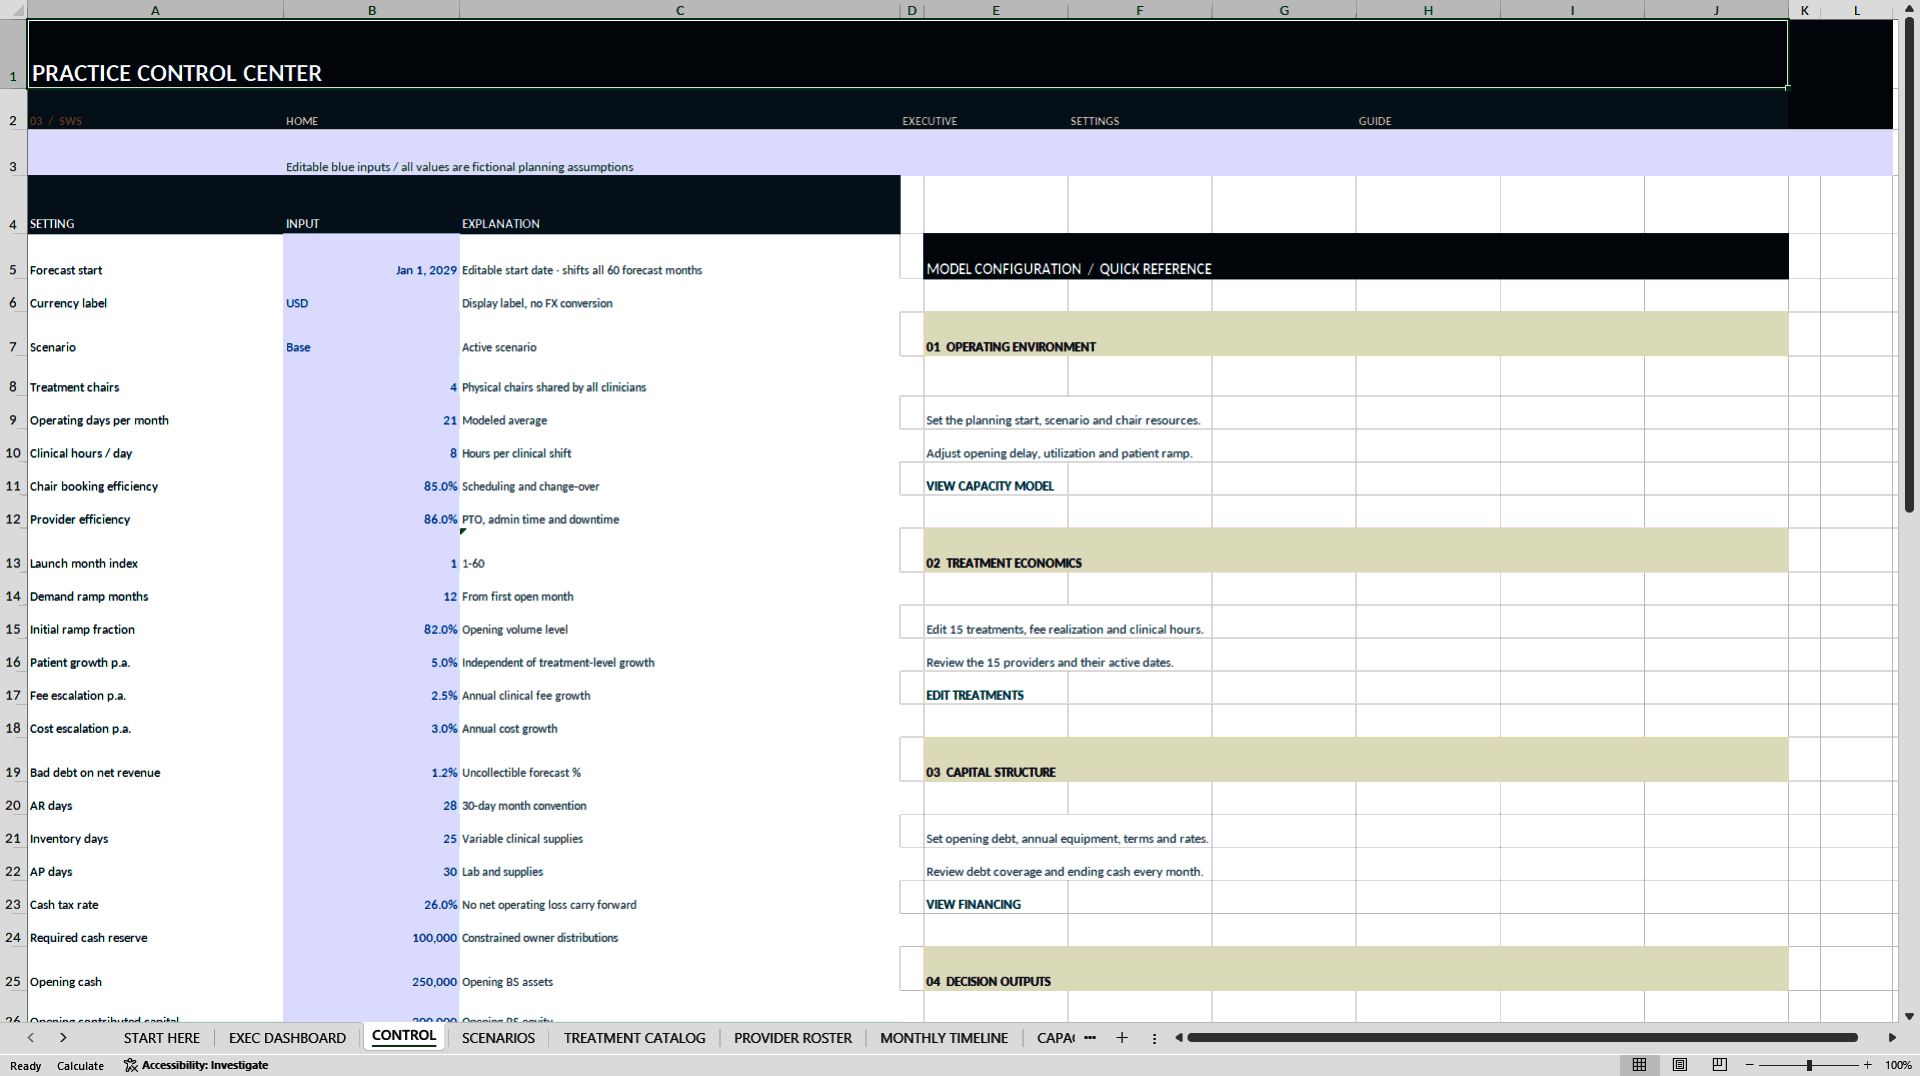
Save a working copy, open START HERE and enter the operating assumptions in CONTROL.
② CUSTOMIZE TREATMENTS & PROVIDERS
Replace fictional treatment fees, demand volumes, clinical costs, staffing profiles and capacity assumptions.
③ SELECT AN OPERATING SCENARIO
Choose Base, Upside, Downside or Stress.
④ REVIEW FINANCIAL PROJECTIONS
Examine the capacity calculations, treatment results, monthly financial statements, debt schedules and annual summary.
⑤ ANALYZE FINANCIAL RISKS & VALUATION
Review the executive dashboard, model checks, liquidity warnings, DCF valuation and sensitivity analysis.
Consult the accompanying 40-page guide for detailed explanations and model conventions.
━━━━━━━━━━━━━━━━━━━━
🎯 WHO IS THIS MODEL FOR?
Suitable for:
• Dental Practice Owners
• Dental Clinic Founders
• Dental Business Consultants
• Healthcare Finance Analysts
• Dental Practice Management Advisers
• Financial Modeling Professionals
• Healthcare Entrepreneurs
• Business Valuation Analysts
• Healthcare Finance Educators
━━━━━━━━━━━━━━━━━━━━
⚙️ TECHNICAL SPECIFICATIONS
📅 Forecast Horizon: 60 Monthly Periods
🗓️ Illustrative Timeline: January 2029 – December 2033
📗 Excel Worksheets: 25
🦷 Treatment Categories: 15
👩⚕️ Sample Provider Profiles: 15
📋 Treatment Calculation Rows: 900
📊 Native Dashboard Charts: 8
🔀 Linked Operating Scenarios: 4
🏦 Financial Statements: Income Statement, Cash Flow Statement and Balance Sheet
📈 Valuation: DCF, Terminal Growth, EBITDA Exit Multiple and 5 × 5 Sensitivity Matrix
📘 Documentation: 40-Page English PDF Guide
💻 Format: Editable Microsoft Excel .xlsx
🔒 VBA Macros: None
🔗 Live External Data Connections: None
Microsoft Excel Desktop is the reference spreadsheet environment.
Independent desktop recalculation and Google Sheets import compatibility have not been verified.
The currency label is editable but does not automatically convert monetary values.
━━━━━━━━━━━━━━━━━━━━
🛡️ IMPORTANT INDEPENDENT TEMPLATE DISCLAIMER
This product is an independent, unofficial financial-planning template developed by SheetworksStudio.
All example treatment demand, reimbursement, clinical capacity, operating expenses and financial projections are fictional and illustrative.
The workbook is not an electronic health record, insurance claims processing system, appointment scheduling platform, certified practice valuation, independently audited financial forecast or lender-approved financial model.
Simplified reimbursement, clinical compensation, tax, working capital, financing and valuation assumptions must be adapted to individual practice circumstances and applicable regulations.
No clinical performance, patient demand, revenue, profitability or investment return is guaranteed.
This template does not constitute individualized medical, accounting, legal, tax, investment or financial advice.
Independent professional review is necessary before making actual business or investment decisions.
━━━━━━━━━━━━━━━━━━━━
🦷 CONNECT CLINICAL OPERATIONS. UNDERSTAND FINANCIAL PERFORMANCE. EVALUATE PRACTICE VALUE.
Bring treatment economics, clinical capacity, operating cash flow and long-term valuation together in one comprehensive five-year dental practice financial planning system.
Got a question about the product? Email us at support@flevy.com or ask the author directly by using the "Ask the Author a Question" form. If you cannot view the preview above this document description, go here to view the large preview instead.
Source: Best Practices in Dental Services, Integrated Financial Model Excel: Dental Practice Financial Model - 60-Month Forecast Excel (XLSX) Spreadsheet, SheetworksStudio
ABOUT THE AUTHOR

SheetworksStudio creates premium Excel-based business templates, dashboards, trackers, financial models, and management systems for professionals, consultants, entrepreneurs, and organizations.
Our portfolio covers finance, project management, operations, risk management, compliance, AI governance, HR, supply chain, performance management, and business planning. Each product is designed to
... [read more]
Ask the Author a Question
You must be logged in to contact the author.