
 Click main image to view in full screen. Unlock all 22 preview images:
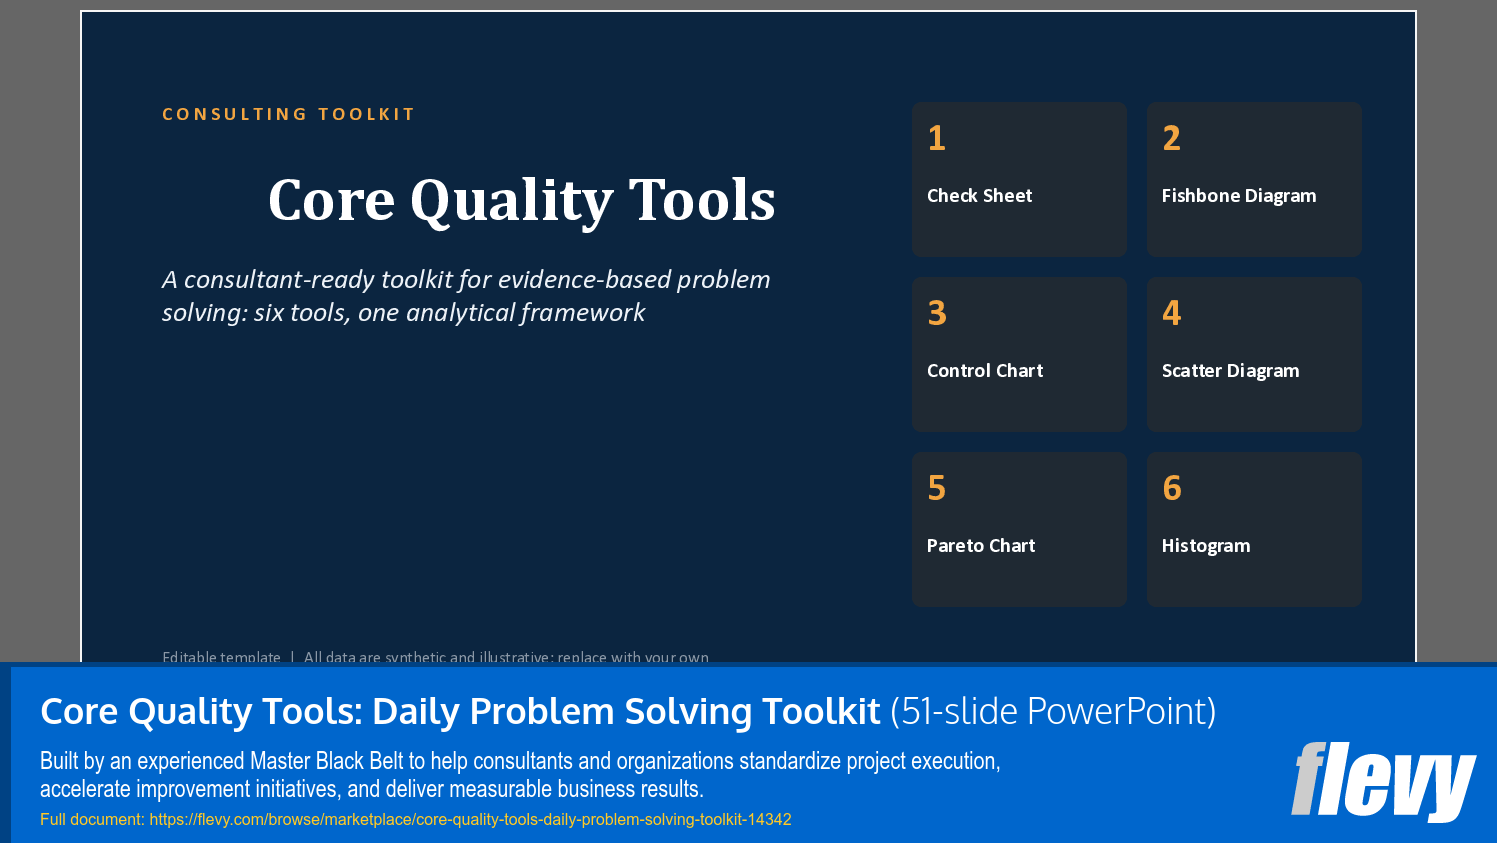
Core Quality Tools: Daily Problem Solving Toolkit – PowerPoint PPTX Template
PowerPoint (PPTX) 51 Slides


BENEFITS OF THIS DOWNLOADABLE POWERPOINT DOCUMENT
- Provides teams and coaches with a repeatable five-level analytical framework and explicit interpretation guardrails so conclusions hold up under scrutiny.
- Provides worked examples, failure-mode checklists, and a cross-industry translation guide to speed up real-world problem solving across operations.
- Includes an end-to-end workflow, capability scoring rubric, 90-minute session guide, and 12-week rollout plan to build lasting team capability.
PROBLEM SOLVING PPT TEMPLATE DESCRIPTION
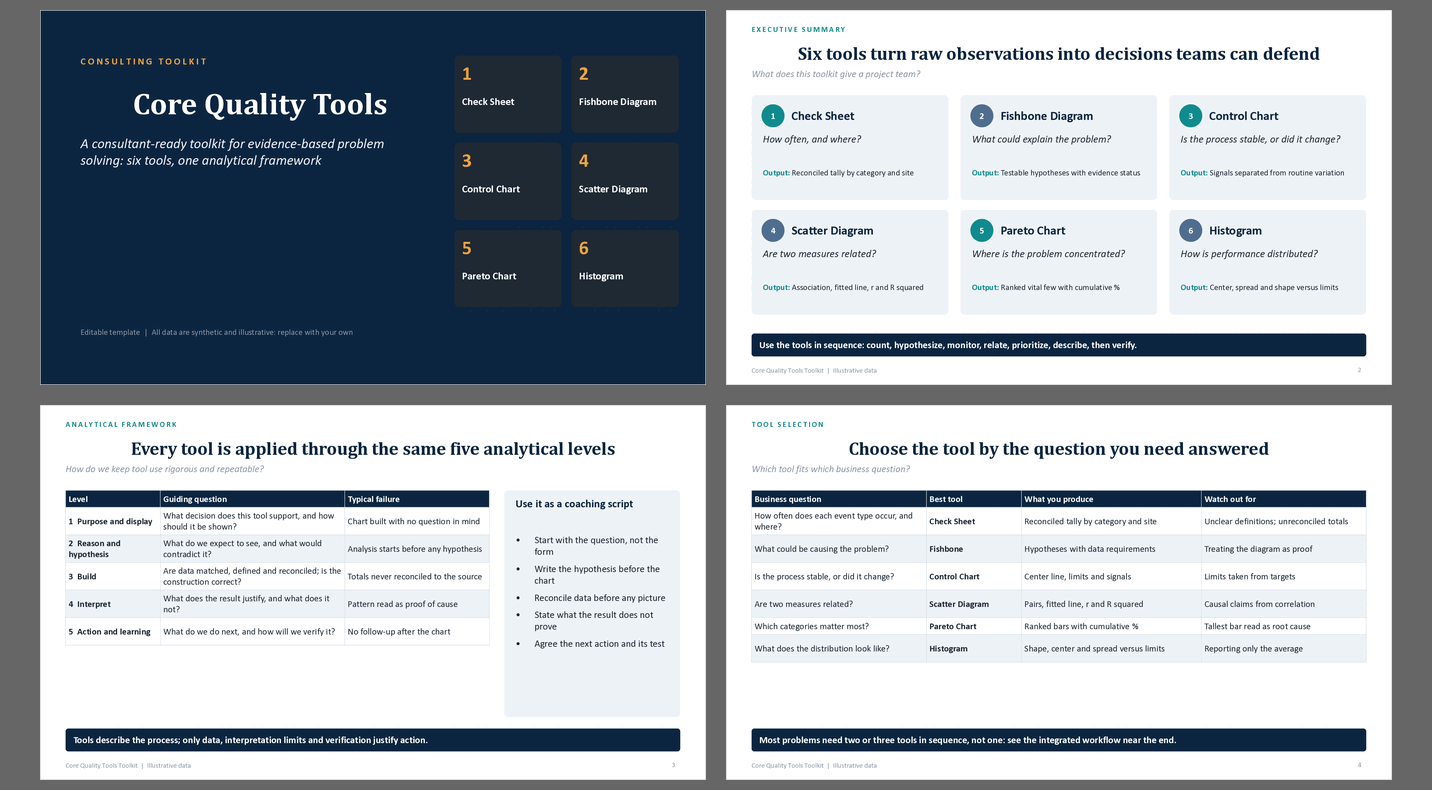
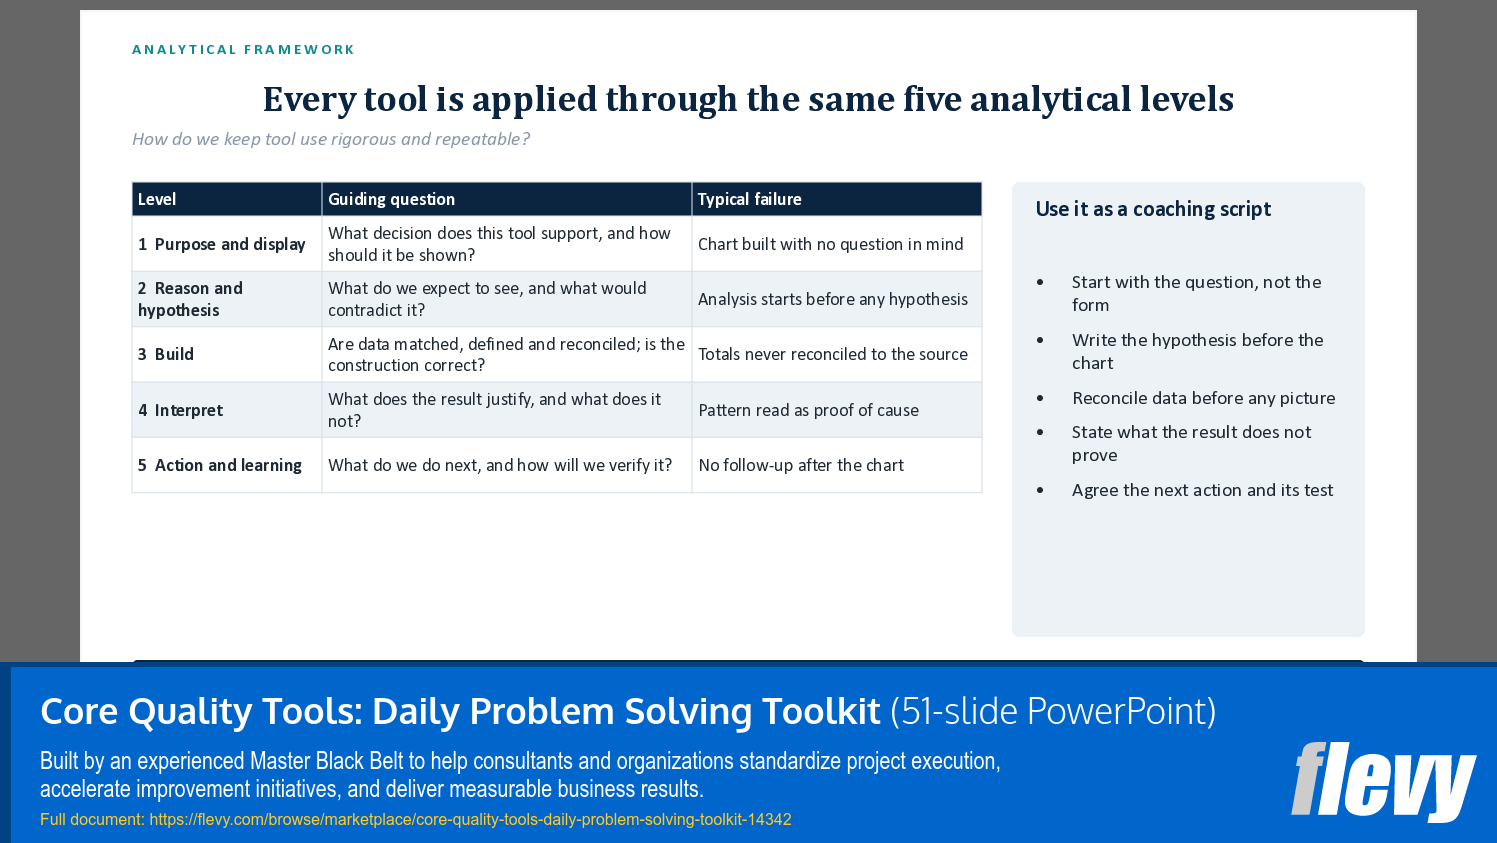
Every tool in this presentation is structured around five repeatable analytical levels: Purpose and Display, Reason and Hypothesis, Build, Interpret, and Action and Learning.
Teams start by defining the decision and writing down a hypothesis before building a visual, reconcile their underlying data, state clearly what a chart does and does not prove, and tie next steps to concrete verification.
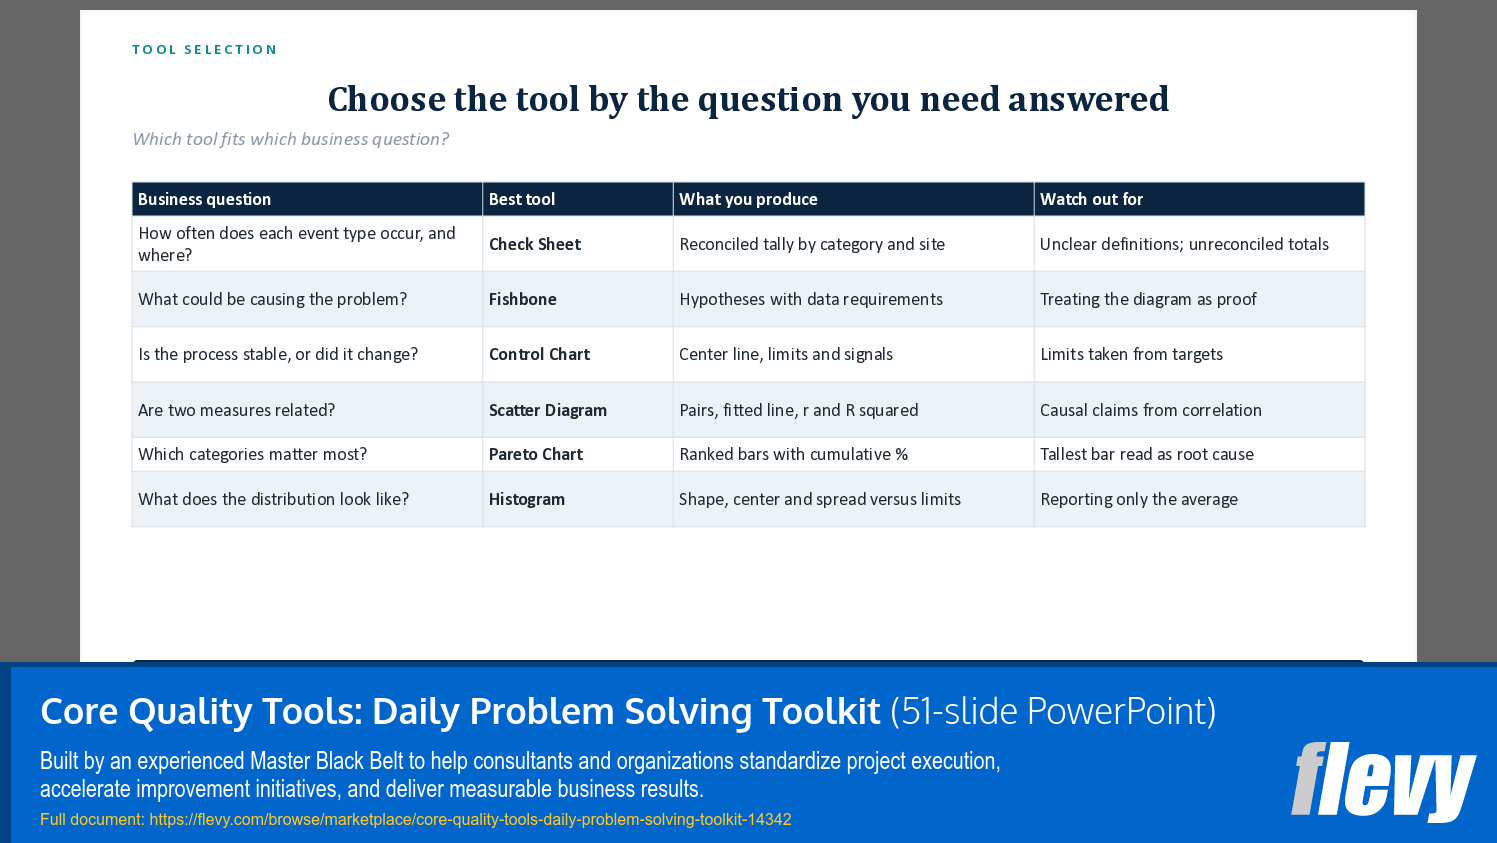
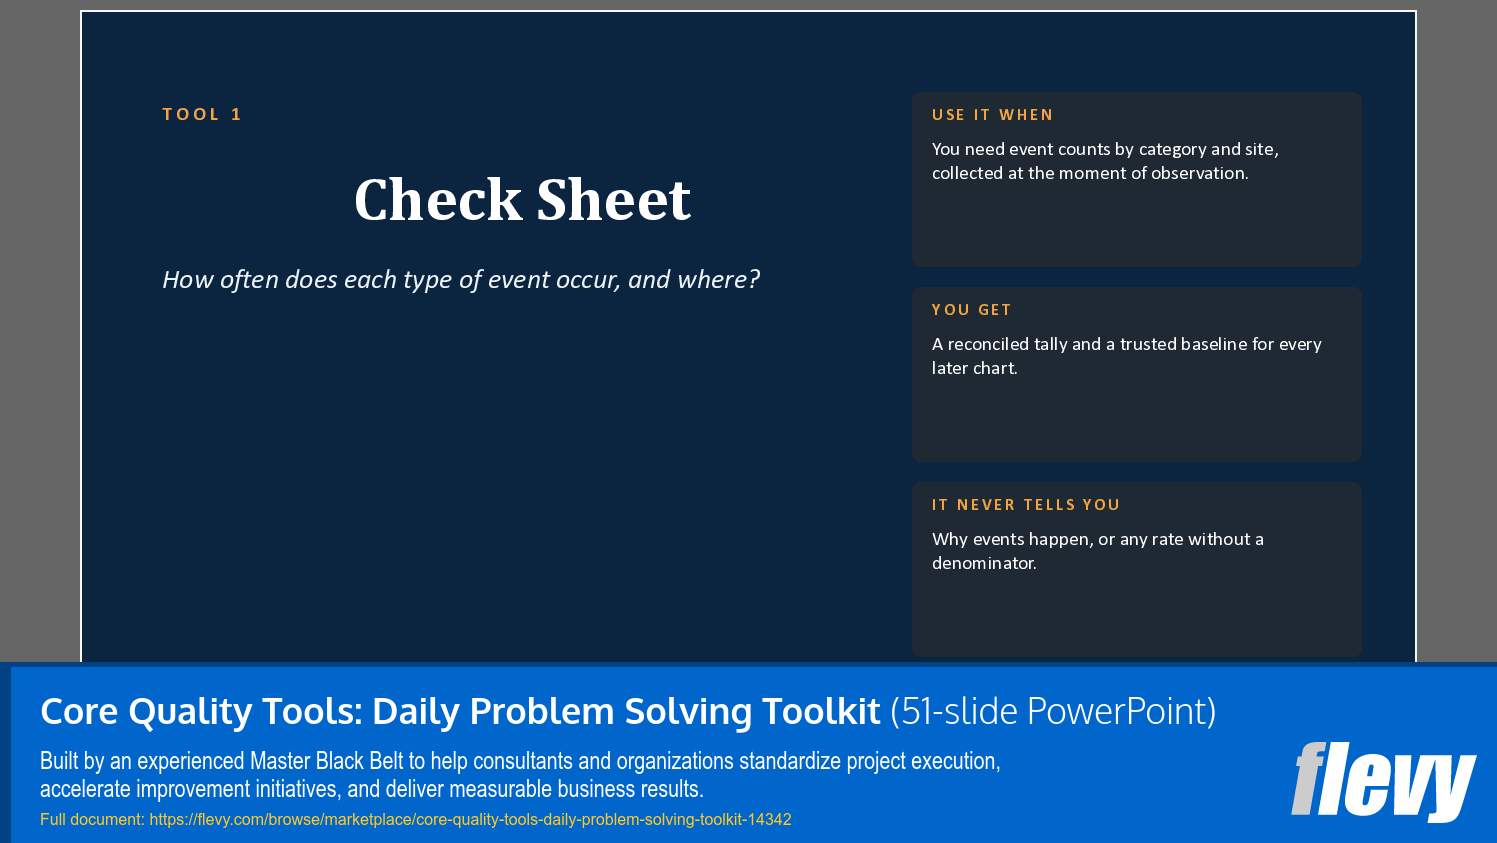
Failure-mode tables and "what this tool never tells you" callouts help prevent common analytical traps such as treating correlation as causation, reading a Pareto ranking as a root cause, confusing control limits with customer specification limits, or tampering with routine variation.
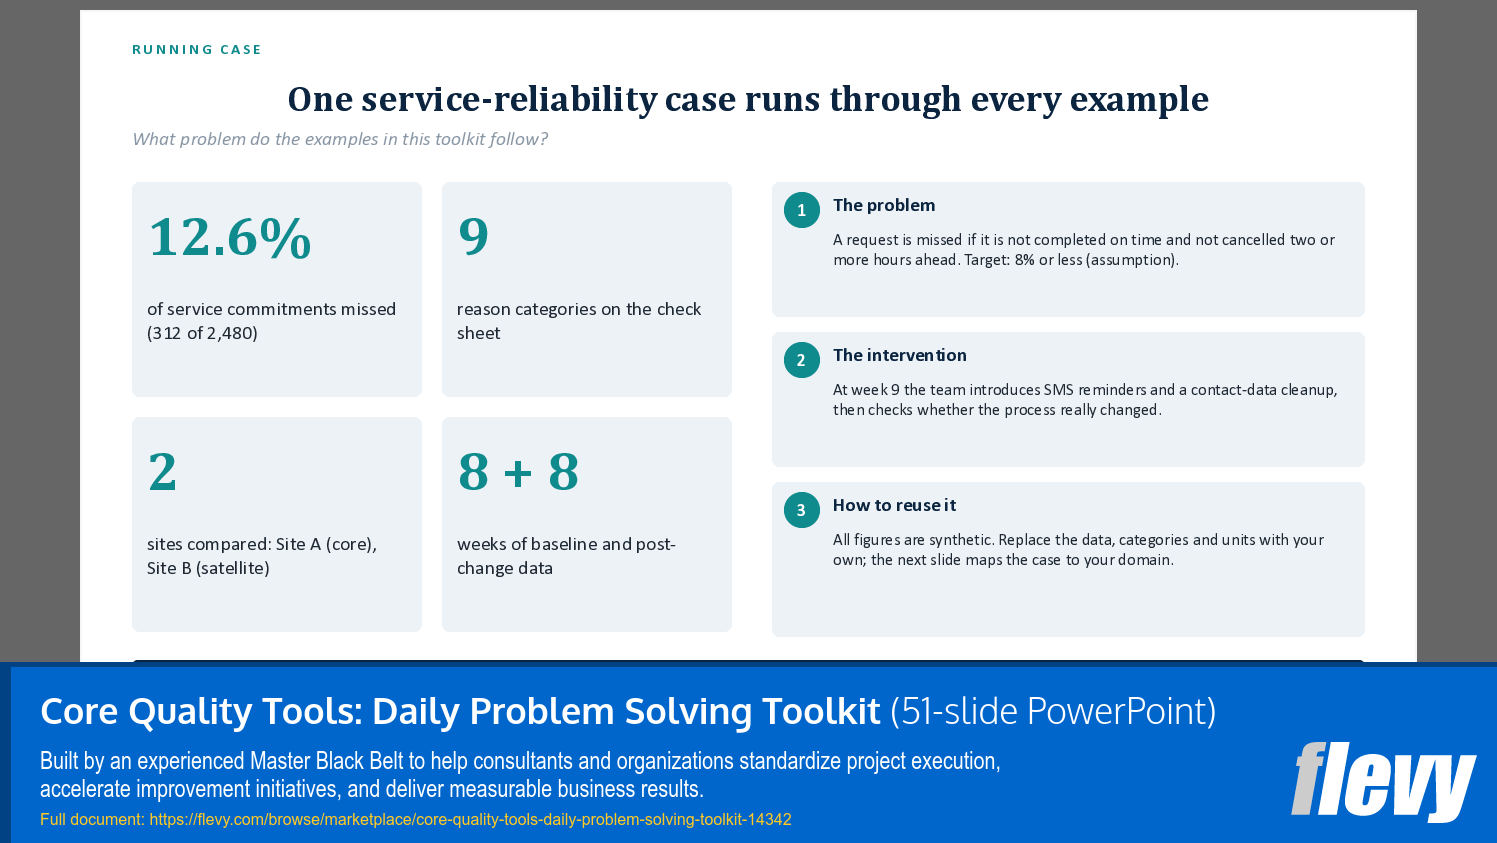
To make the methodology easy to apply right away, the deck follows one end-to-end running case with synthetic data across eight baseline weeks and eight post-change weeks.
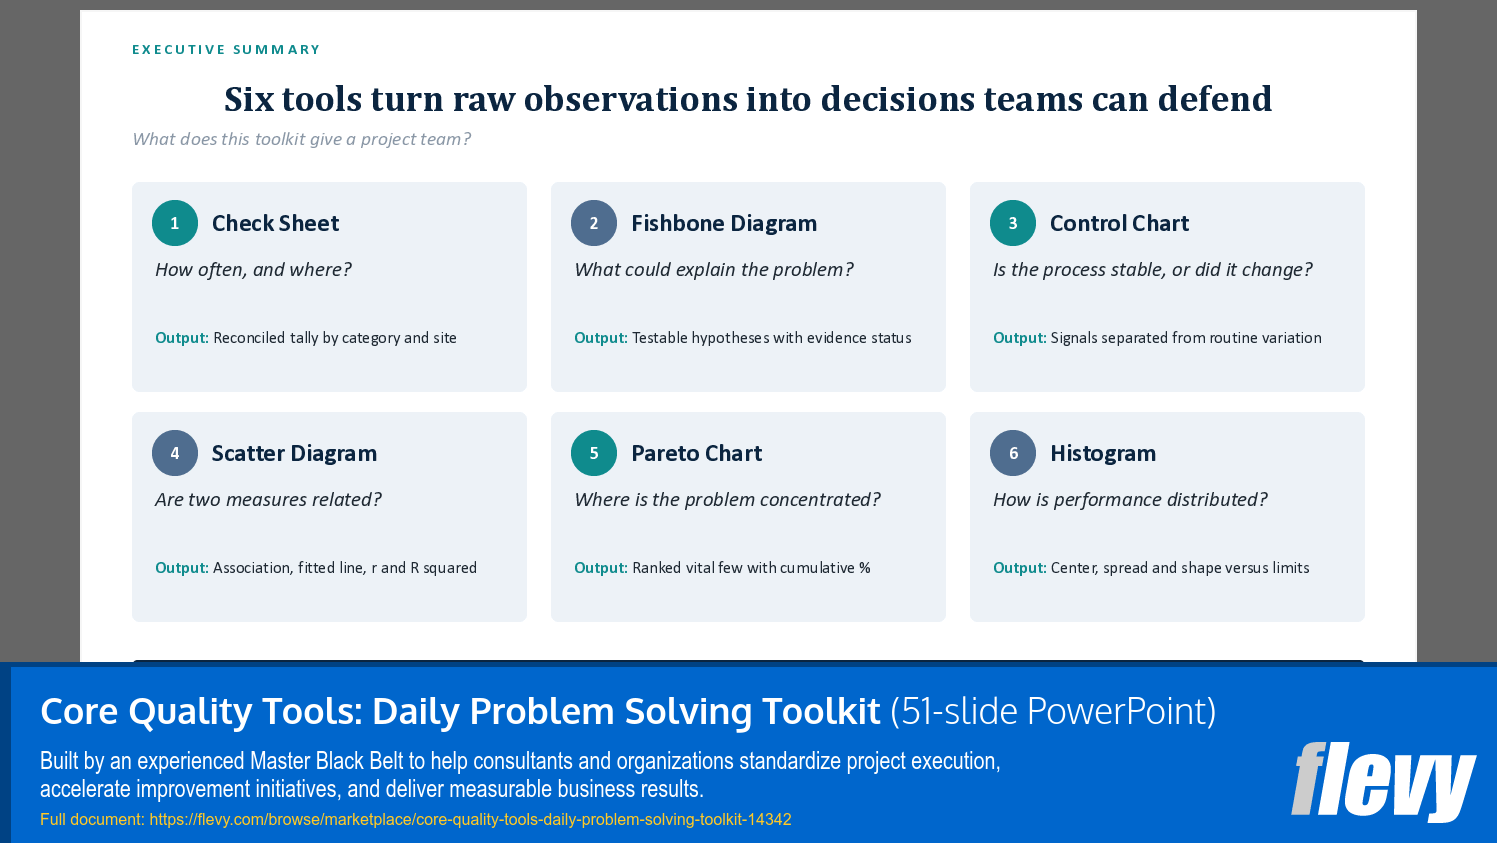
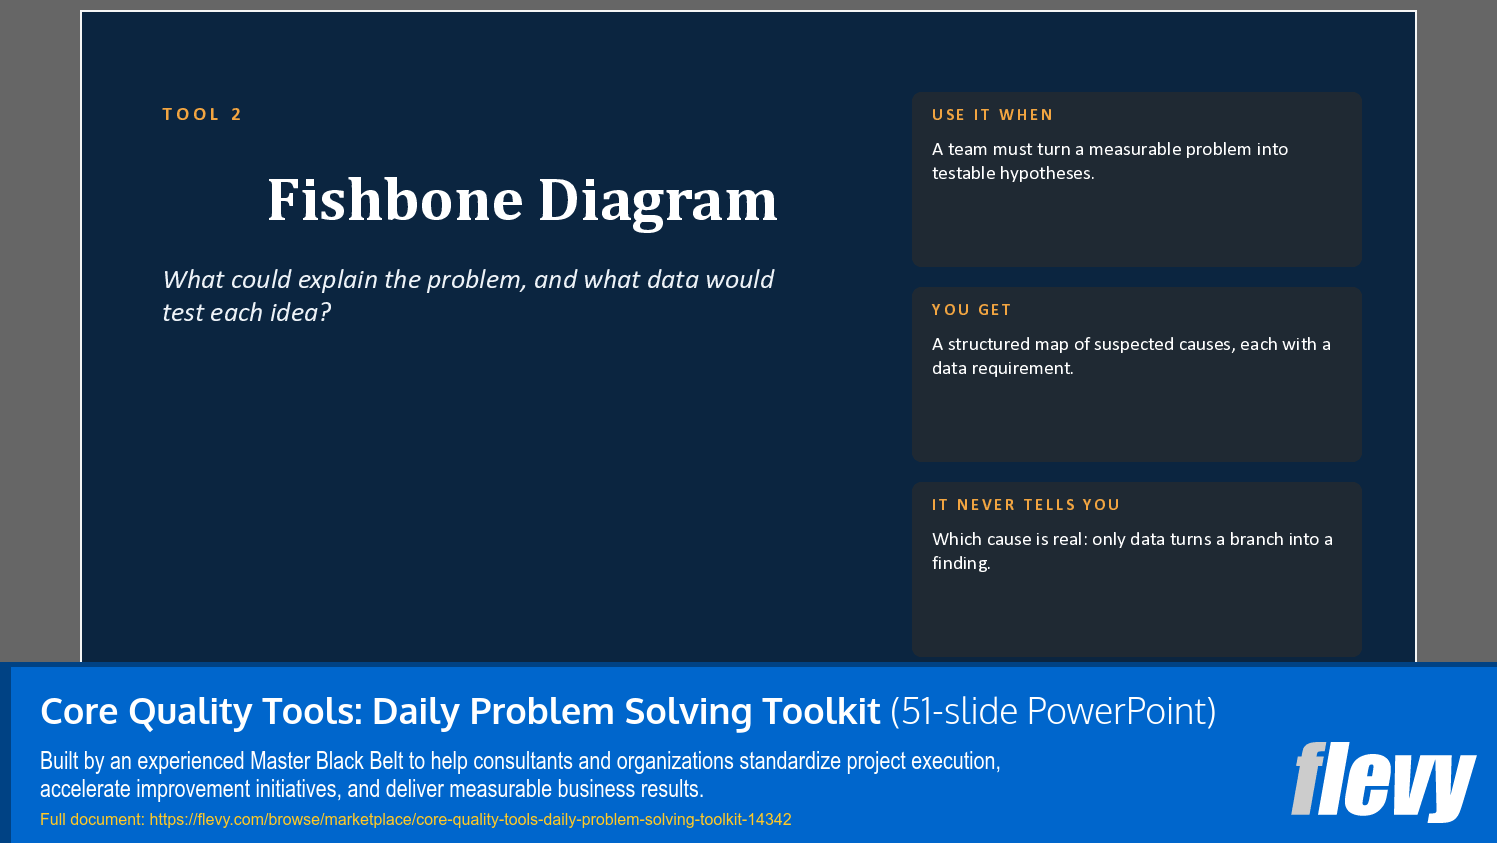
Worked examples walk through three-way check sheet reconciliation, cause-validation matrices and successive "whys" on a fishbone diagram, Individuals and Moving Range (I-MR) and attribute/defect control chart selection, correlation and regression mechanics, weighted and stratified Pareto analysis, and distribution shape and standard deviation checks on histograms.
Got a question about the product? Email us at support@flevy.com or ask the author directly by using the "Ask the Author a Question" form. If you cannot view the preview above this document description, go here to view the large preview instead.
Source: Best Practices in Problem Solving, Quality Management PowerPoint Slides: Core Quality Tools: Daily Problem Solving Toolkit PowerPoint (PPTX) Presentation Slide Deck, EDS SYSTEMS
ABOUT THE AUTHOR
EDS SYSTEMS develops practical business frameworks, professional training, and enterprise toolkits that help organizations solve complex problems, improve operational performance, strengthen project execution, and build lasting organizational capability.
Our products transform proven engineering, project management, operational excellence, and continuous improvement practices into structured,
... [read more]
Ask the Author a Question
You must be logged in to contact the author.