
 Click main image to view in full screen. Unlock all 11 preview images:
Consulting OS - All-in-One Practice Operating System – Excel XLSX
Excel (XLSX)


BENEFITS OF THIS DOWNLOADABLE EXCEL DOCUMENT
- Provides a unified operating system for managing client relationships, projects, profitability, pipeline, and financial performance in one place.
- Provides real-time visibility into your consulting practice, helping you improve profitability, utilization, cash flow, and business development.
- Provides a complete framework for streamlining consulting operations, reducing manual work, and making faster, data-driven decisions.
CONSULTING SALES EXCEL DESCRIPTION
Curated by McKinsey-trained Executives
CONSULTING OS – The All-In-One Practice Operating System That Stops Consultants From Drowning in Spreadsheets
Stop Losing $100K+ Per Year Because Your Consulting Practice Is Fragmented Across 47 Different Spreadsheets, Email Chains, and Outdated Tools.
Most consulting practices don't fail because they lack smart consultants—they fail because consultants lack a unified operating system that connects client relationships through project delivery, real-time profitability tracking, and continuous business development.
They suffer from:
• ❌ Fragmented CRM leaving pipeline visibility non-existent and deals slipping through cracks
• ❌ Time tracking chaos making project profitability invisible until it's too late
• ❌ Client data scattered across email, spreadsheets, and consultant notebooks
• ❌ Projects hemorrhaging money with no visibility into hours-vs-budget until closeout
• ❌ AR aging 60+ days because invoicing isn't connected to project data
• ❌ Zero capacity planning leaving consultants under/over-booked and revenue unpredictable
• ❌ Pipeline coverage unknown until cash flow crisis forces emergency business development
• ❌ Consultant burnout wasting 5+ hours per week on manual reporting and data entry
That's why boutique consulting firms plateau at $2-5M revenue.
INTRODUCING: CONSULTING OS
The Complete Operating System for Consulting Practices: Client Management, Project Economics, Time Tracking, Pipeline Intelligence & Financial Control—All Auto-Calculating in Real-Time
✅ 11 Fully Integrated Dashboards – Complete consulting toolkit from CRM to P&L to capacity planning
✅ 34,000+ Tested Formulas – Live KPI dashboards, project profitability, utilization tracking, AR aging
✅ Automatic Health Alerts – Red/yellow/green signals for overdue AR, at-risk projects, low margins, low pipeline
✅ Central Client Database – Single source of truth for every client: revenue, pipeline, relationship health, AR
✅ Real-Time Pipeline Visibility – Weighted opportunity tracking, win rates, deal velocity, coverage ratios auto-calculated
✅ Project Economics Automation – Hours vs. budget, revenue recognition, gross margin, burn rate—all live
✅ Time Intelligence Engine – Time entries drive revenue, cost, margin, utilization, and project health automatically
✅ Capacity & Utilization Dashboard – Team utilization %, available capacity, overallocation warnings, forecast by month
✅ Revenue & Finance Model – Monthly P&L with gross margin, operating profit, cash flow—all auto-linked to time and invoicing
✅ AR & Collections Tracking – Aging buckets, DSO, collection rate, overdue warnings auto-calculated
✅ Weekly/Monthly/Quarterly Review Templates – Built-in cadence for continuous improvement and growth
✅ Zero Setup Required – Pre-loaded with realistic demo data; customize in 30 minutes
✅ Enterprise-Grade Formatting – Professional aesthetics, print-ready, board-deck compatible
✅ No Code, No VBA, No Macros – Pure Excel formulas. Works on Mac, desktop, web. Zero vendor lock-in.
WHAT'S INCLUDED
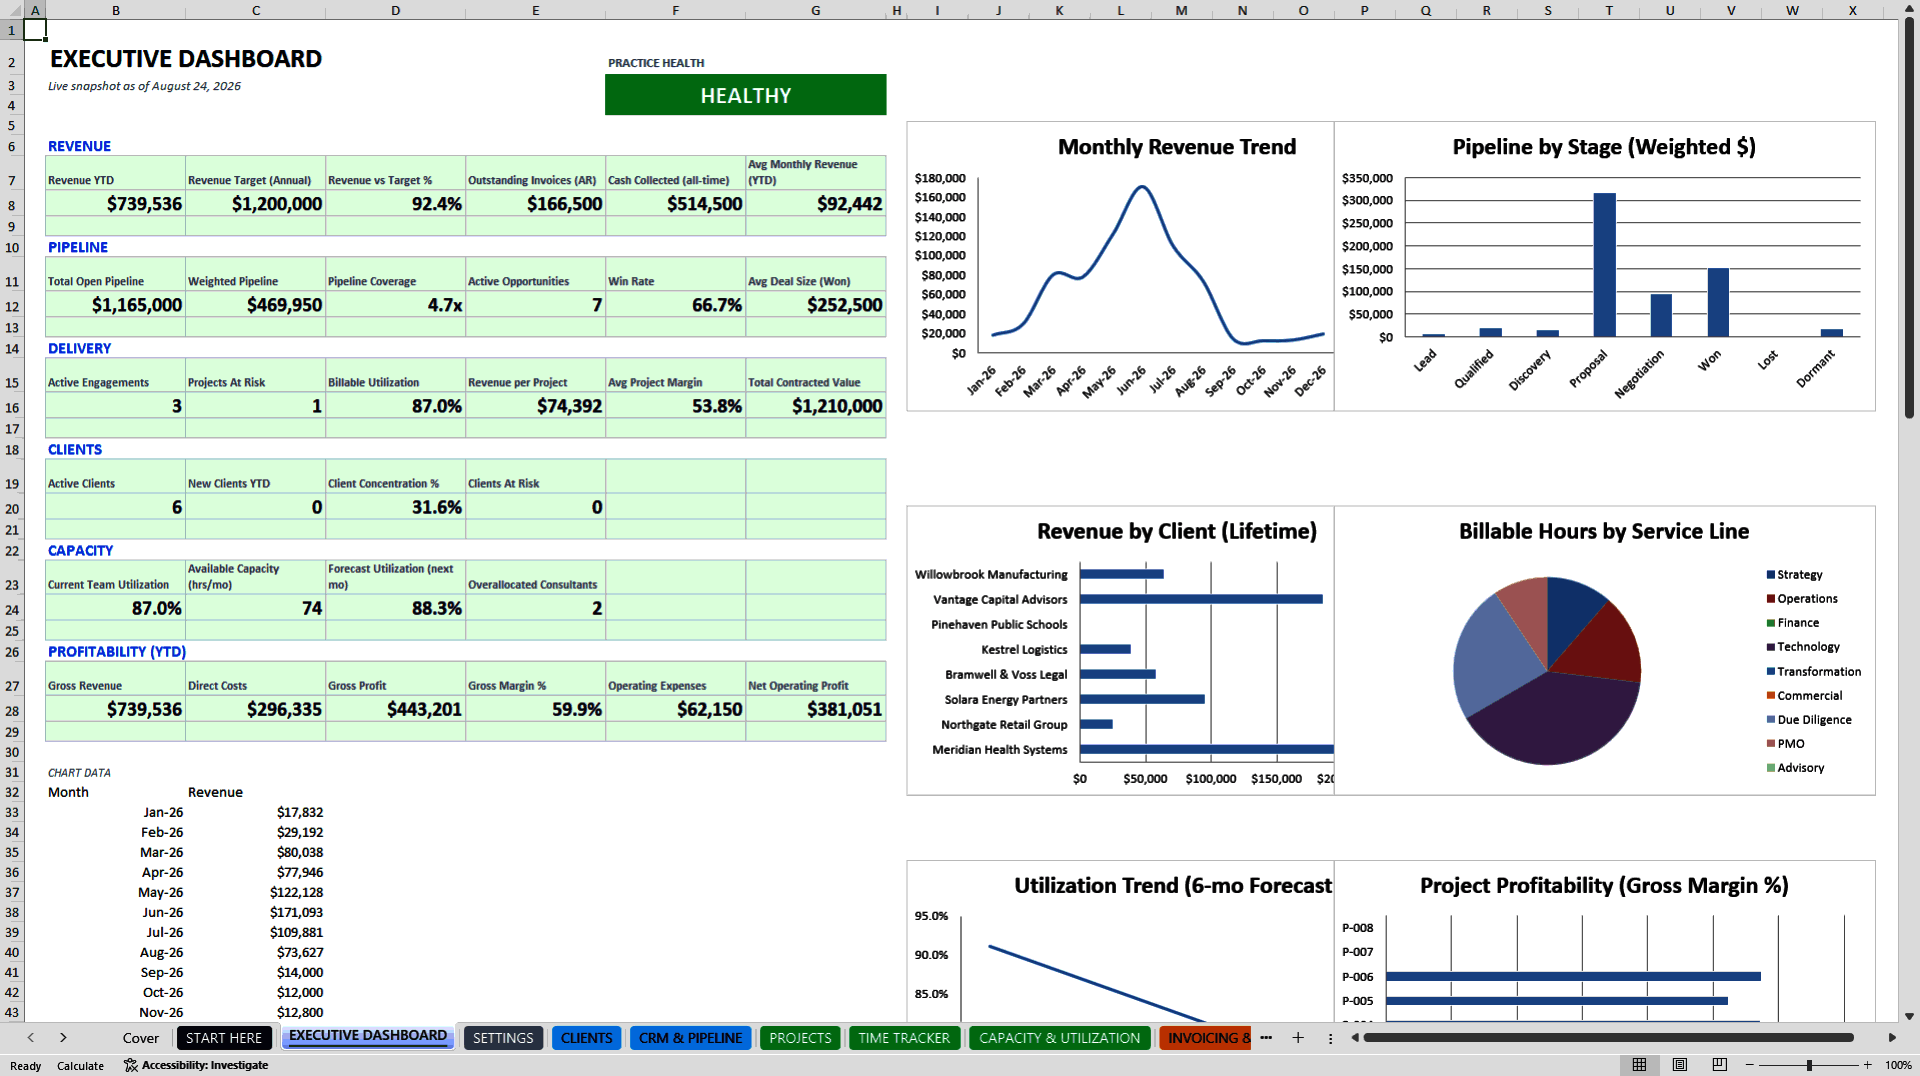
EXECUTIVE DASHBOARD (The One Page You Need Every Monday)
• Live Practice Health Score (0-100) – Automatic calculation based on revenue vs. target, utilization, margin, pipeline
• Top Overdue Actions – Invoice follow-ups, business development calls, client check-ins
• High-Risk Projects – Projects with low margins, behind schedule, or scope issues flagged automatically
• Pipeline Summary – Total open pipeline, weighted pipeline, coverage ratio vs. target
• Cash Flow Snapshot – Revenue YTD, outstanding AR, cash collected, runway indicator
• Revenue Trend Chart – Month-by-month performance vs. target
• Practice Health Indicator – HEALTHY / WATCH / AT RISK (auto-calculated from 5 key metrics)
CLIENT RELATIONSHIP MANAGEMENT
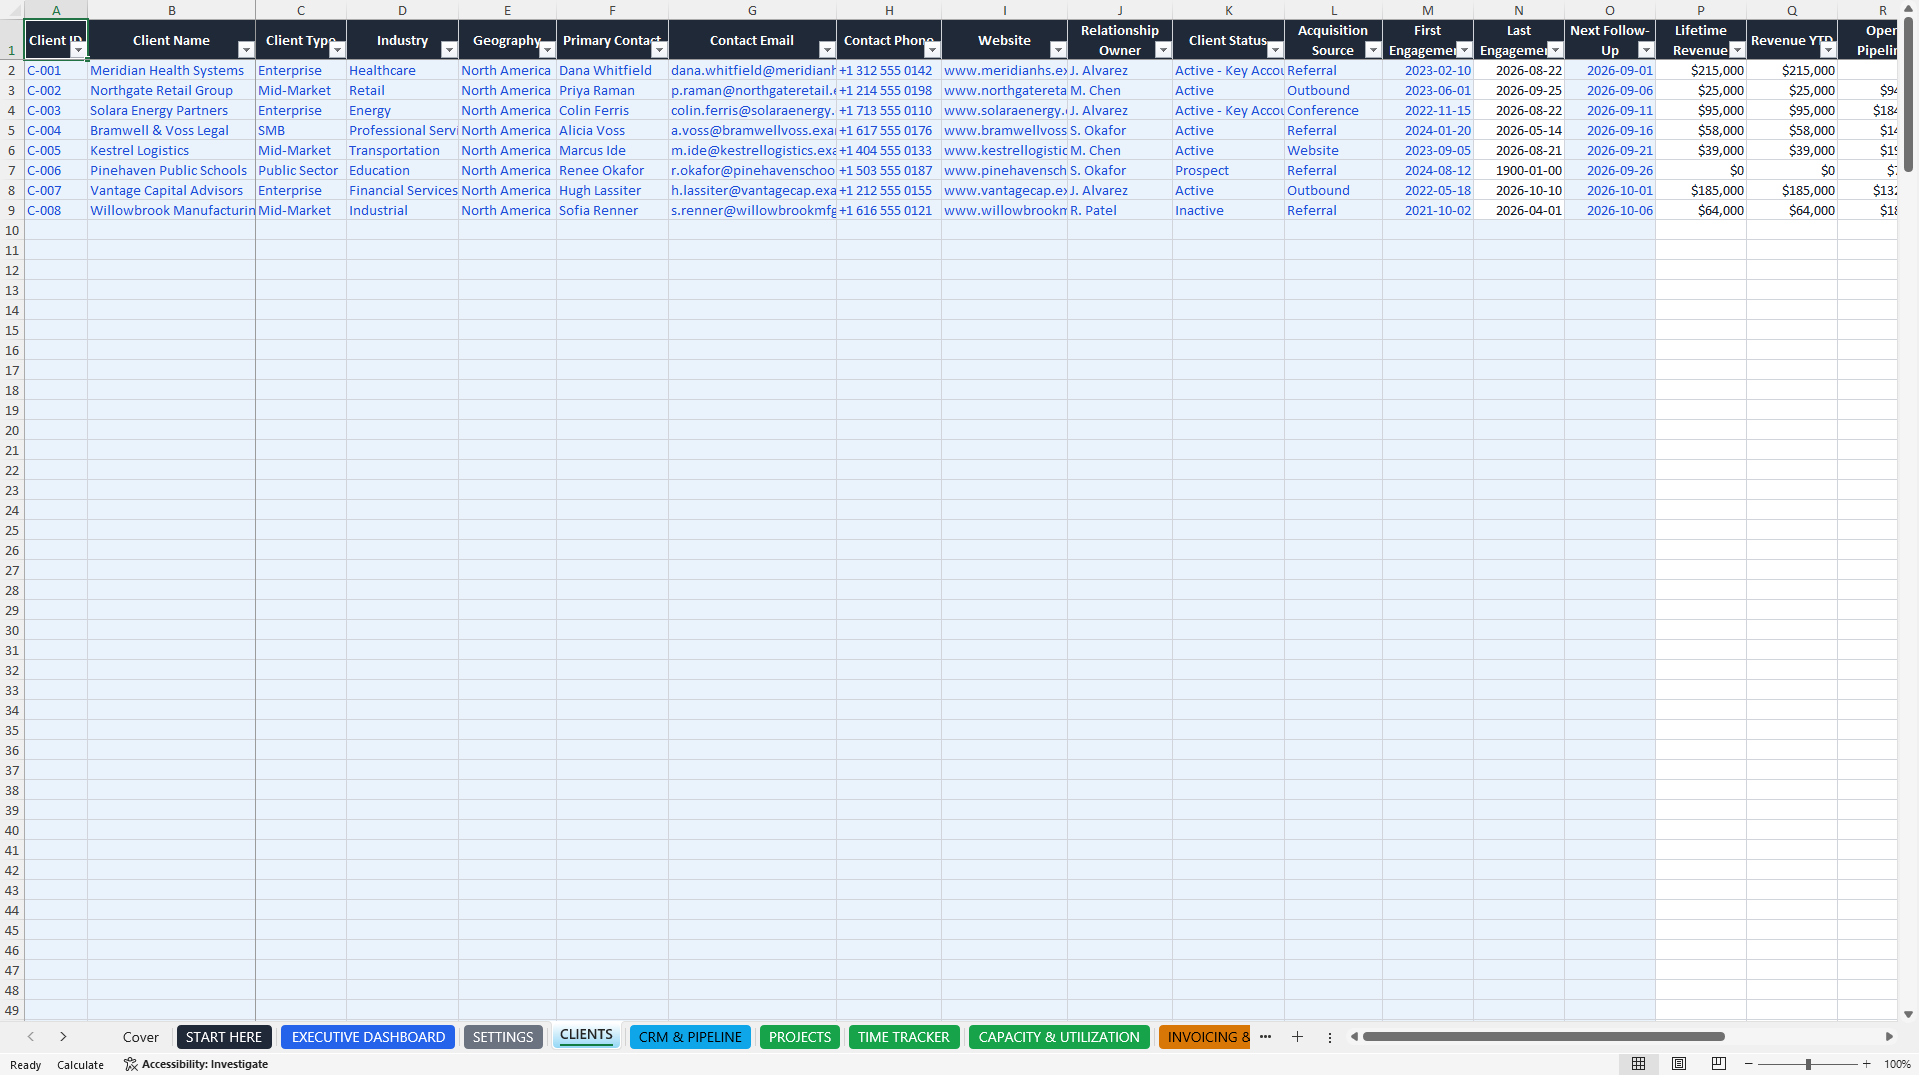
• Unified Client Master – Every client in one place with automatic calculations
• Lifetime revenue, revenue YTD, active projects count
• Open pipeline, next follow-up date with overdue warnings
• Outstanding AR, relationship health (Strong/Stable/At Risk)
• Repeat client %, concentration risk, profitability
• Client Profitability – Auto-calculated from project margins and time tracking
• Relationship Health Tracking – Automatic alerts for clients not contacted in 30+ days
• Client Type Classification – Enterprise, Mid-Market, SMB with filtering and sorting
CRM & SALES PIPELINE (Win More Deals Faster)
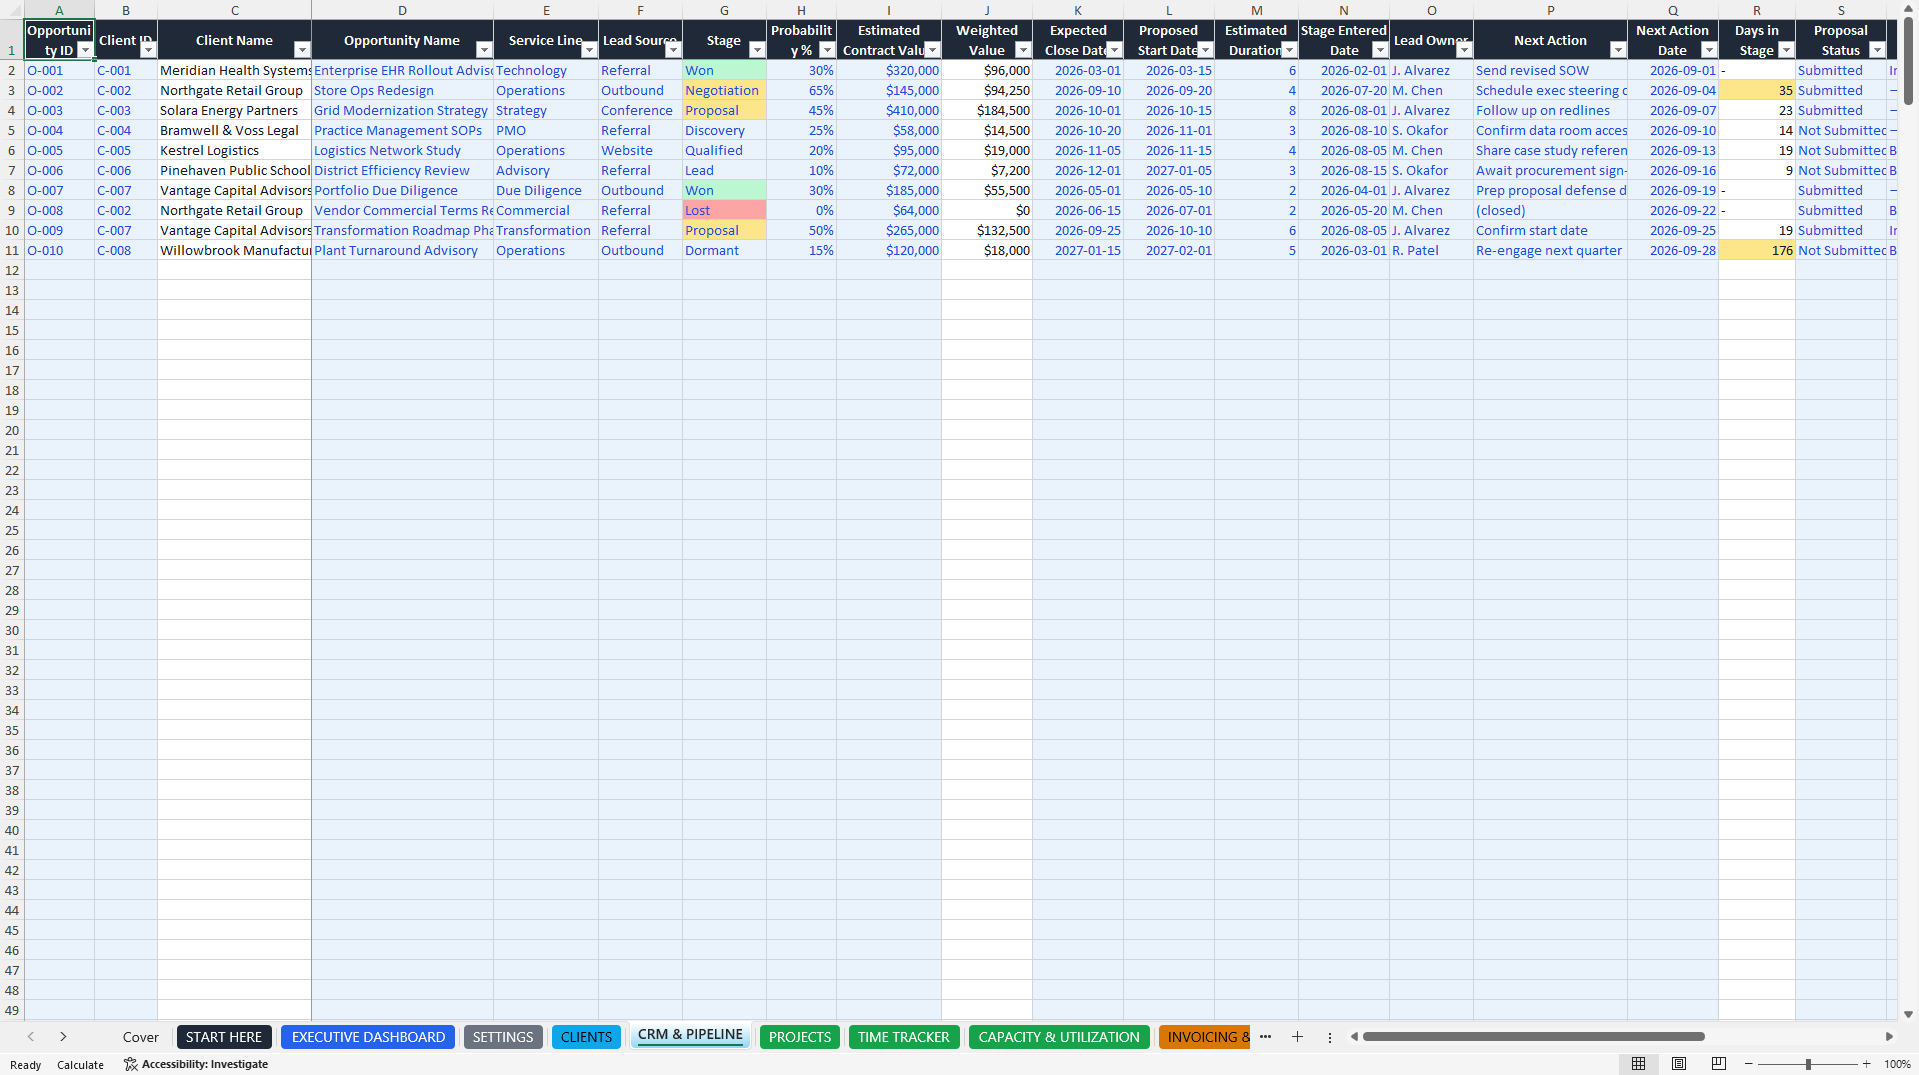
• Pipeline by Stage – Lead → Qualified → Discovery → Proposal → Negotiation → Won → Lost → Dormant
• Weighted Pipeline Calculation – Each opportunity auto-weighted by probability × contract value
• Pipeline Metrics Dashboard (all auto-calculated):
• Total pipeline value & weighted value
• Pipeline coverage ratio vs. monthly target (target: 3-5x)
• Number of active opportunities
• Win rate (# won ÷ # won + lost)
• Average deal size, average sales cycle length
• Proposals outstanding with follow-up tracking
• New opportunities this month, new wins this month
• Opportunity Tracking – Stage, probability %, estimated value, close date, owner, decision maker, competitor, notes
• Stale Opportunity Warnings – Auto-flagged opportunities 30+ days in stage with no next action
• Stage Duration Tracking – Days in each stage to identify bottlenecks
PROJECT MANAGEMENT & ECONOMICS (See Profitability Before It's Too Late)
• Project Dashboard – Active engagements, at-risk projects, overdue projects, contracted value
• Project Economics Auto-Calculation:
• Contract value (input) vs. Actual revenue (from time tracker)
• Budget hours vs. Actual hours (from time entries)
• Remaining hours & completion %
• Budget burn % (hours burned vs. budget)
• Direct costs (from time entries)
• Gross profit & gross margin % (auto-calculated and flagged if below minimum)
• Schedule variance (ahead/behind based on completion % vs. time elapsed)
• Revenue per hour (auto-calculated)
• Days remaining vs. completion % (schedule health check)
• Project Health Indicator – Automatic: ON TRACK / WATCH / AT RISK based on:
• Margin < minimum threshold
• Schedule variance < -15% (behind schedule)
• Over-capacity (hours > budget)
• Project Status Tracking – Not Started / Active / On Hold / Completed / Cancelled
• Milestone Tracking – Next milestone, due date, dependency flagging
• Risk & Issue Logging – Project-level risks and issues with mitigation plans
• Project Profitability Report – Actual vs. budget, variance, health, owner accountability
TIME TRACKING ENGINE (The Beating Heart of Your Practice)
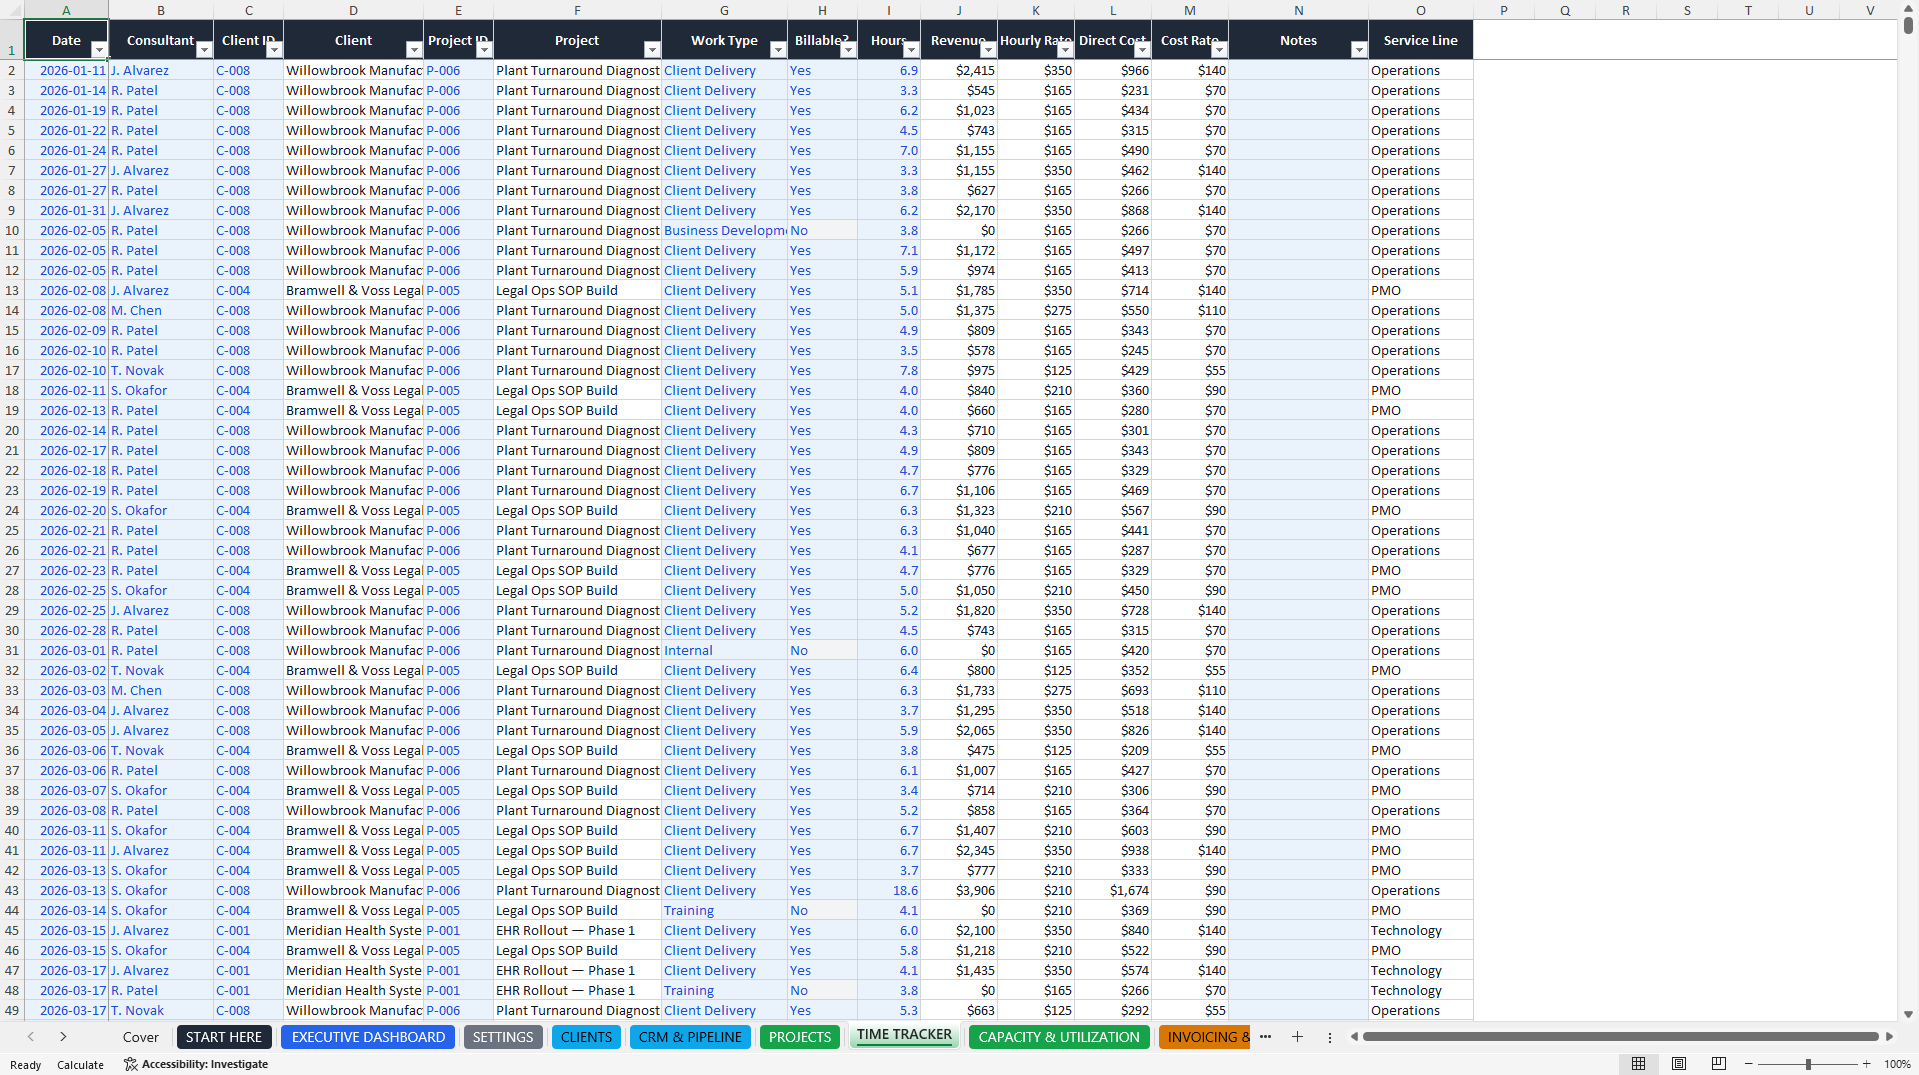
• Daily Time Entry – Date, consultant, client, project, work type, billable/non-billable, hours
• Automatic Revenue Calculation – Hours × consultant's billing rate = revenue (for billable entries)
• Automatic Cost Calculation – Hours × consultant's cost rate = direct cost
• Billable Hours Tracking – Billable vs. non-billable broken down by:
• Consultant (utilization % each)
• Client (revenue per client)
• Project (hours against budget)
• Service line (strategy, operations, finance, technology, etc.)
• Month & YTD
• Time Summary Dashboard (all auto-calculated):
• Total billable hours (all-time, MTD, YTD)
• Total non-billable hours
• Overall utilization % (billable ÷ total)
• Billable hours by service line (pie chart)
• Billable hours by consultant
• Revenue from time tracking
• Revenue per billable hour
CAPACITY & UTILIZATION PLANNING (Stop Over/Under-Booking Your Team)
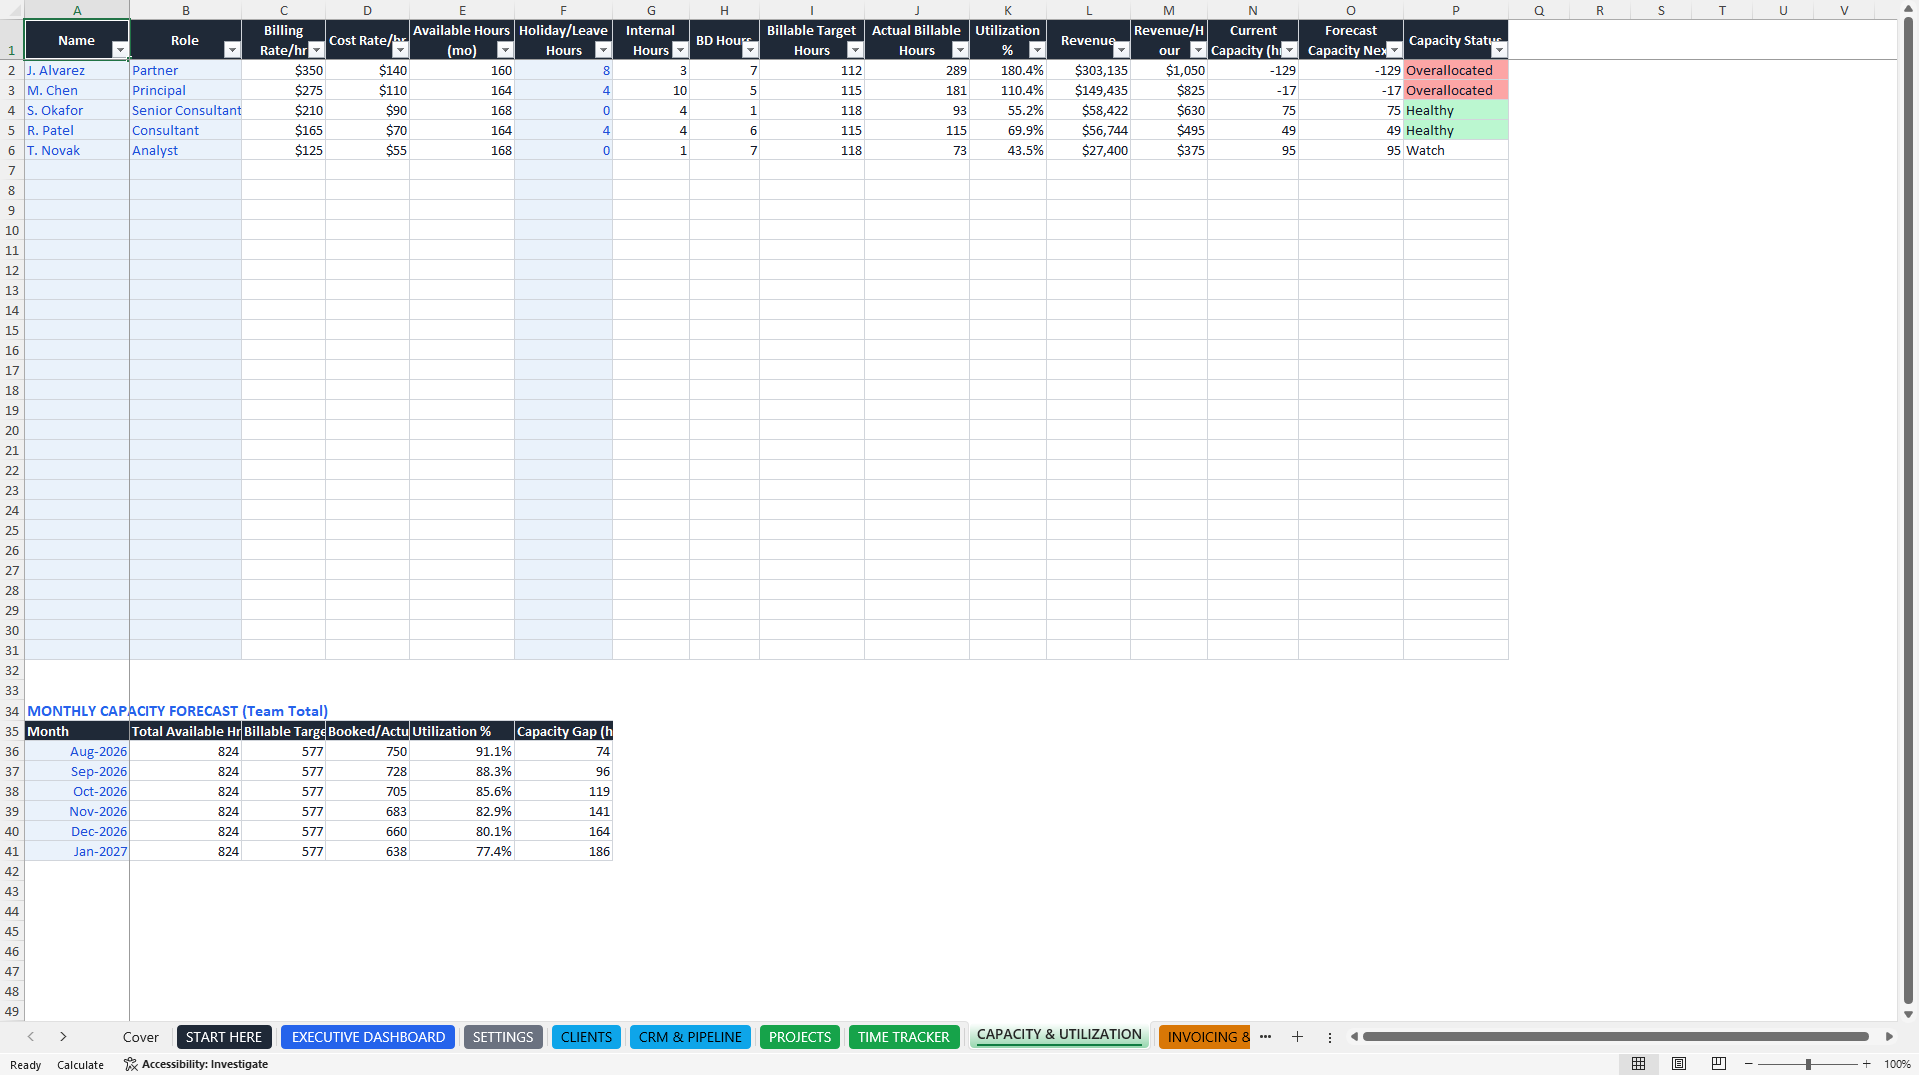
• Consultant Roster – Name, role, billing rate, cost rate (auto-linked to all time entries)
• Monthly Utilization Calculation (per consultant):
• Available hours = (working days/month × std hours/day) – holiday/leave
• Actual billable hours
• Utilization % = billable ÷ available
• Revenue generated
• Revenue per hour
• Current capacity (available – booked)
• Capacity Status Alert – HEALTHY / WATCH (warning) / OVERALLOCATED
• Healthy: 70-95% utilization
• Watch: 55-70% or 95%+ utilization
• Overallocated: 95%+ utilization
• Team Utilization Dashboard:
• Current team utilization %
• Available capacity in hours
• Forecast utilization (next month)
• Overallocated consultants (flagged)
• Underutilized consultants (flagged)
• 6-Month Capacity Forecast – Team utilization trend, capacity gaps identified
INVOICING & ACCOUNTS RECEIVABLE (Get Paid Faster, Know What's Overdue)
• Invoice Tracker – Invoice ID, client, project, amount, tax, due date, amount paid, balance due
• Automatic Calculation:
• Days outstanding (auto-calculated)
• Aging bucket (Current / 1-30 / 31-60 / 61-90 / 90+)
• Status: Unpaid / Partially Paid / Paid / Overdue
• Tax calculation (configurable tax rate)
• AR Summary Dashboard (all auto-calculated):
• Total invoiced (all-time)
• Total collected (all-time)
• Outstanding AR (balance due across all invoices)
• Overdue AR (red-flag alert for past-due balance)
• Collection rate % (collected ÷ invoiced)
• Average days to payment (DSO)
• Aging Bucket Breakdown – AR by bucket with conditional formatting:
• Current (green)
• 1-30 (yellow)
• 31-60 (orange)
• 61-90 (red)
• 90+ (dark red)
• Overdue AR Alerts – Automatic flagging of invoices past due date
REVENUE & FINANCIAL MODEL (Know Your Margins Before Month-End)
• Monthly P&L (Jan–Dec with YTD total):
• REVENUE: Consulting revenue (from time tracker) + Retainer + Training + Other
• DIRECT COSTS: Direct delivery cost (from time tracker) + Contractor costs
• GROSS PROFIT = Revenue – Direct Costs (auto-calculated)
• GROSS MARGIN % (auto-calculated)
• OPERATING EXPENSES: Software, marketing, travel, professional services, insurance, office, other
• TOTAL OPEX (auto-calculated)
• EBITDA / OPERATING PROFIT = Gross Profit – Opex (auto-calculated)
• NET MARGIN % (auto-calculated)
• Financial KPI Cards:
• Revenue YTD & monthly target
• Gross margin % vs. target (auto-flagged if below)
• Operating profit YTD
• Net margin % vs. target
• Budget Variance Tracking – Actual vs. plan by expense line
• Cash Collection Trend – Month-by-month cash collection chart
TASKS & ACTIONS (Single Source of Truth for Priorities)
• Central Action Log – Task ID, description, client, project, owner, priority, category, due date, status
• Status Tracking – Not Started / In Progress / Blocked / Completed
• Priority Levels – Low / Medium / High / Critical (with auto-flagging for high/critical)
• Auto-Calculated Overdue Count – "Days Overdue" column flags past-due tasks in red
• Task Views:
• Due today
• Due this week
• Overdue (red alert)
• High/critical priority only
• By client
• By category (Business Development / Client Delivery / Admin / Finance / Marketing)
• Task Summary Dashboard (auto-calculated):
• Open tasks count
• Overdue tasks count
• Due this week count
• High/critical priority open tasks
• Business development tasks open
KPI SCORECARD (Actual vs. Target vs. Variance)
• Sales KPIs:
• Leads / qualified opportunities (open count)
• Proposals outstanding
• Wins this month
• Win rate
• Total open pipeline ($)
• Weighted pipeline ($)
• Pipeline coverage (x of monthly target)
• Delivery KPIs:
• Active engagements
• Projects at risk
• Projects overdue
• Billable utilization %
• Billable hours (MTD)
• Average project margin %
• Total contracted value
• Finance KPIs:
• Revenue (this month & YTD)
• Gross margin % YTD
• Operating profit YTD
• Net margin % YTD
• Cash collected (all-time)
• Outstanding AR
• Days sales outstanding (DSO)
• Client KPIs:
• Active clients
• New clients YTD
• Client concentration % (top client ÷ total revenue)
• Clients at risk / critical
• Outstanding AR by client
• Automatic Status Indicator:
• Green (ON TARGET) – actual ≥ target (or ≤ for DSO/overdue)
• Red (BELOW TARGET) – actual < target
• Gray (—) – no target defined
• Variance Column – Actual – Target (auto-calculated)
SETTINGS & CONFIGURATION (One Central Place to Manage Everything)
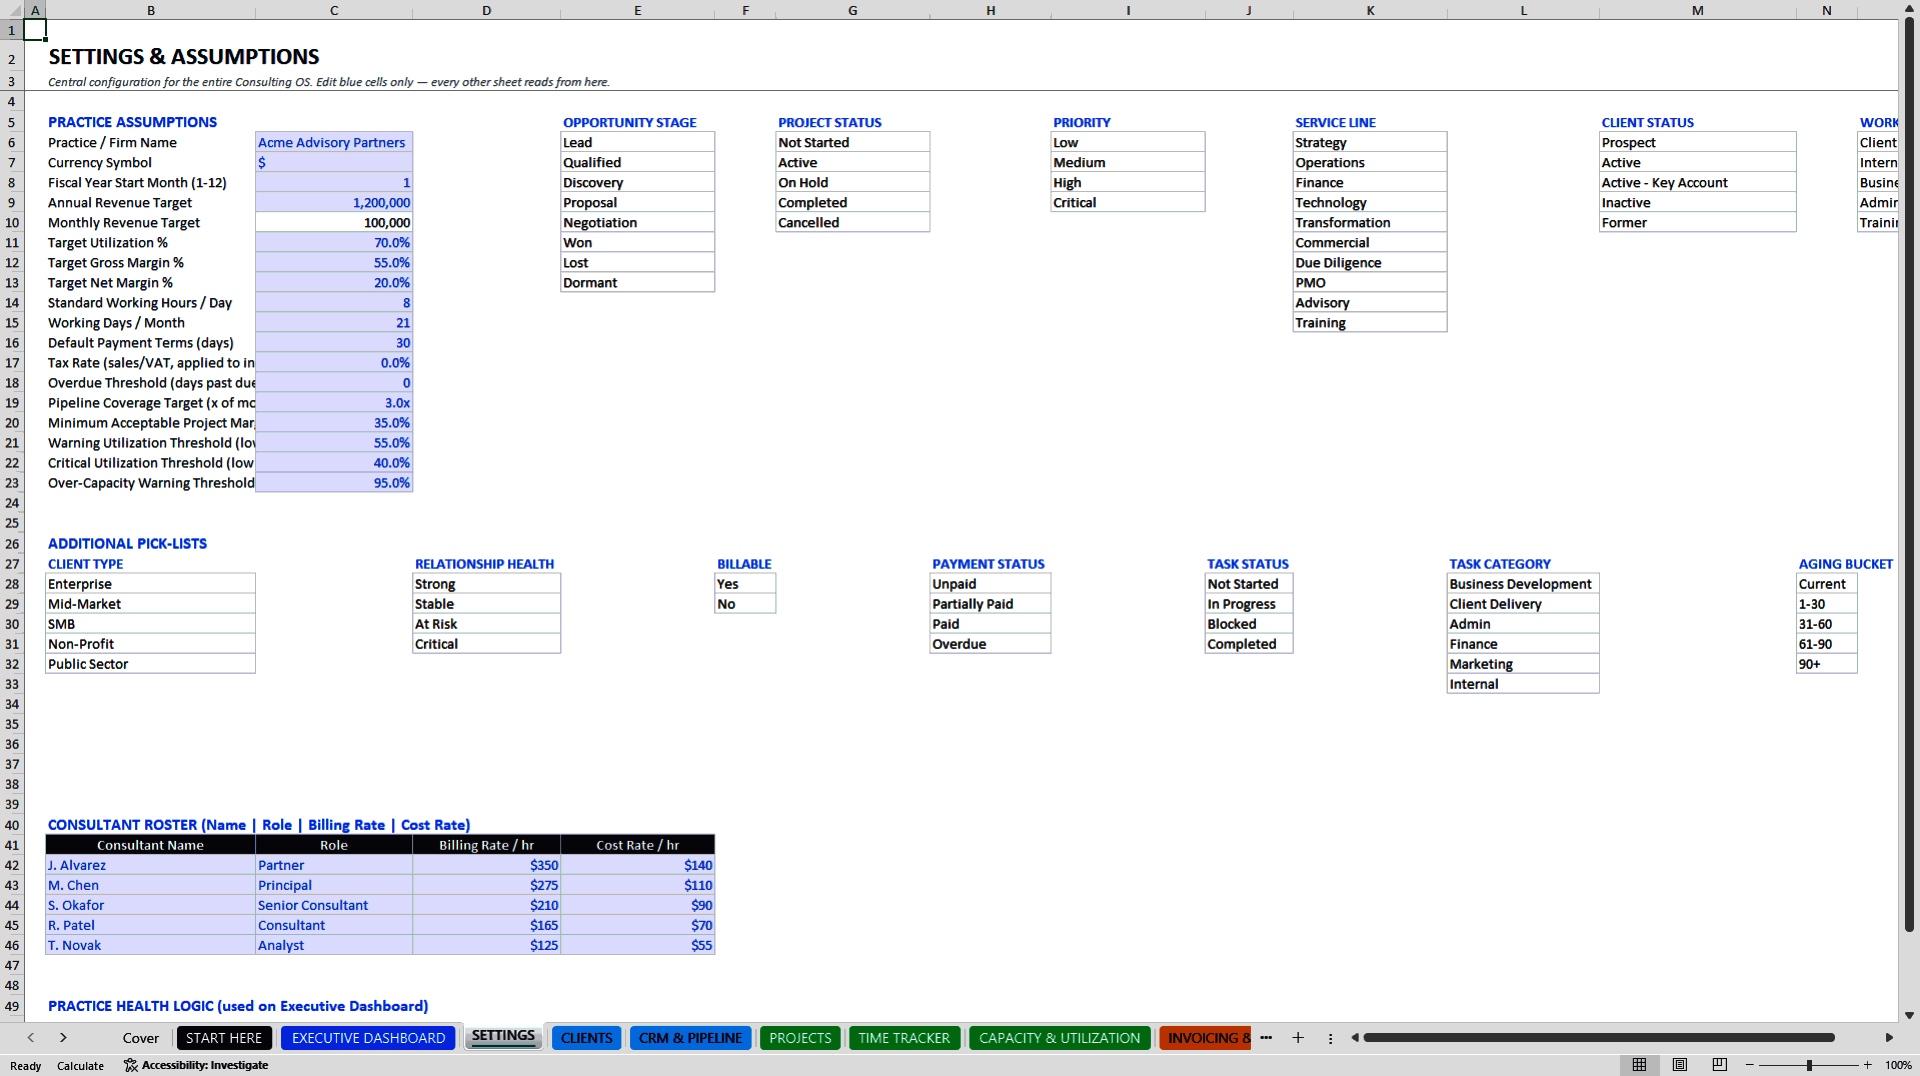
• Practice Parameters:
• Firm name, currency, fiscal year start
• Annual revenue target & monthly target
• Target utilization %, gross margin %, net margin %
• Standard working hours/day & working days/month
• Default payment terms (days)
• Tax rate (sales tax / VAT)
• Overdue threshold (days past due = "overdue")
• Pipeline coverage target (e.g., 3x monthly revenue)
• Minimum acceptable project margin %
• Warning utilization thresholds
• Consultant Roster – Names, roles, billing rates, cost rates (single source of truth for all lookups)
• Dropdown Pick-Lists (all editable, used throughout workbook):
• Opportunity stages (Lead, Qualified, Discovery, Proposal, Negotiation, Won, Lost, Dormant)
• Project status (Not Started, Active, On Hold, Completed, Cancelled)
• Priority (Low, Medium, High, Critical)
• Service lines (Strategy, Operations, Finance, Technology, Transformation, Commercial, Due Diligence, PMO, Advisory, Training)
• Client status (Prospect, Active, Active – Key Account, Inactive, Former)
• Client type (Enterprise, Mid-Market, SMB, Non-Profit, Public Sector)
• Relationship health (Strong, Stable, At Risk, Critical)
• Task category (Business Development, Client Delivery, Admin, Finance, Marketing, Internal)
• Work type (Client Delivery, Internal, Business Development, Admin, Training)
• Billable yes/no
• Payment status (Unpaid, Partially Paid, Paid, Overdue)
• Aging buckets (Current, 1-30, 31-60, 61-90, 90+)
• Practice Health Logic (configurable):
• HEALTHY = Revenue ≥ 90% of target AND Utilization ≥ target AND Pipeline ≥ coverage target
• WATCH = Revenue 70-90% OR Utilization between warning/target OR Pipeline below target
• AT RISK = Revenue < 70% OR Utilization below critical threshold OR Pipeline < 1x monthly target
• Help Text & Instructions – Built into every sheet with color-coded legend
START HERE ONBOARDING (5-Minute Setup Guide)
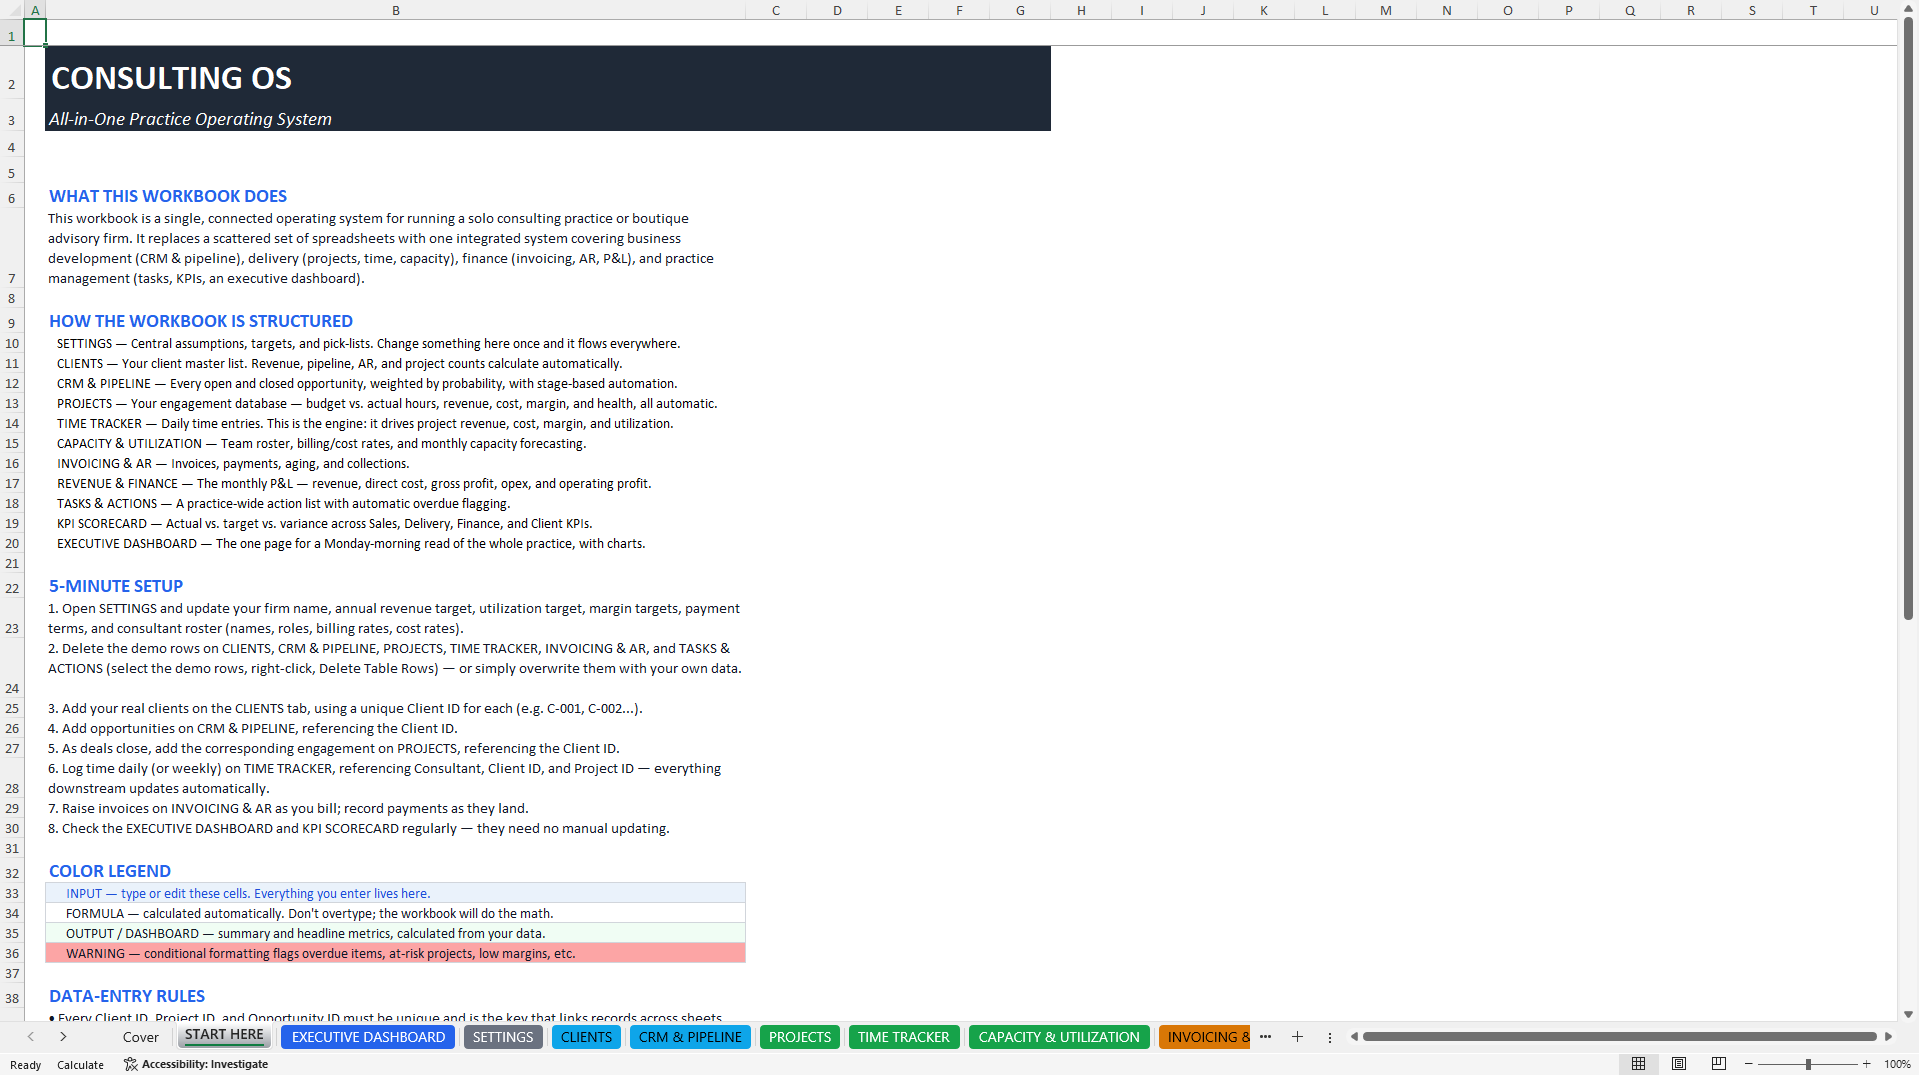
• What This Workbook Does – Plain-English explanation of the entire system
• How It's Structured – Overview of each sheet and its purpose
• 5-Minute Setup Instructions:
1. Open SETTINGS, update firm name, targets, consultant roster
2. Delete demo data on CLIENTS, PIPELINE, PROJECTS, TIME TRACKER, INVOICING & AR, TASKS
3. Add real clients on CLIENTS tab (Client ID is the key)
4. Add opportunities on CRM & PIPELINE (reference Client ID)
5. Add projects on PROJECTS as deals close
6. Log time daily on TIME TRACKER (everything downstream updates auto)
7. Raise invoices on INVOICING & AR (amounts auto-populated if from projects)
8. Check EXECUTIVE DASHBOARD & KPI SCORECARD (no manual updates needed)
• Color Legend – Input (blue) / Formula (white) / Output/Dashboard (green) / Warning (red)
• Data-Entry Rules – What must be unique, where to use dropdowns, how to add new rows
• Operating Rhythm:
• Daily: Log time, review overdue tasks
• Weekly: Check pipeline, projects at risk, invoicing status
• Monthly: Review dashboard, reconcile P&L, chase AR
• Quarterly: Strategic review, utilization trends, practice health assessment
• Important Assumptions – Revenue recognized on time entry (not invoice), project % completion is manual, all formulas have blank-row guards
WHO USES CONSULTING OS
• Solo Consultants & Independent Advisors – Run your entire practice from one workbook; no software subscriptions
• Boutique Consulting Firms ($1-10M revenue) – Replace scattered spreadsheets with integrated operating system
• Strategy Consultancies – Pipeline visibility, project economics, team capacity all in one place
• Operations & Transformation Practices – Project tracking, budget management, consultant utilization
• Finance & Due Diligence Advisors – Multi-client engagement tracking, billable hour capture, margin analysis
• IT Consulting & Systems Integration – Project management, team capacity forecasting, profitability tracking
• Fractional CFOs & Finance Advisors – Client portfolio dashboard, time-based revenue model
• HR & Organizational Development Consultants – Client relationship tracking, project economics, team scheduling
• Management Consultants & Interim Executives – Professional dashboard, board-ready reports, KPI tracking
• Consulting Practice Leaders & Operations Managers – Practice health visibility, consultant utilization, capacity planning
• Executive Coaches & Business Advisors – Structured review cadence, client engagement tracking, profitability analysis
• Consulting Firms Using Spreadsheet Model – Upgrade from scattered Excel to integrated system (no software cost)
• Firms Wanting to Exit Expensive SaaS – Replace Salesforce, Asana, Harvest with one workbook (one-time cost, no recurring fees)
CONSULTING OS DELIVERS IMMEDIATE RESULTS
✅ Pipeline Clarity – Know exactly where every deal is and when it closes (weighted pipeline auto-calculated)
✅ Project Profitability – See gross margin on every project in real-time; never miss a low-margin engagement again
✅ Team Utilization Visibility – Know who's over/under-booked and where capacity gaps are 6 months out
✅ Cash Flow Control – Outstanding AR, DSO, collection rate all tracked; overdue AR alerts prevent cash surprises
✅ Revenue Predictability – Monthly P&L auto-calculates from time tracking; forecast revenue with confidence
✅ Client Relationship Management – Every client's lifetime value, profitability, relationship health in one place
✅ Business Development Discipline – Central pipeline prevents deals from slipping through cracks
✅ Consultant Accountability – Time entry drives utilization %, profitability, project health; no hiding poor performance
✅ Executive Decision Speed – "How are we doing?" answered in 30 seconds from the dashboard, not 30 minutes of data digging
✅ Continuous Improvement – Weekly/monthly/quarterly review templates built in; structured cadence drives performance
✅ Board Readiness – Professional scorecards, health metrics, dashboards ready for investor/board presentations
✅ Cost Efficiency – One-time investment eliminates need for Salesforce ($165k/year), Asana ($85k/year), Harvest ($50k/year)—saves $300k+ annually
✅ Consultant Retention – Clear visibility into utilization, skills, capacity reduces burnout from over/under-booking
✅ Zero IT Dependency – Pure Excel. Works on Mac, Windows, web. No software to install. No IT support needed.
✅ Consultant Bandwidth – Stop wasting 8+ hours per week in manual reporting and data entry
THE PLATFORM EVERY CONSULTING PRACTICE NEEDS
Stop managing your practice with email chains, scattered spreadsheets, and disconnected tools.
Most consulting firms are leaving $50K-$500K+ on the table every year because they don't have real-time visibility into profitability, pipeline, and capacity.
• They can't spot a low-margin project until it's 80% complete
• They double-book consultants because capacity planning is in someone's notebook
• They lose deals because pipeline is in email, not centralized
• They collect payments 45+ days late because AR aging isn't tracked
• They can't forecast revenue because time tracking isn't connected to the P&L
• They hire expensive software (Salesforce + Asana + Harvest + Anaplan = $300k+/year) for features they don't use
CONSULTING OS fixes all of this.
Every formula tested. Every sheet interconnected. Every dashboard auto-calculating. Every priority visible. Every metric real-time.
WHAT'S ACTUALLY INCLUDED
✅ 11 Fully Integrated Sheets – Workbook architect-built for maximum automation and minimal manual data entry
✅ 34,333 Tested Formulas – LibreOffice-recalculated, zero errors, fully backward-compatible
✅ 6 Excel Tables – Professional table structure with auto-expanding rows (just start typing, formulas copy down)
✅ 7 Live Charts – Revenue trend, pipeline by stage, revenue by client, utilization forecast, project profitability, cash collection, billable hours by service line
✅ 17 Named Ranges – Dropdown lists, settings, parameters—all centralized and easy to update
✅ Conditional Formatting – Auto-colored status indicators (green/yellow/red for health, margins, utilization, AR aging)
✅ Data Validation Dropdowns – Every pick-list pre-built; prevents invalid entries and keeps data clean
✅ Automatic Cross-Sheet Lookups – Client name, project name auto-populate from IDs (no manual entry)
✅ Guarded Formulas – Every calculation has IF-guards so blank rows never break (safe to delete demo data)
✅ Print-Ready Layouts – Professional formatting, optimized column widths, page breaks set for printing
✅ Realistic Demo Data – Fictional clients, projects, time entries, invoices so all dashboards work immediately
✅ Zero VBA / Macros / Scripts – Pure native Excel formulas. Works everywhere. No code required.
✅ No External Links – Fully self-contained; never broken by missing files or data sources
✅ Mobile/Web Compatible – Works in Excel 365 (desktop, Mac, web); sync across devices
90-DAY IMPLEMENTATION ROADMAP
Week 1-2: Foundation
• Customize SETTINGS: firm name, currency, targets, consultant roster (billing/cost rates)
• Review demo data across all sheets; understand the structure
• Delete demo client/project/opportunity rows (or overwrite with real data)
Week 3-4: Data Entry
• Enter real clients on CLIENTS tab (use unique Client IDs: C-001, C-002, etc.)
• Enter current active and pipeline opportunities on CRM & PIPELINE
• Enter current projects on PROJECTS (linked to client and opportunities)
• Enter current invoices on INVOICING & AR (with payment status)
Week 5-6: Execution Setup
• Establish time-logging discipline: all consultants log daily/weekly on TIME TRACKER
• Set up weekly invoicing rhythm: invoice all completed milestone work
• Run first full REVENUE & FINANCE reconciliation (should auto-match from time + invoicing)
Week 7-8: Dashboard Activation
• Review EXECUTIVE DASHBOARD every Monday morning
• Check CAPACITY & UTILIZATION for over/under-booked consultants
• Monitor KPI SCORECARD weekly to track vs. targets
• Establish CRM & PIPELINE discipline: update opportunity status, probabilities, next actions weekly
Week 9-10: Review Cadence
• Conduct first weekly review (30 min, executive team): review dashboard, confirm priorities, clear blockers
• Start monthly REVENUE & FINANCE review (reconcile actual vs. plan)
• Review TASKS & ACTIONS board every Friday (overdue management, next week priorities)
Week 11-12: Optimization
• Refine SETTINGS thresholds based on first month's learnings (target utilization %, min margin %, pipeline coverage)
• Establish monthly business development review: pipeline by stage, win rates, sales velocity
• Create 90-day forecast for revenue, utilization, and cash position
• Present to board/investors using professional dashboards
By Day 90:
• ✅ Full operational dashboard live across entire practice
• ✅ Real-time visibility into pipeline, projects, team utilization, AR, revenue
• ✅ Entire leadership team aligned on priorities and performance metrics
• ✅ Weekly/monthly/quarterly review cadence established
• ✅ Consultant time-logging discipline embedded (hours → revenue → margin)
• ✅ CFO/practice manager can answer "How are we doing?" in 30 seconds
• ✅ Board-ready dashboards and KPI scorecards ready for investor meetings
• ✅ $300k+ annual software cost eliminated
• ✅ Practice operating as integrated system, not fragmented spreadsheets
DOWNLOAD CONSULTING OS TODAY
Everything a consulting practice needs to move from spreadsheet chaos to professional operating system.
The complete workbook is ready. No setup required. No learning curve. No vendor lock-in. No subscription fees. No IT support needed.
• ✅ Download in seconds
• ✅ Open in Excel (any version, any platform)
• ✅ Customize with your data in 30 minutes
• ✅ Start tracking pipeline, projects, and profitability immediately
• ✅ Have an executive dashboard ready by Friday
• ✅ Lead with clarity next Monday
For solo consultants: Stop managing your business in email and Gmail calendar. Have one system that shows you pipeline, utilization, revenue, and margin in real-time.
For boutique firms ($1-10M): Replace Salesforce + Asana + Harvest + Anaplan ($450k/year combined) with one integrated workbook. Save $300k+ annually. Keep 100% of your data. Stay vendor-independent.
For consulting leaders: Give your CFO/operations manager complete visibility into practice health, team capacity, project profitability, and financial performance. Stop wasting leadership bandwidth on manual reporting.
CONSULTING OS – YOUR OPERATING SYSTEM
Download now. Implement this week. Track progress by Friday. Lead with clarity next Monday.
The Consulting OS is waiting. Your practice deserves this level of operational excellence. 🚀
Stop losing money to fragmented systems. Stop wasting hours on manual reporting. Stop missing pipeline, projects, and profitability insights.
Get Consulting OS. Get clarity. Get control. Dominate your market. 📊
Keywords: Inventory Management, Demand Planning, Inventory Optimization, Inventory Control, Supply Chain Management, Warehouse Operations, Replenishment Strategy, Inventory Analytics, WIP Reduction, Inventory Accuracy, Distribution Network, Inventory Forecasting, Supply Chain Excellence, Working Capital, Inventory KPIs, Procurement Strategy, Inventory Governance, Inventory SOPs, Continuous Improvement, Supply Chain Transformation, GenAI deployment SOPs, generative AI operating model, enterprise AI governance framework, AI Center of Excellence, responsible AI, AI risk management, AI use case prioritization, GenAI implementation roadmap, AI vendor selection, prompt engineering standards, AI compliance, AI adoption strategy, generative AI across value chain, AI strategy, enterprise transformation, AI implementation, AI scaling framework
Strategy & Transformation, Growth Strategy, Strategic Planning, Strategy Frameworks, Innovation Management, Pricing Strategy, Core Competencies, Strategy Development, Business Transformation, Marketing Plan Development, Product Strategy, Breakout Strategy, Competitive Advantage, Mission, Vision, Values, Strategy Deployment & Execution, Innovation, Vision Statement, Core Competencies Analysis, Corporate Strategy, Product Launch Strategy, BMI, Blue Ocean Strategy, Breakthrough Strategy, Business Model Innovation, Business Strategy Example, Corporate Transformation, Critical Success Factors, Customer Segmentation, Customer Value Proposition, Distinctive Capabilities, Enterprise Performance Management, KPI, Key Performance Indicators, Market Analysis, Market Entry Example, Market Entry Plan, Market Intelligence, Market Research, Market Segmentation, Market Sizing, Marketing, Michael Porter's Value Chain, Organizational Transformation, Performance Management, Performance Measurement, Platform Strategy, Product Go-to-Market Strategy, Reorganization, Restructuring, SWOT, SWOT Analysis, Service 4.0, Service Strategy, Service Transformation, Strategic Analysis, Strategic Plan Example, Strategy Deployment, Strategy Execution, Strategy Frameworks Compilation, Strategy Methodologies, Strategy Report Example, Value Chain, Value Chain Analysis, Value Innovation, Value Proposition, Vision Statement, Corporate Strategy, Business Development, Business plan pdf, business plan, PDF, Business Plan DOC, Business Plan Template, PPT, Market strategy playbook, strategic market planning, competitive analysis tools, market segmentation frameworks, growth strategy templates, product positioning strategy, market execution toolkit, strategic alignment playbook, KPI and OKR frameworks, business growth strategy guide, cross-functional strategy templates, market risk management, market strategy PowerPoint doc, guide, ebook, e-book ,McKinsey Change Playbook, Organizational change management toolkit, Change management frameworks 2025, Influence model for change, Change leadership strategies, Behavioral change in organizations, Change management PowerPoint templates, Transformational leadership in change, supply chain KPIs, supply chain KPI toolkit, supply chain PowerPoint template, logistics KPIs, procurement KPIs, inventory management KPIs, supply chain performance metrics, manufacturing KPIs, supply chain dashboard, supply chain strategy KPIs, reverse logistics KPIs, sustainability KPIs in supply chain, financial supply chain KPIs, warehouse KPIs, digital supply chain KPIs, 1200 KPIs, supply chain scorecard, KPI examples, supply chain templates, Corporate Finance SOPs, Finance SOP Excel Template, CFO Toolkit, Finance Department Procedures, Financial Planning SOPs, Treasury SOPs, Accounts Payable SOPs, Accounts Receivable SOPs, General Ledger SOPs, Accounting Policies Template, Internal Controls SOPs, Finance Process Standardization, Finance Operating Procedures, Finance Department Excel Template, FP&A Process Documentation, Corporate Finance Template, Finance SOP Toolkit, CFO Process Templates, Accounting SOP Package, Tax Compliance SOPs, Financial Risk Management Procedures.
NOTE: Our digital products are sold on an "as is" basis, making returns and refunds unavailable post-download. Please preview and inquire before purchasing. Please contact us before purchasing if you have any questions! This policy aligns with the standard Flevy Terms of Usage.
Got a question about the product? Email us at support@flevy.com or ask the author directly by using the "Ask the Author a Question" form. If you cannot view the preview above this document description, go here to view the large preview instead.
Source: Best Practices in Consulting Sales Excel: Consulting OS - All-in-One Practice Operating System Excel (XLSX) Spreadsheet, SB Consulting
ABOUT THE AUTHOR

SB Consulting is dedicated to empowering businesses to communicate their ideas with impact. This consulting firm specializes in teaching organizations how to create effective corporate and management presentations. With training from top-tier global consulting firms, including McKinsey, BCG, and Porsche Consulting, extensive expertise in presentation design and ... [read more]
Ask the Author a Question
You must be logged in to contact the author.




























