
 Click main image to view in full screen. Unlock all 22 preview images:
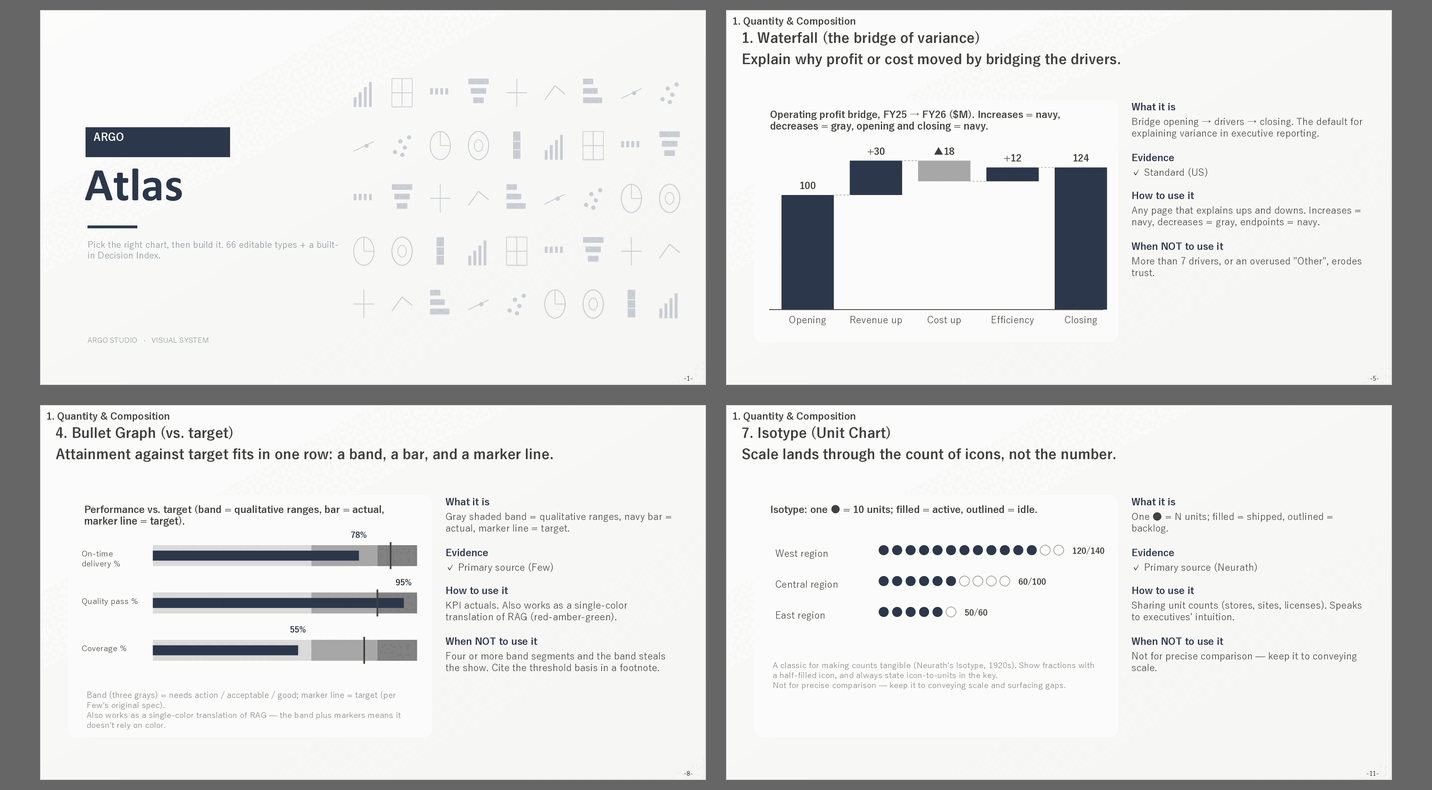
Argo Atlas (66 Chart Types, 108 Slides, 15 Editable Charts) – PowerPoint PPTX Template
PowerPoint (PPTX) + Zip archive file (ZIP) 108 Slides


BENEFITS OF THIS DOWNLOADABLE POWERPOINT DOCUMENT
- 15 of the 66 types are rebuilt as real PowerPoint chart objects with their own embedded worksheets: right-click, Edit Data, and your numbers replace the samples.
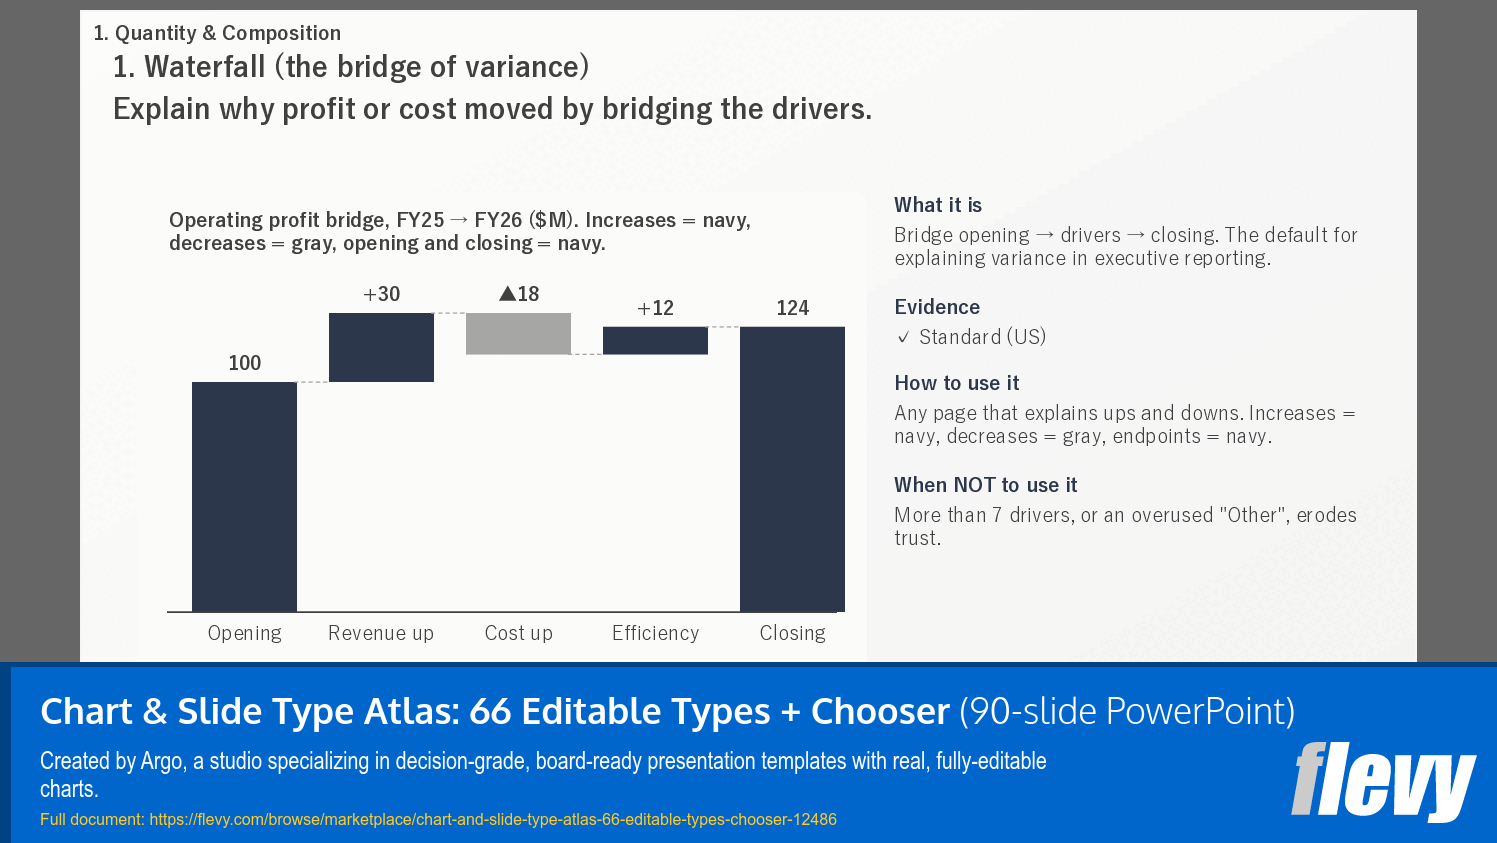
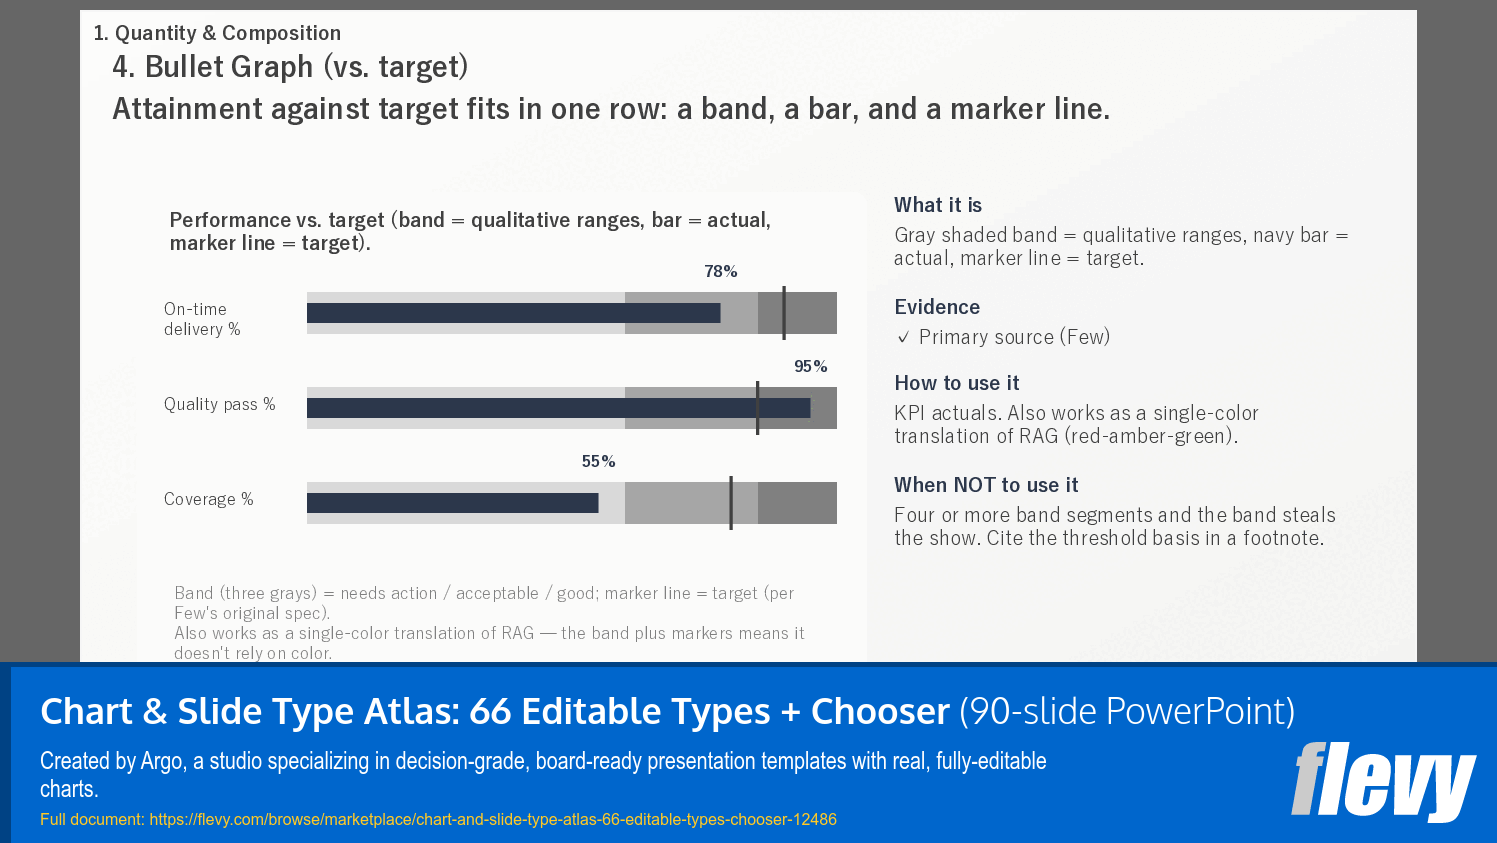
- Every one of the 47 static type pages has the same four fields: What it is, Evidence (a named source where one exists), How to use it, and When NOT to use it.
- Commercial license included: unlimited decks for your own business, employer or personal work, including paid, public and investor-facing. No attribution required.
CHART DESIGN PPT TEMPLATE DESCRIPTION
Argo Atlas is a catalog you look things up in. You know what you have to say and not which shape says it; the index closes that gap in one lookup.
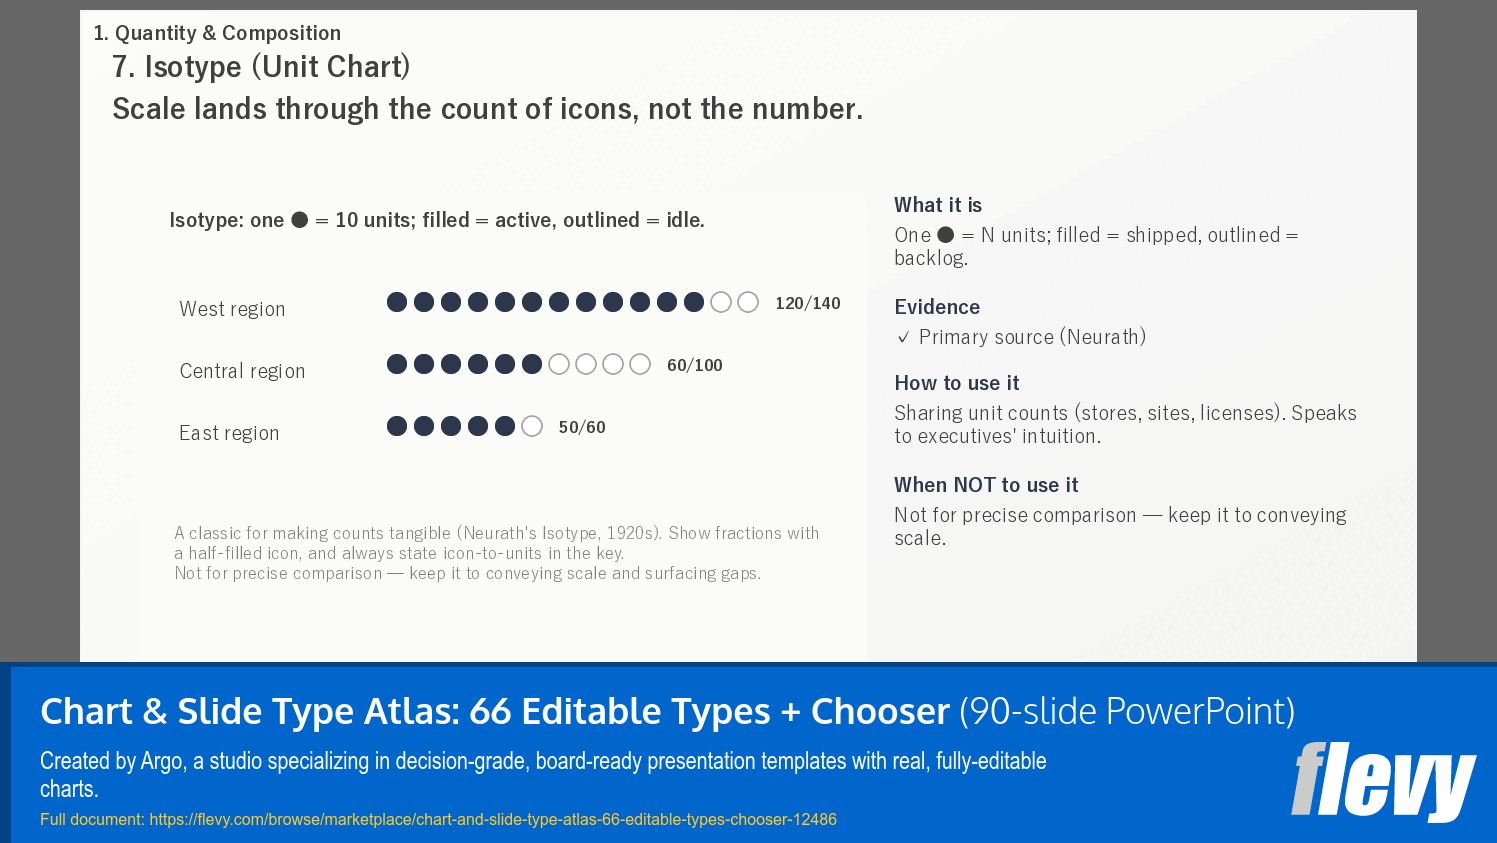
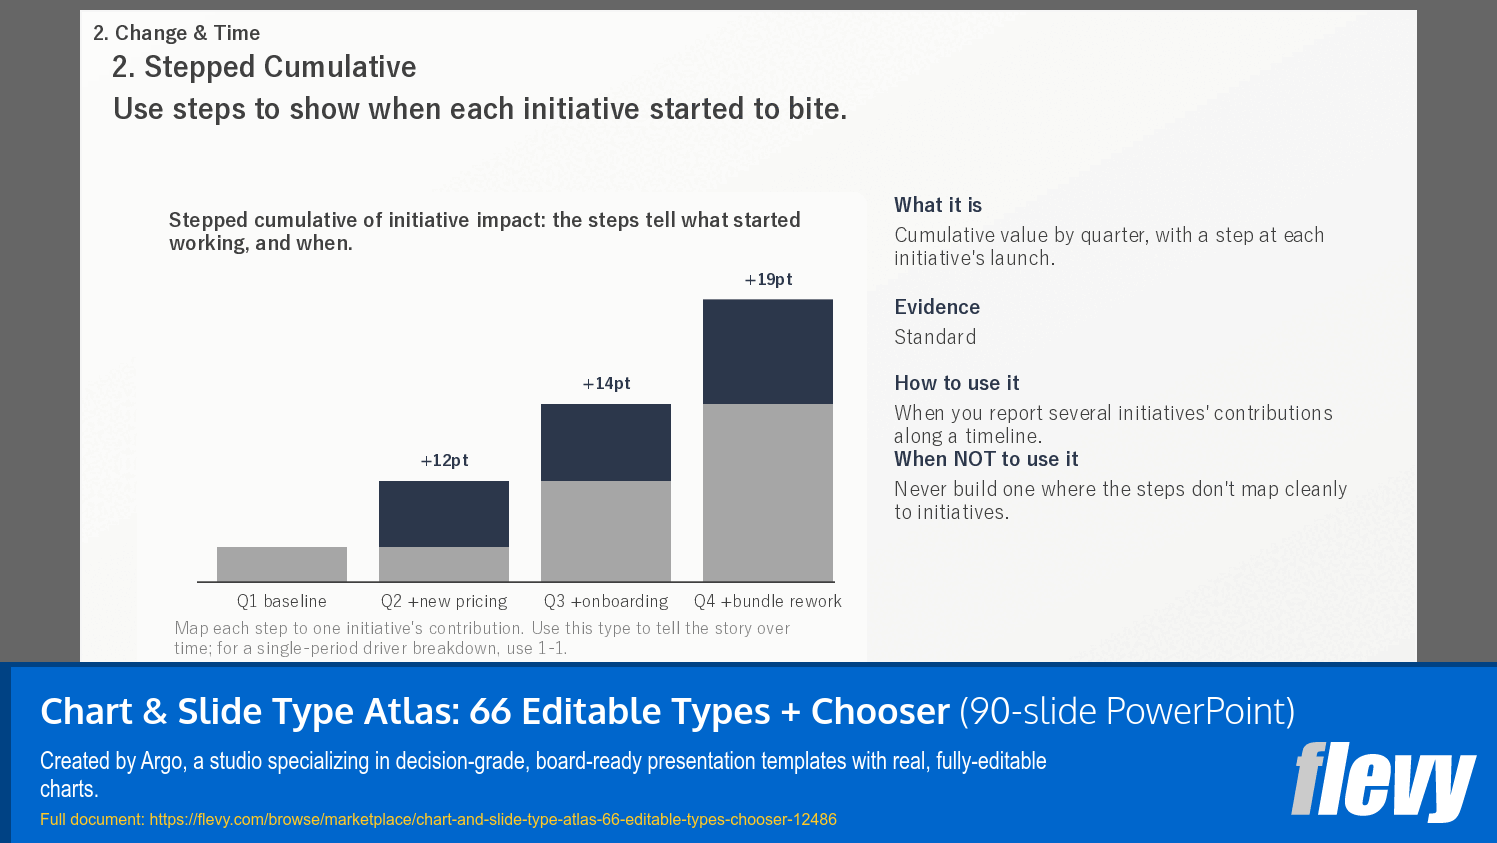
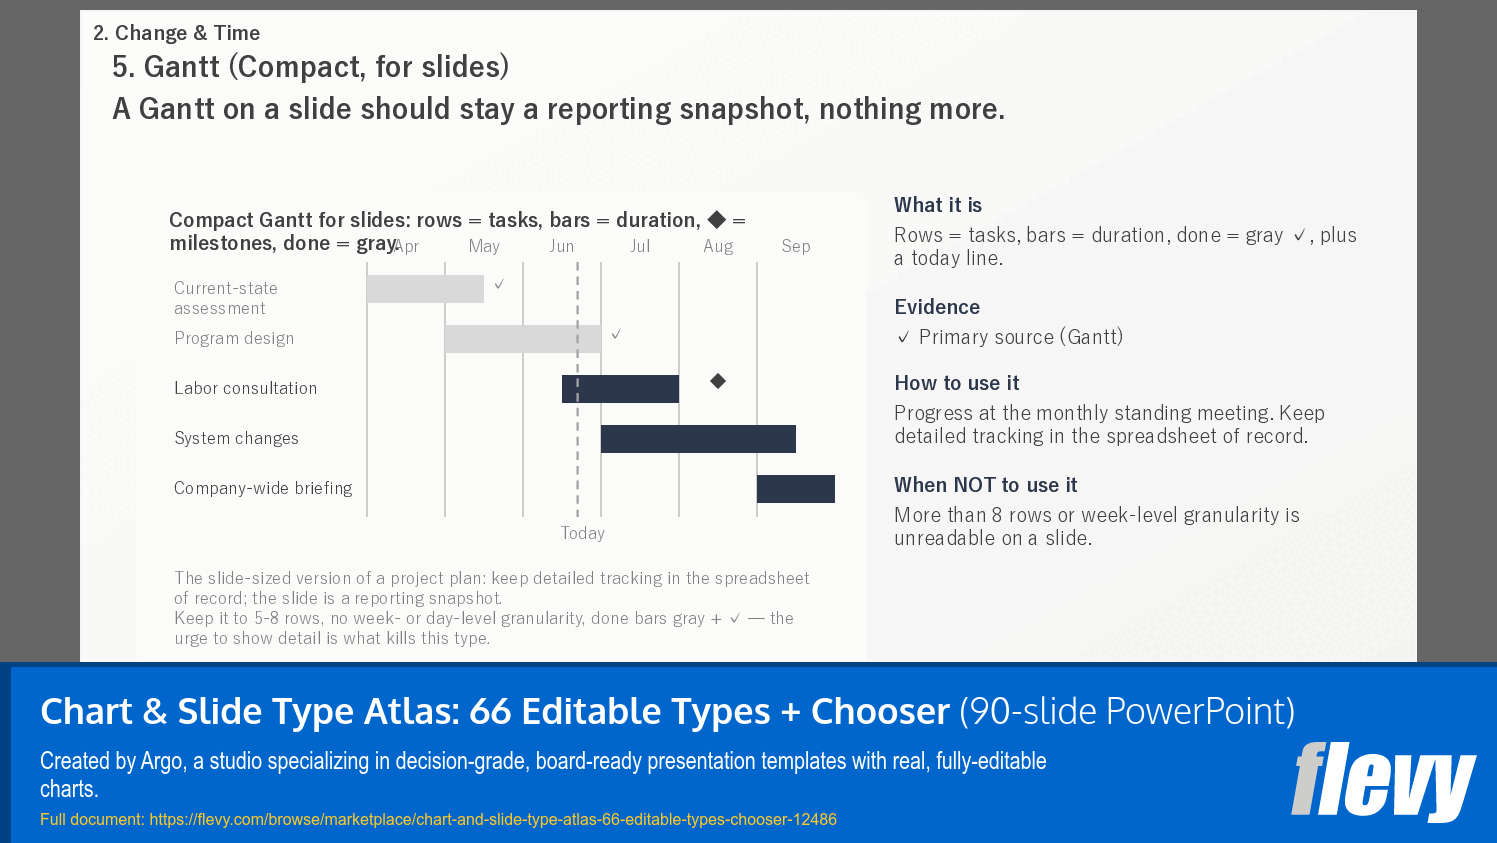
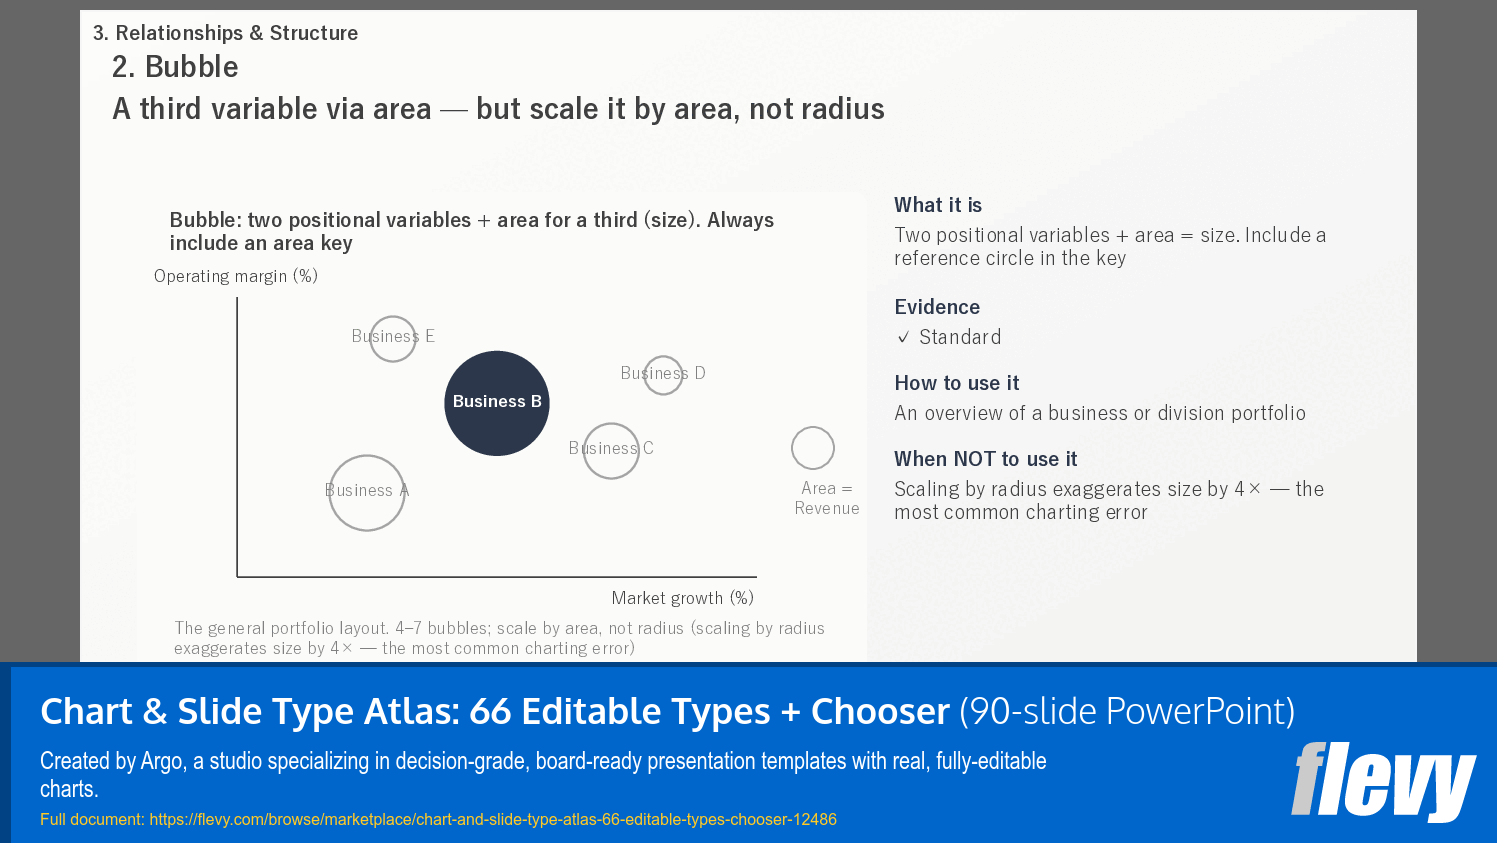
The catalog is 66 numbered entries across 9 chapters, and the split is worth knowing before you buy. Chapters 1-4 hold the 34 chart types, and here they all are. Quantity and composition: waterfall, Marimekko, small multiples, bullet graph, diverging stacked bars, paired distribution, isotype, dual-axis combo, Pareto. Change and time: slope, stepped cumulative, S-curve, chevron roadmap, Gantt, cohort retention. Relationships and structure: scatter with quadrants, bubble, Venn, dependency network, hub and spoke, Sankey, swimlane, logic tree, force field. Evaluation and decisions: Harvey Balls, tornado, 2x2 matrix, 3x3 priority grid, risk heatmap, transition matrix, decision tree, funnel, radar, box plot.
Chapters 5-7 are 13 notation and mechanics conventions, among them IBCS scenario notation, a separate variance tier, controlled forecast vocabulary, exhibit numbering, the 12-column grid, a contrast floor and a distribution checklist. Chapter 8 is 15 motion patterns. Chapter 9 puts 4 weak slides beside their remade versions and names every technique used. 47 static pages, 15 motion, 4 worked examples: that is the 66.
Every one of the 47 static pages has the same four fields. What it is. Evidence – the standard, or the primary source where one exists: Few for the bullet graph, Neurath for isotype, Rogers for the S-curve, Tukey for the box plot. How to use it. And When NOT to use it, where the limits are specific: more than seven drivers in a waterfall, more than two series on a radar, an overused "Other" bar.
The Decision Index is 11 pages at the back, and the 7-page type reference is part of those 11 rather than extra. A map of all 66 by purpose. A Chart Chooser where you pick the column that matches what you want to show, then narrow the candidates in it down to one. Two decision flows for the two crowded chapters, comparing in order to decide and showing relationships. Then the reference itself: use it for, common mistakes, one line each. Type numbers such as 4-3 are permanent IDs, so a cross-reference lands you on a page.
The Data Pack rebuilds 15 of those types as real PowerPoint chart objects, each with its own embedded worksheet: waterfall, Pareto, dual-axis combo, bullet graph, diverging stacked bars, paired distribution, slope, S-curve, Gantt, quadrant scatter, bubble, tornado, funnel, radar, variance. Right-click the chart, choose Edit Data, and the worksheet opens on your numbers. That is desktop PowerPoint. Those 15 are the only data-editable charts in the file; every other element is a native shape you retype and recolor, which is quick for a diagram and slow for a dataset. Better to know which one you are buying.
All 108 slides are accounted for: 4 cover and contents pages, 9 chapter dividers, 66 type pages, an 11-page Decision Index, a 17-page Data Pack, and one closing page. One of those four front pages is a title page, so the catalog itself runs 107, which is what each colorway file holds.
Format: .pptx, 16:9, no macros, every sample number illustrative. Set mainly in Noto Sans JP, a free Google font, with small amounts of Yu Gothic and Arial – install Noto Sans JP before you open the file, or PowerPoint substitutes and the text reflows. The accompanying zip holds the same catalog in five colorways (navy, garnet, gold, forest, ink) as separate files, each one complete rather than a recolored cover, with a README and the license. No attribution is required anywhere, and there is no watermark or logo to strip out. Your purchase includes the Commercial tier: one person, unlimited decks for your own business, your employer, or your personal work, including paid, public and investor-facing. Handing finished decks to paying clients as a service is the Extended tier; both are set out in the included . No speaker notes, no exercises, no video – this is a reference, not a course.
Got a question about the product? Email us at support@flevy.com or ask the author directly by using the "Ask the Author a Question" form. If you cannot view the preview above this document description, go here to view the large preview instead.
Source: Best Practices in Chart Design PowerPoint Slides: Argo Atlas (66 Chart Types, 108 Slides, 15 Editable Charts) PowerPoint (PPTX) Presentation Slide Deck, Argo Decks




























