


 Click main image to view in full screen. Unlock all 20 preview images:
Buy Now Pay Later Platform Financial Model – Excel XLSX
Excel (XLSX) + supplemental PDF


BENEFITS OF THIS DOWNLOADABLE EXCEL DOCUMENT
- Connects GMV growth, merchant pricing, credit-vintage losses, recoveries, receivables, funding, operating costs, and customer acquisition to a linked seven-year P&L, cash-flow forecast, and valuation.
- Quantifies BNPL-specific decisions through a 28-quarter loss triangle, warehouse and ABS funding waterfall, regulatory late-fee cases, merchant-fee breakeven, LTV/CAC, and capital-adequacy analysis.
- Accelerates credit, funding, feasibility, and investment discussions with Bear/Base/Bull scenarios, executive and credit dashboards, sensitivity views, driver ranking, and formula-driven audit checks.
FINTECH EXCEL DESCRIPTION
💳 BNPL PLATFORM FINANCIAL MODEL
Buy Now Pay Later combines merchant-acquiring revenue, consumer credit risk, customer acquisition, servicing infrastructure, regulatory exposure, and capital-markets funding. Rapid GMV growth may look attractive while delayed credit losses, funding needs, and first-loss capital weaken cash flow. This fully linked Excel model connects those factors to a seven-year financial forecast and enterprise valuation.
🎯 PURPOSE
The workbook is designed for BNPL founders, fintech operators, credit-risk teams, treasury and capital-markets professionals, investors, lenders, consultants, and corporate-development analysts evaluating a platform launch, growth plan, funding strategy, portfolio, or investment opportunity.
⚙️ CENTRALIZED ASSUMPTIONS
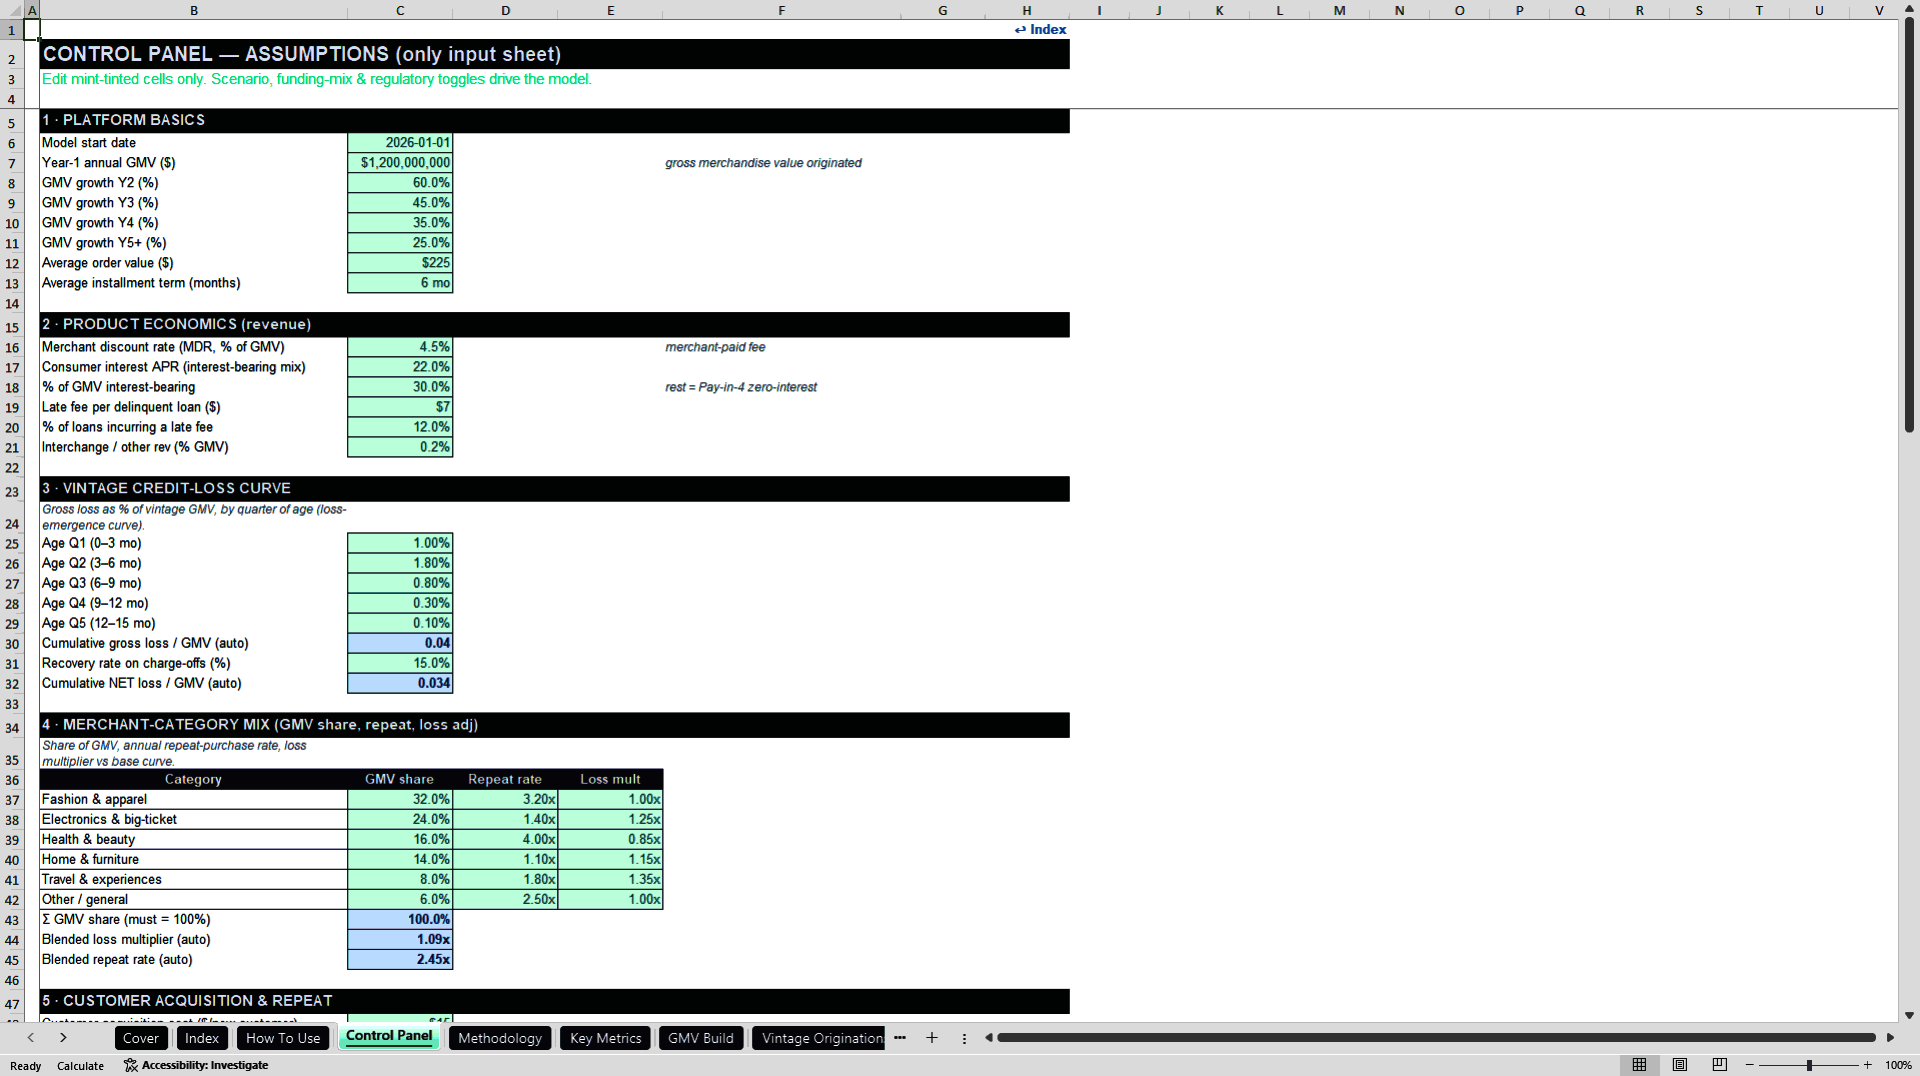
All editable assumptions are located on one Control Panel, where mint-tinted cells are separated from formulas.
• Platform inputs cover GMV, growth, average order value, installment term, and customers.
• Revenue inputs cover merchant discount rate, consumer APR, interest-bearing share, late fees, and interchange.
• Credit inputs cover a five-quarter loss-emergence curve, recoveries, merchant-category mix, repeat frequency, and loss multipliers.
• Funding inputs cover warehouse, ABS, or blended funding, advance rates, rates, fees, first-loss capital, and receivables intensity.
• Cost and capital inputs cover processing, servicing, fraud, technology, G&A, CAC, risk weights, capital thresholds, WACC, tax, and exit multiple.
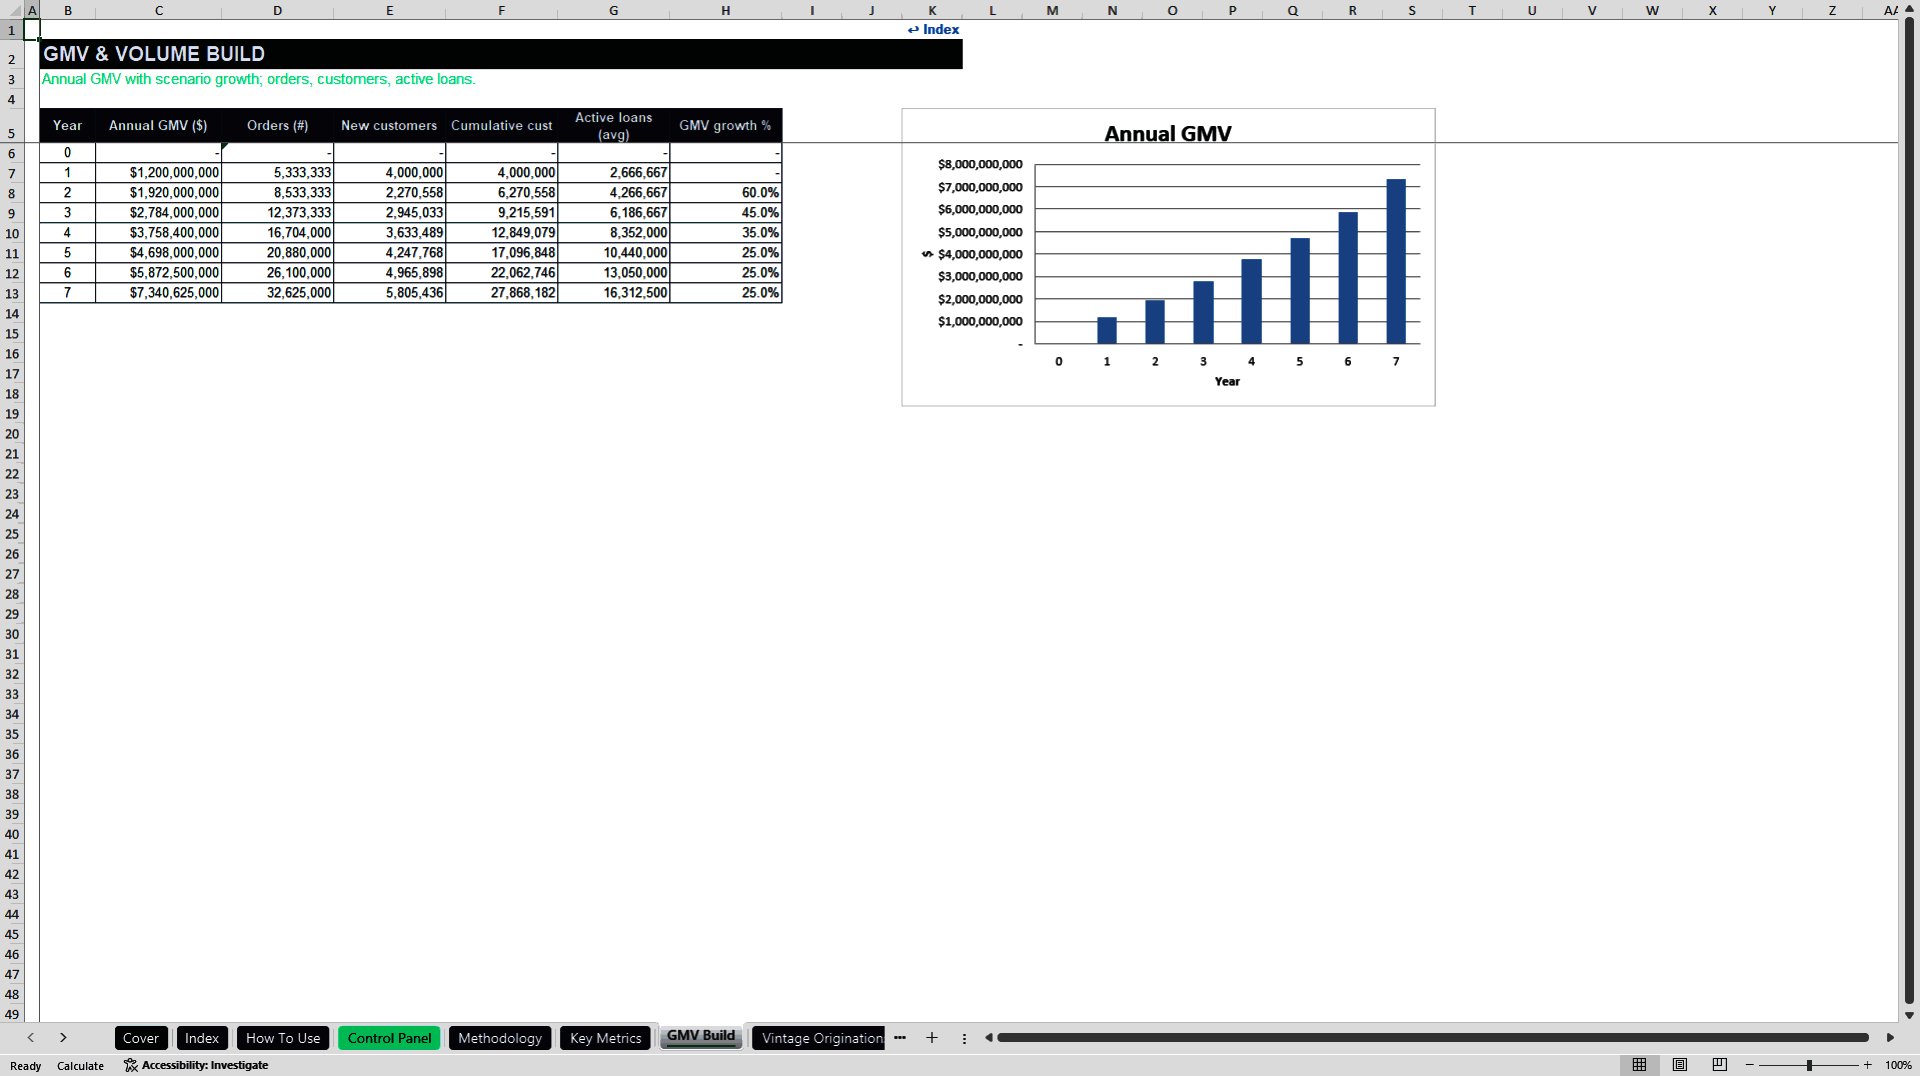
📈 GMV & PORTFOLIO BUILD
The model converts GMV into orders, customers, average active loans, and receivables. Six editable merchant categories—fashion, electronics, health and beauty, home and furniture, travel, and other retail—carry different GMV shares, repeat-purchase rates, and credit-loss multipliers. The portfolio mix therefore affects both customer value and blended risk.
📉 VINTAGE LOSS TRIANGLE
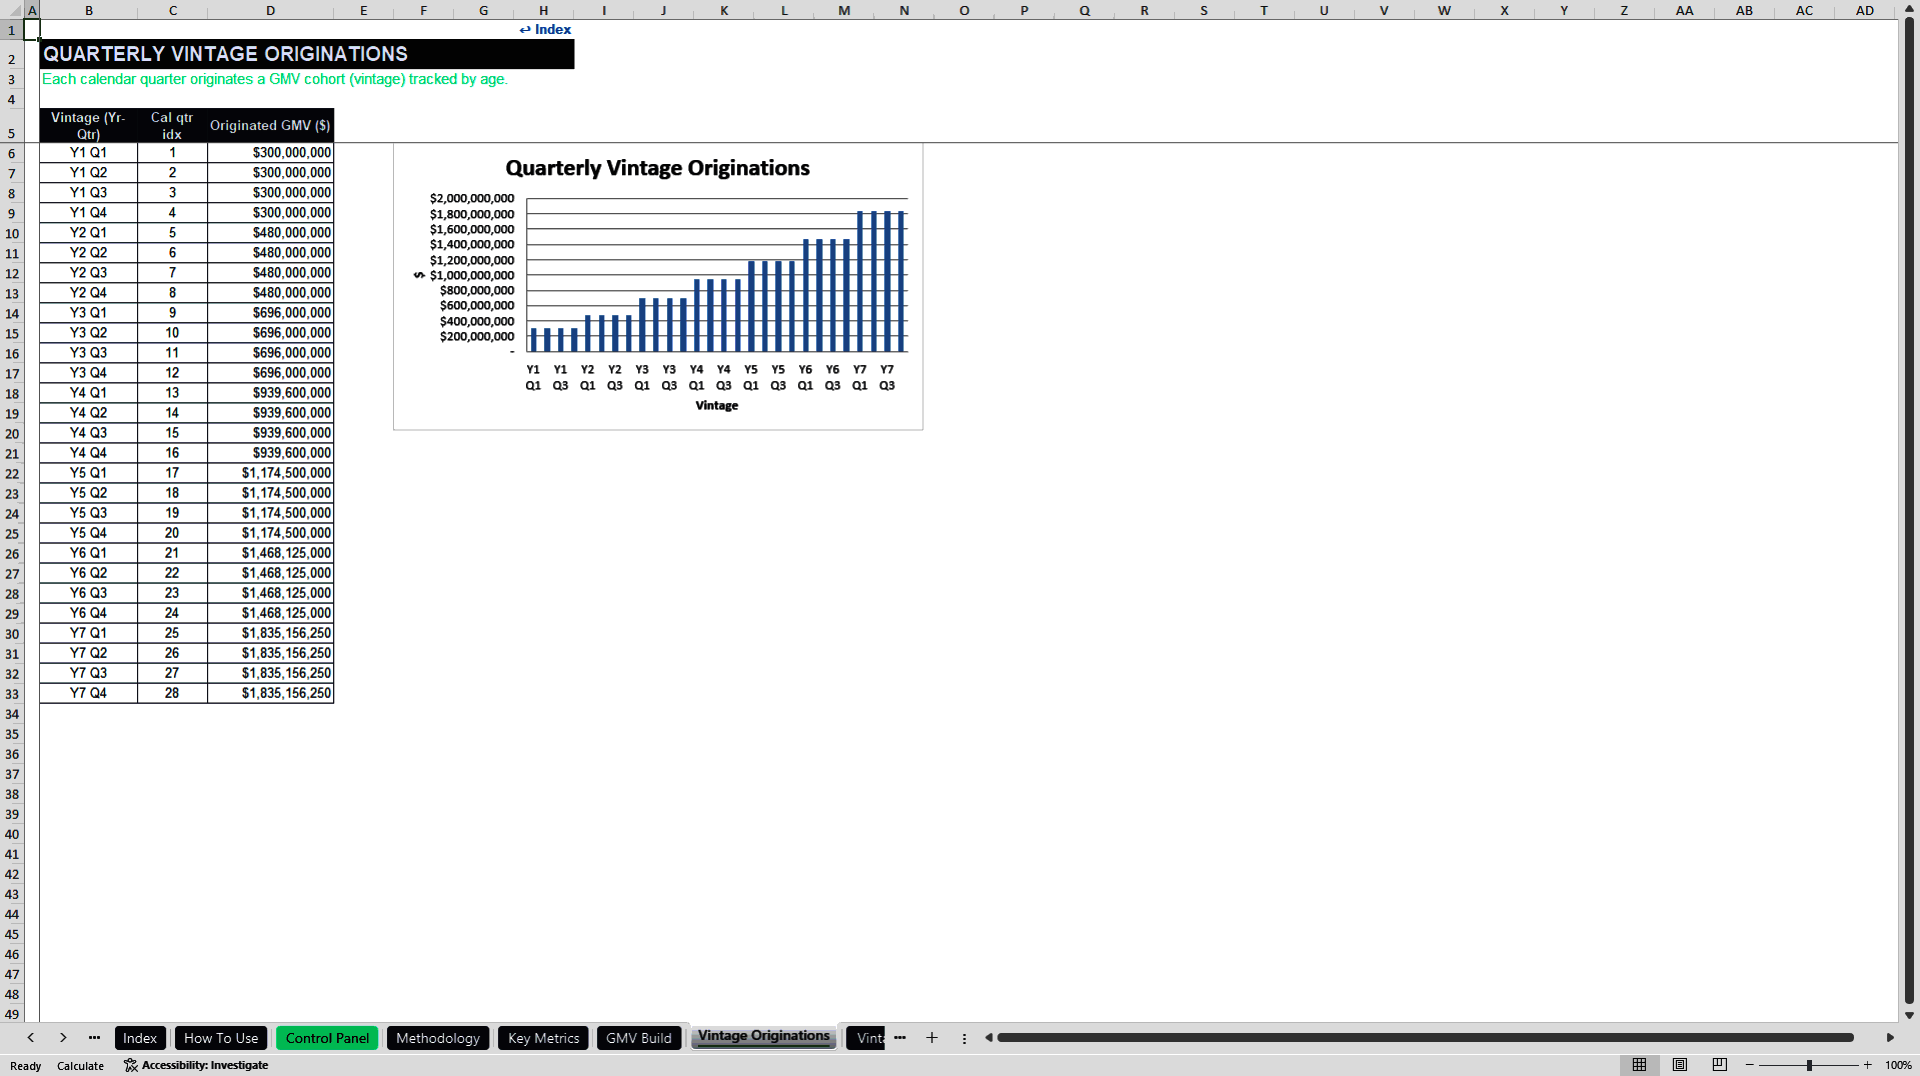
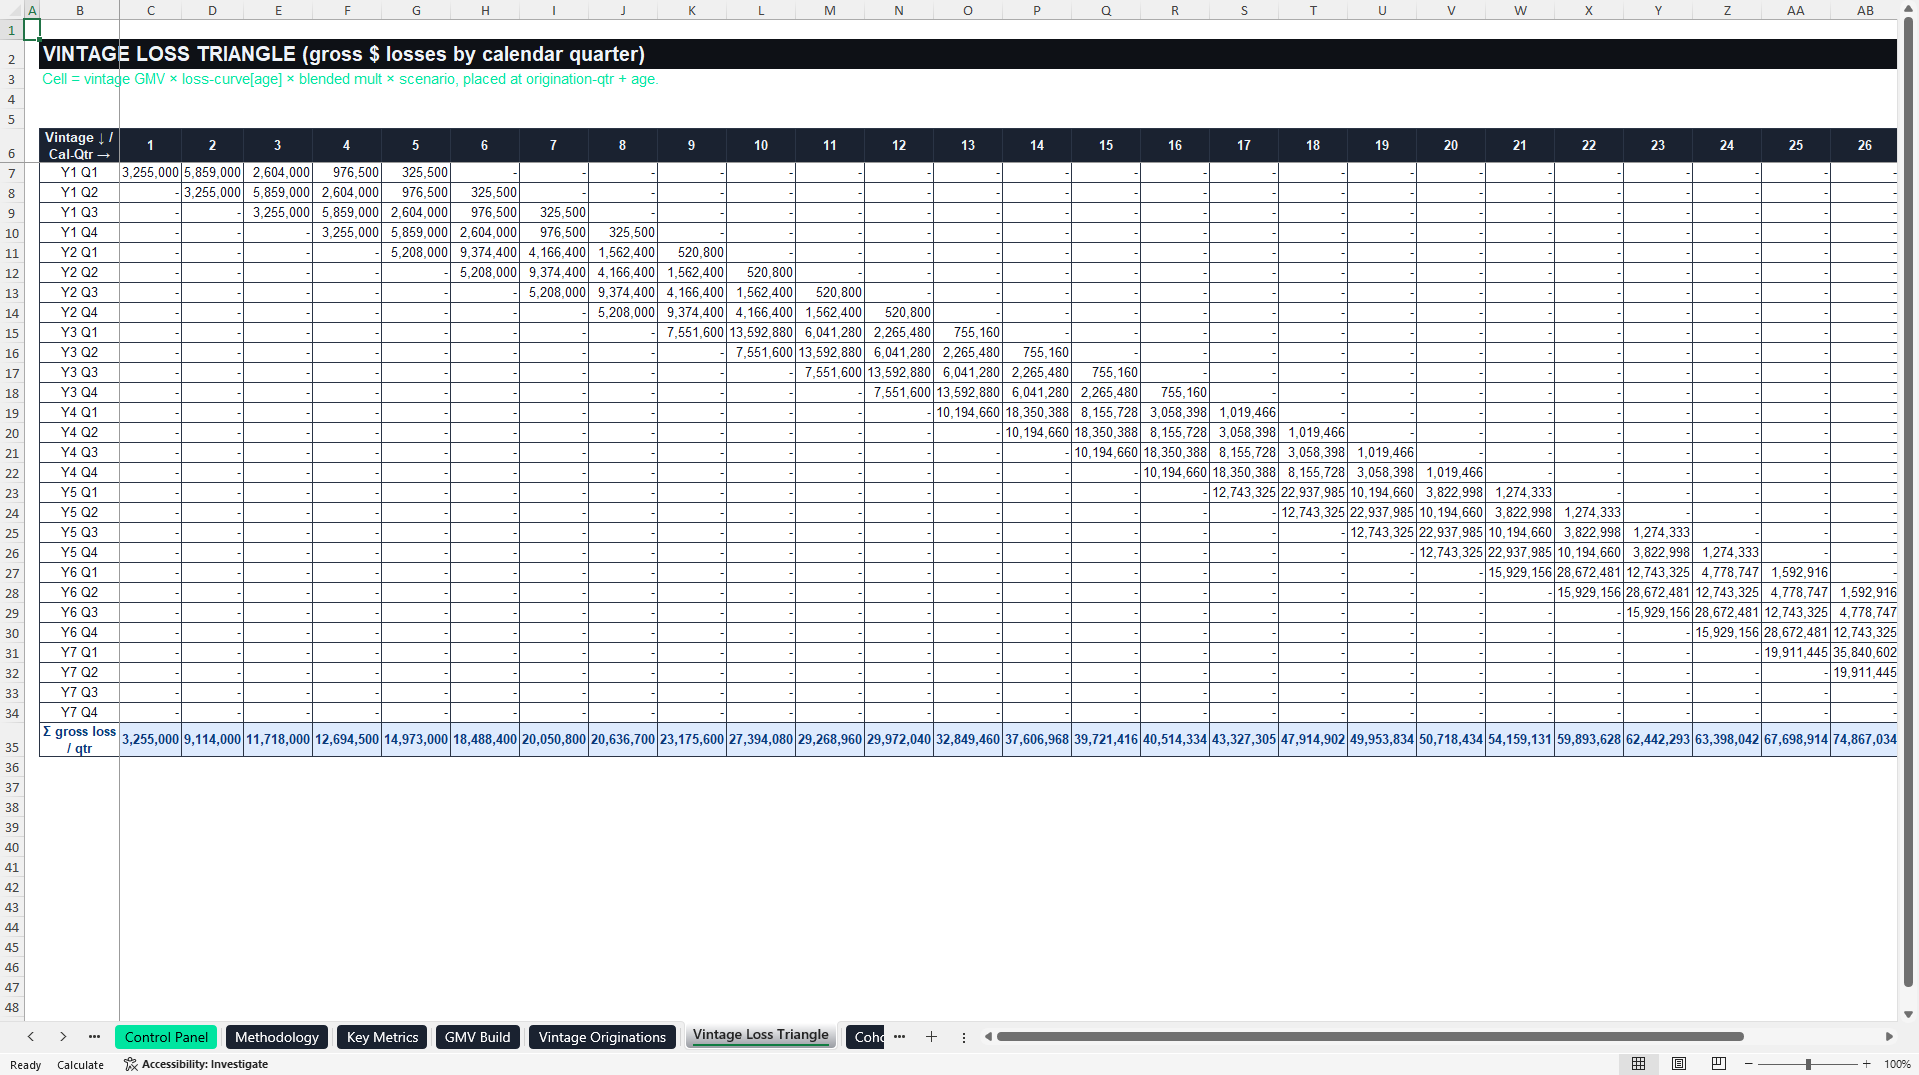
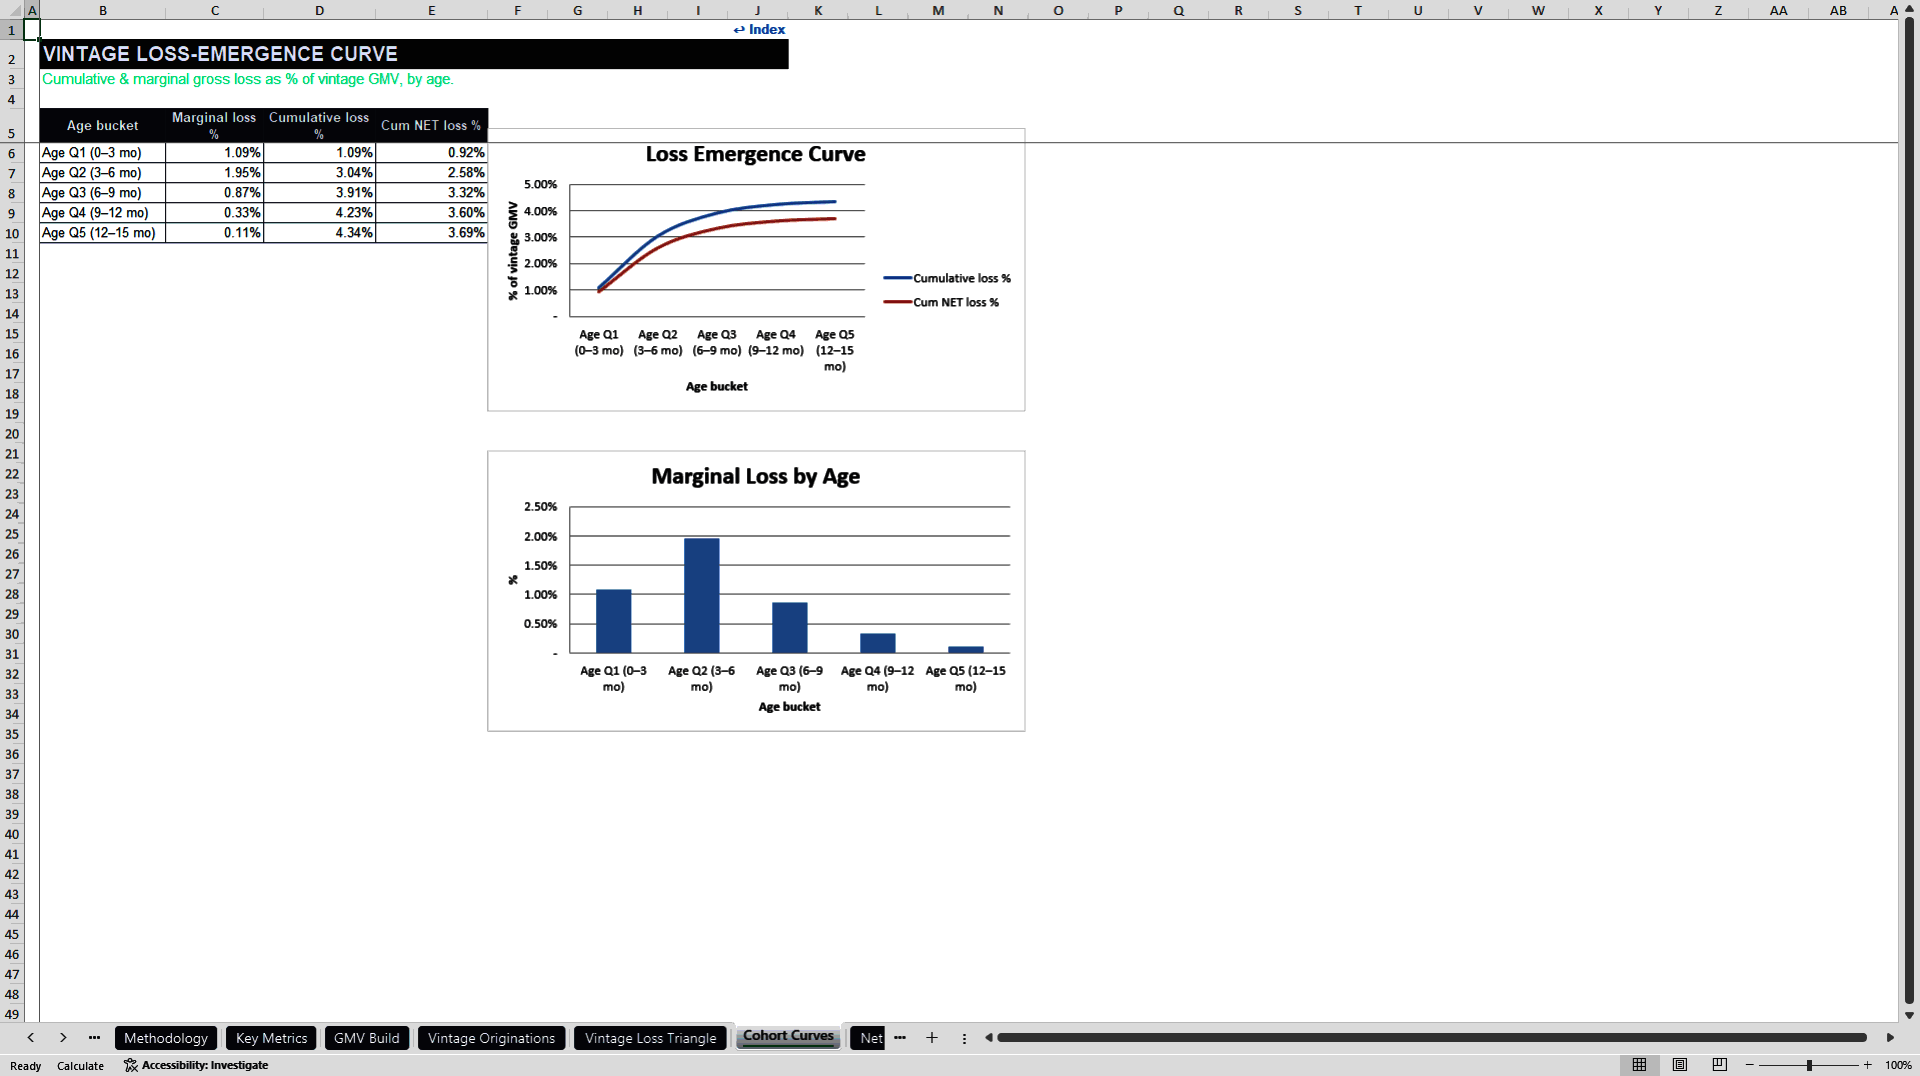
The credit engine divides seven years of GMV into 28 quarterly origination vintages. Each vintage follows a five-quarter marginal loss curve across 0–3, 3–6, 6–9, 9–12, and 12–15 months. A 28 × 28 loss triangle places emerging losses in the correct calendar quarter, and annual schedules calculate gross losses, recoveries, net charge-offs, and NCO as a percentage of GMV.
This diagonal-sum structure shows loss seasoning and avoids recognizing the full lifetime loss at origination. Separate cohort curves report marginal gross, cumulative gross, and cumulative net loss.
💵 REVENUE & REGULATORY CASES
Revenue is separated into merchant discount fees, consumer interest, late fees, and interchange or other income. The workbook calculates each stream, total revenue, and the all-in take rate.
A dedicated late-fee schedule compares current/no cap, $8, $5, $3, and complete-fee-ban cases. It shows the effective fee, maturity-year revenue, share of total revenue, and change versus the current-fee case. The regulatory module is an analytical scenario tool and not a legal interpretation of current rules.
🏦 RECEIVABLES & FUNDING WATERFALL
Average receivables are derived from GMV and divided between funded balances and the equity or first-loss tranche. Users can select a warehouse facility, ABS securitization, or blended structure. The funding waterfall calculates warehouse draw, ABS funding, interest cost, securitization fees, undrawn facility fees, and total annual funding expense.
The schedule supports strategic funding analysis but is not a lender-specific borrowing-base, eligibility, covenant, trigger, or legal-document model.
🧮 COSTS & UNIT ECONOMICS
Operating costs include processing, servicing, fraud, technology and platform expense, and G&A. Customer-acquisition spend is shown separately in the P&L.
The unit-economics module calculates revenue, credit loss, funding cost, variable opex, and contribution per order. It also estimates annual and lifetime orders, lifetime value per customer, CAC, LTV/CAC, CAC-payback orders, and approximate payback months.
A merchant-fee breakeven schedule calculates the MDR required to cover net charge-offs, funding, processing, and fraud. Users should review it together with consumer interest, fees, and interchange because merchant revenue is only one component of total platform monetization.
📊 P&L, CAPITAL & VALUATION
The seven-year P&L presents revenue, cost of risk, funding, opex, CAC, EBITDA, and net income. A simplified Basel III-equivalent schedule calculates credit and operational-risk RWA, capital held, total capital ratio, and annual compliance status against the selected threshold.
Free cash flow is calculated after EBITDA, cash tax, and increases in equity or first-loss capital. Valuation outputs include operating NPV, exit enterprise value based on an editable EV/revenue multiple, present value of the exit, total enterprise value, project IRR including exit, and peak equity funding need.
🧭 SCENARIOS, SENSITIVITIES & DASHBOARDS
Bear, Base, and Bull scenarios flow through GMV growth, credit losses, MDR/take rate, funding cost, and CAC. The workbook also contains illustrative credit-loss versus growth and late-fee-cap versus funding-cost value grids, plus driver ranking for growth, loss, take rate, funding, CAC, regulation, recoveries, and receivables intensity.
An Executive Dashboard summarizes value, return, EBITDA, LTV/CAC, take rate, GMV, credit performance, and driver exposure. A Credit, Funding & Capital Dashboard presents cohort losses, funding costs, capital ratio, and regulatory fee cases. The workbook contains 23 embedded Excel charts.
✅ CONTROLS & WORKFLOW
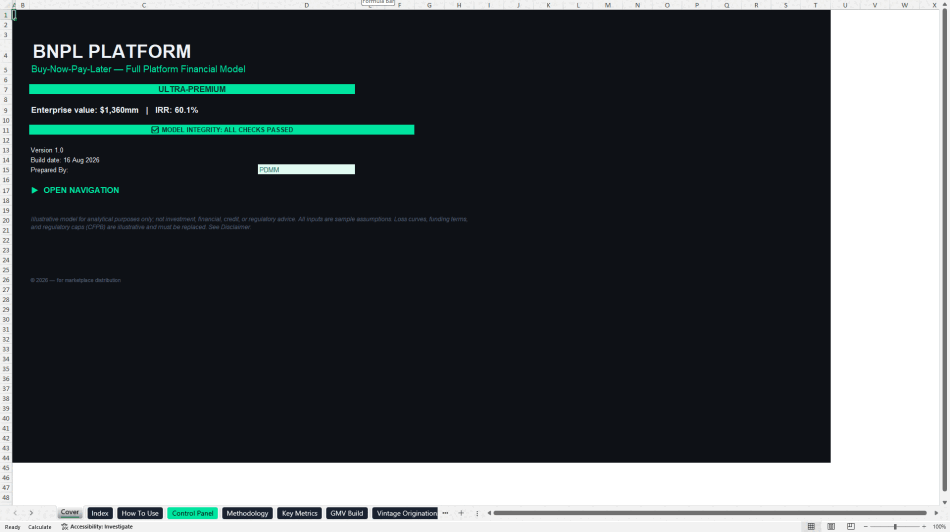
The 32-sheet workbook includes navigation, instructions, methodology, KPI definitions, calculations, dual dashboards, a glossary, assumptions log, disclaimer, and timeline. Twenty formula-driven controls test portfolio mix, loss curves, recoveries, the loss triangle, NCO, receivables funding, revenue, EBITDA, capital, valuation, selectors, and other core relationships. The supplied base case reads ALL CHECKS PASSED.
Recommended workflow:
• Read the instructions and methodology.
• Replace all illustrative inputs on the Control Panel.
• Review portfolio mix and the loss-emergence curve.
• Select funding structure and operating scenario.
• Review credit, receivables, revenue, funding, unit economics, P&L, capital, and valuation.
• Use dashboards and sensitivity views to communicate conclusions.
• Confirm every validation flag and audit check before relying on outputs.
💡 VALUE OF THE DOCUMENT
The model provides a ready-built analytical architecture for a complex fintech business. It connects GMV growth to cohort loss timing, multiple revenue streams, receivables, structured funding, customer economics, capital consumption, profitability, and value. This can shorten the time required to create an initial BNPL feasibility or investment case and focus diligence on the assumptions that most influence performance.
Got a question about the product? Email us at support@flevy.com or ask the author directly by using the "Ask the Author a Question" form. If you cannot view the preview above this document description, go here to view the large preview instead.
Source: Best Practices in Fintech, Integrated Financial Model Excel: Buy Now Pay Later Platform Financial Model Excel (XLSX) Spreadsheet, PDMM Financial Models
ABOUT THE AUTHOR

PDMM Financial Models develops professional, decision-ready Excel models for business owners, entrepreneurs, investors, consultants, analysts, and finance teams. Our objective is to transform complex business assumptions into clear, structured analysis that supports better planning and investment decisions.
Our models cover business planning, forecasting, budgeting, feasibility analysis,
... [read more]
Ask the Author a Question
You must be logged in to contact the author.




























