
Business Turnaround Scenario & Sensitivity Financial Model – Excel XLSX
Excel (XLSX)
VIDEO DEMO
BENEFITS OF THIS DOWNLOADABLE EXCEL DOCUMENT
- This template lets operators and owners quickly forecast a 12–24 month turnaround (with Years 3–5 visibility) using simple, business-agnostic drivers instead of building a bespoke model from scratch.
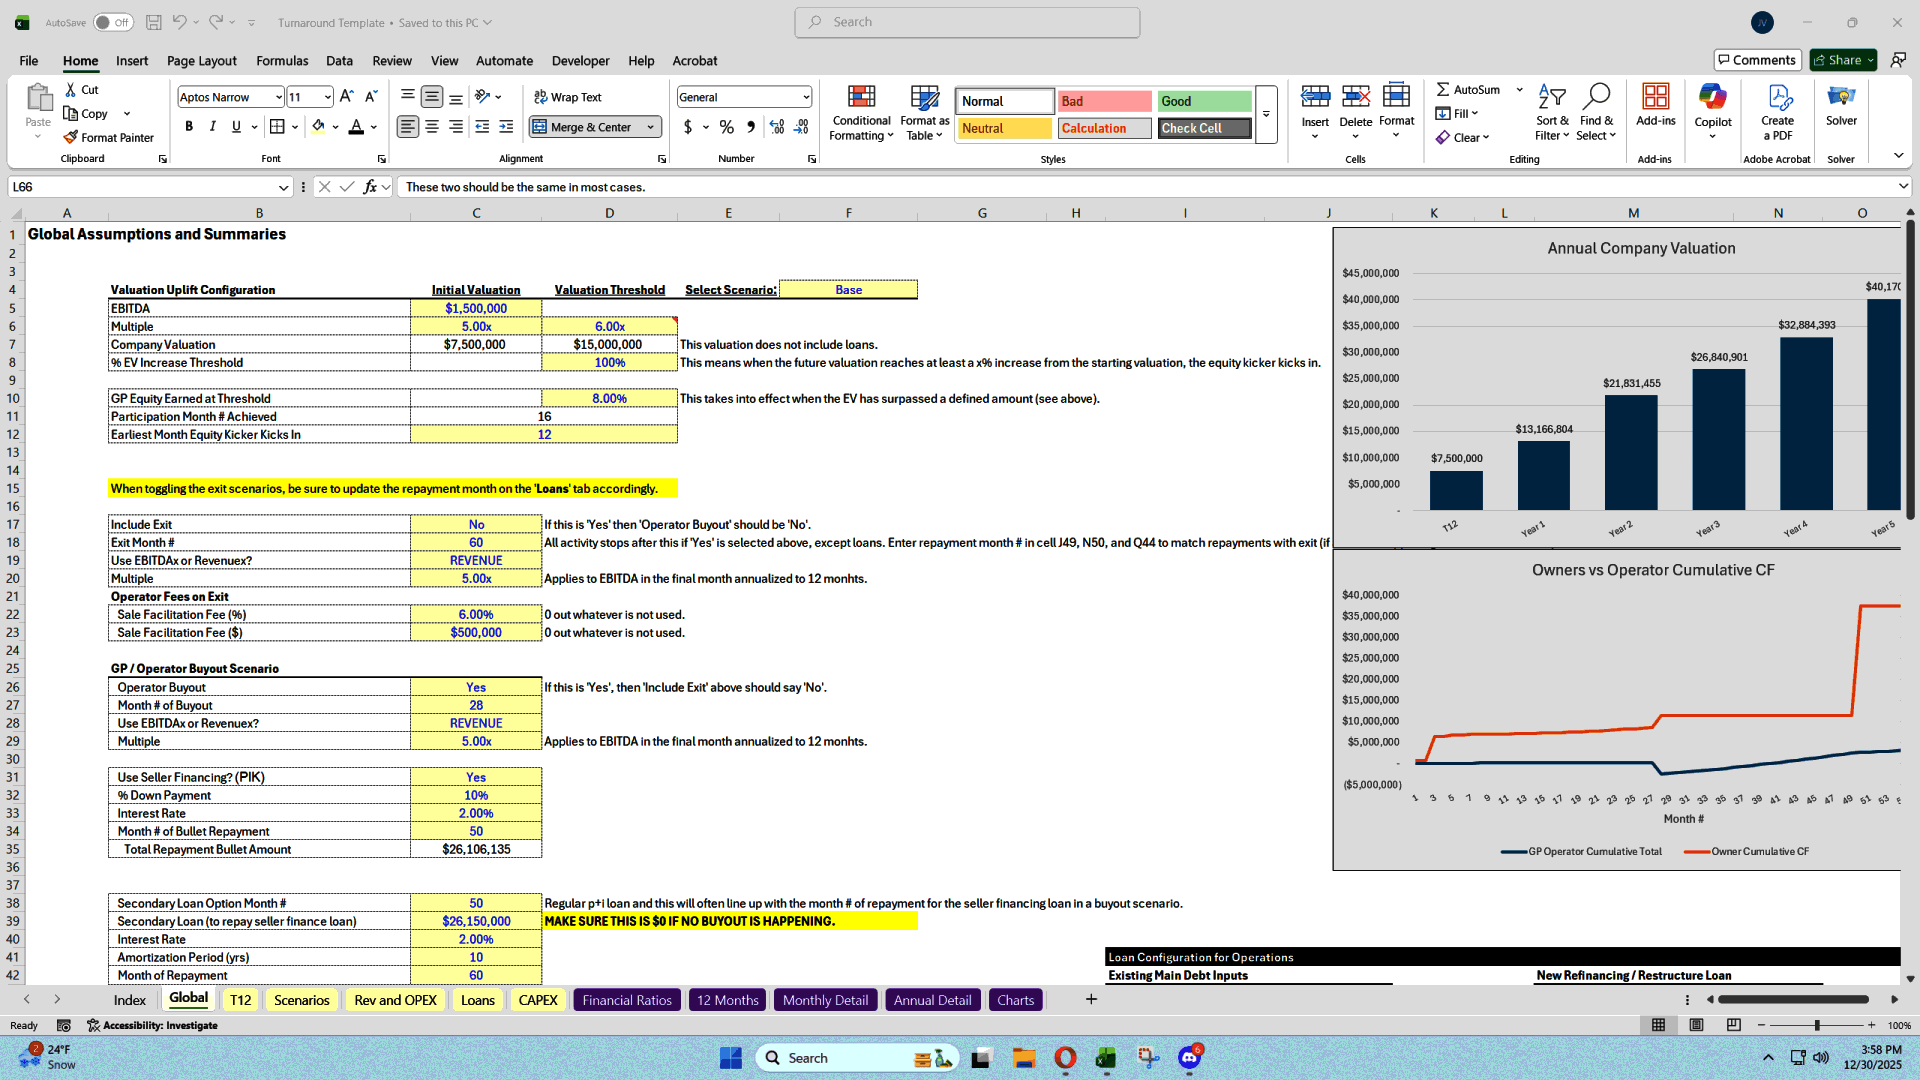
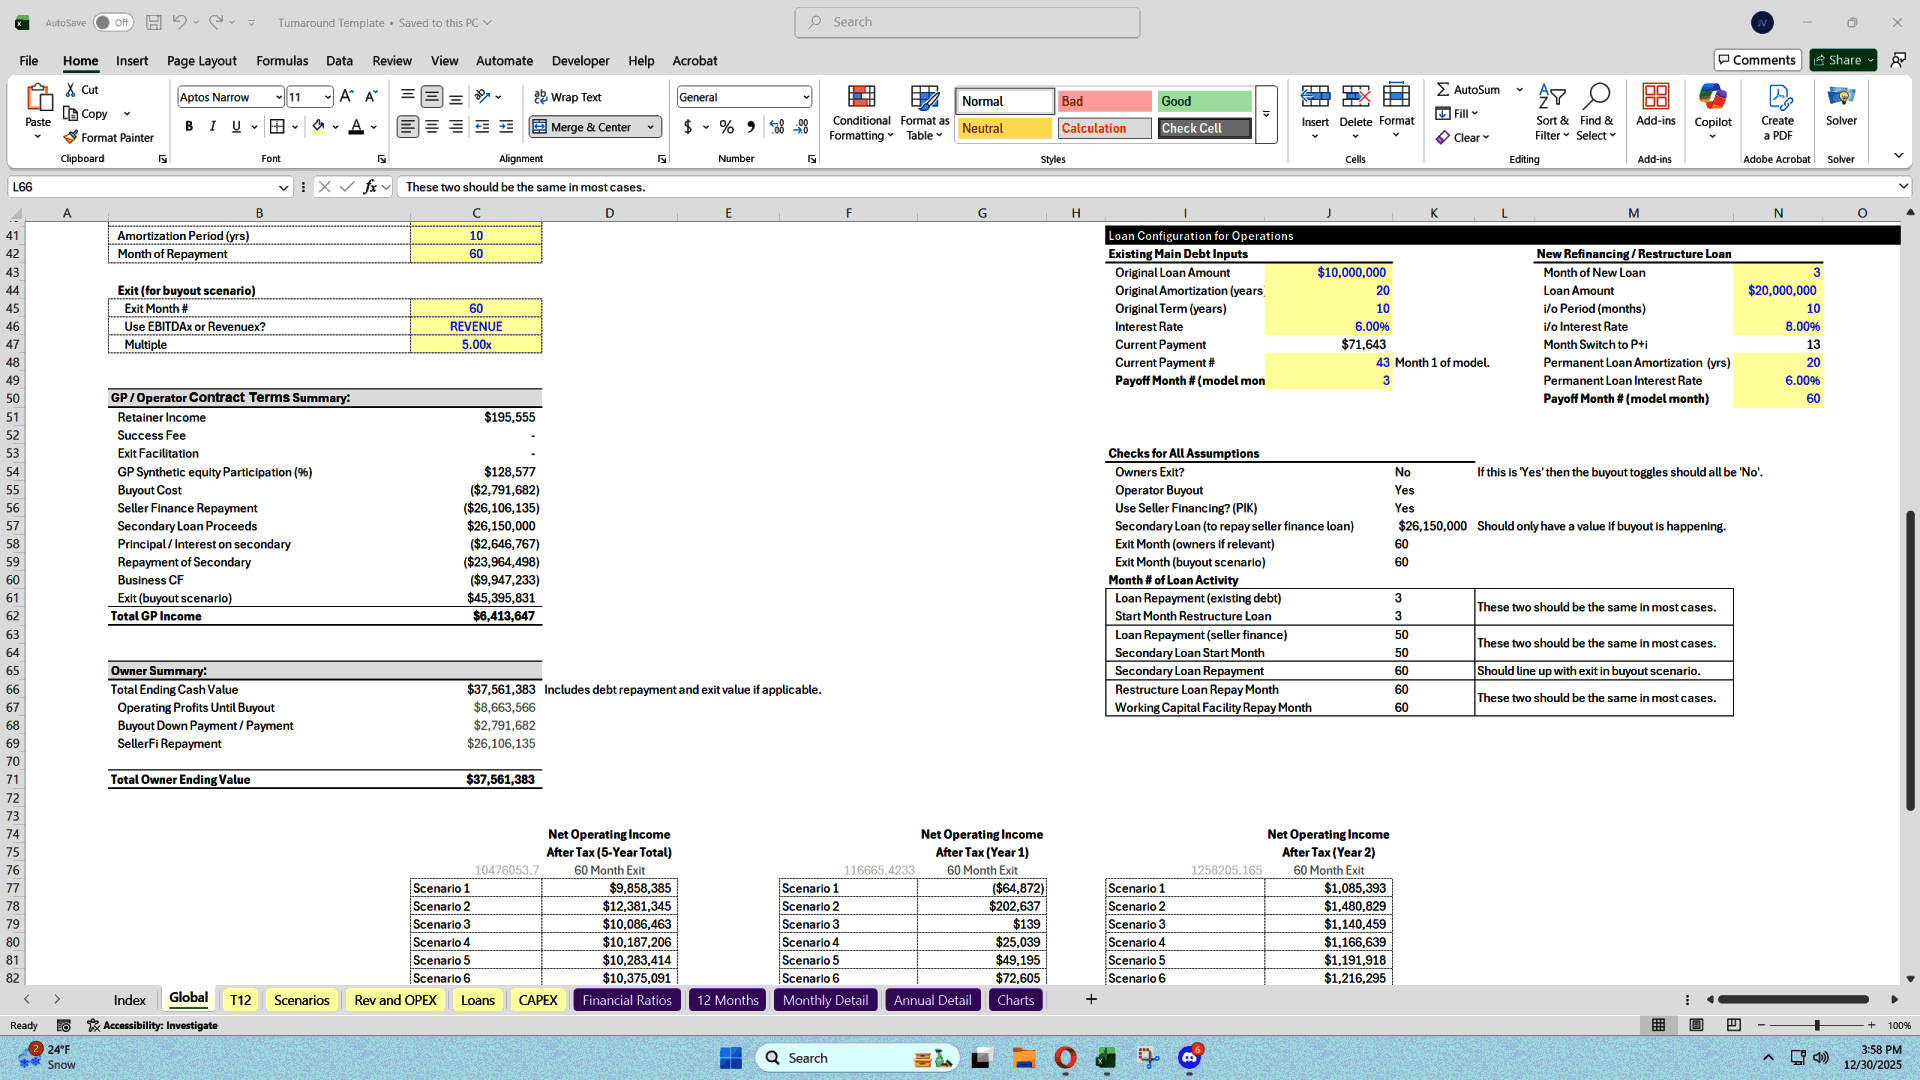
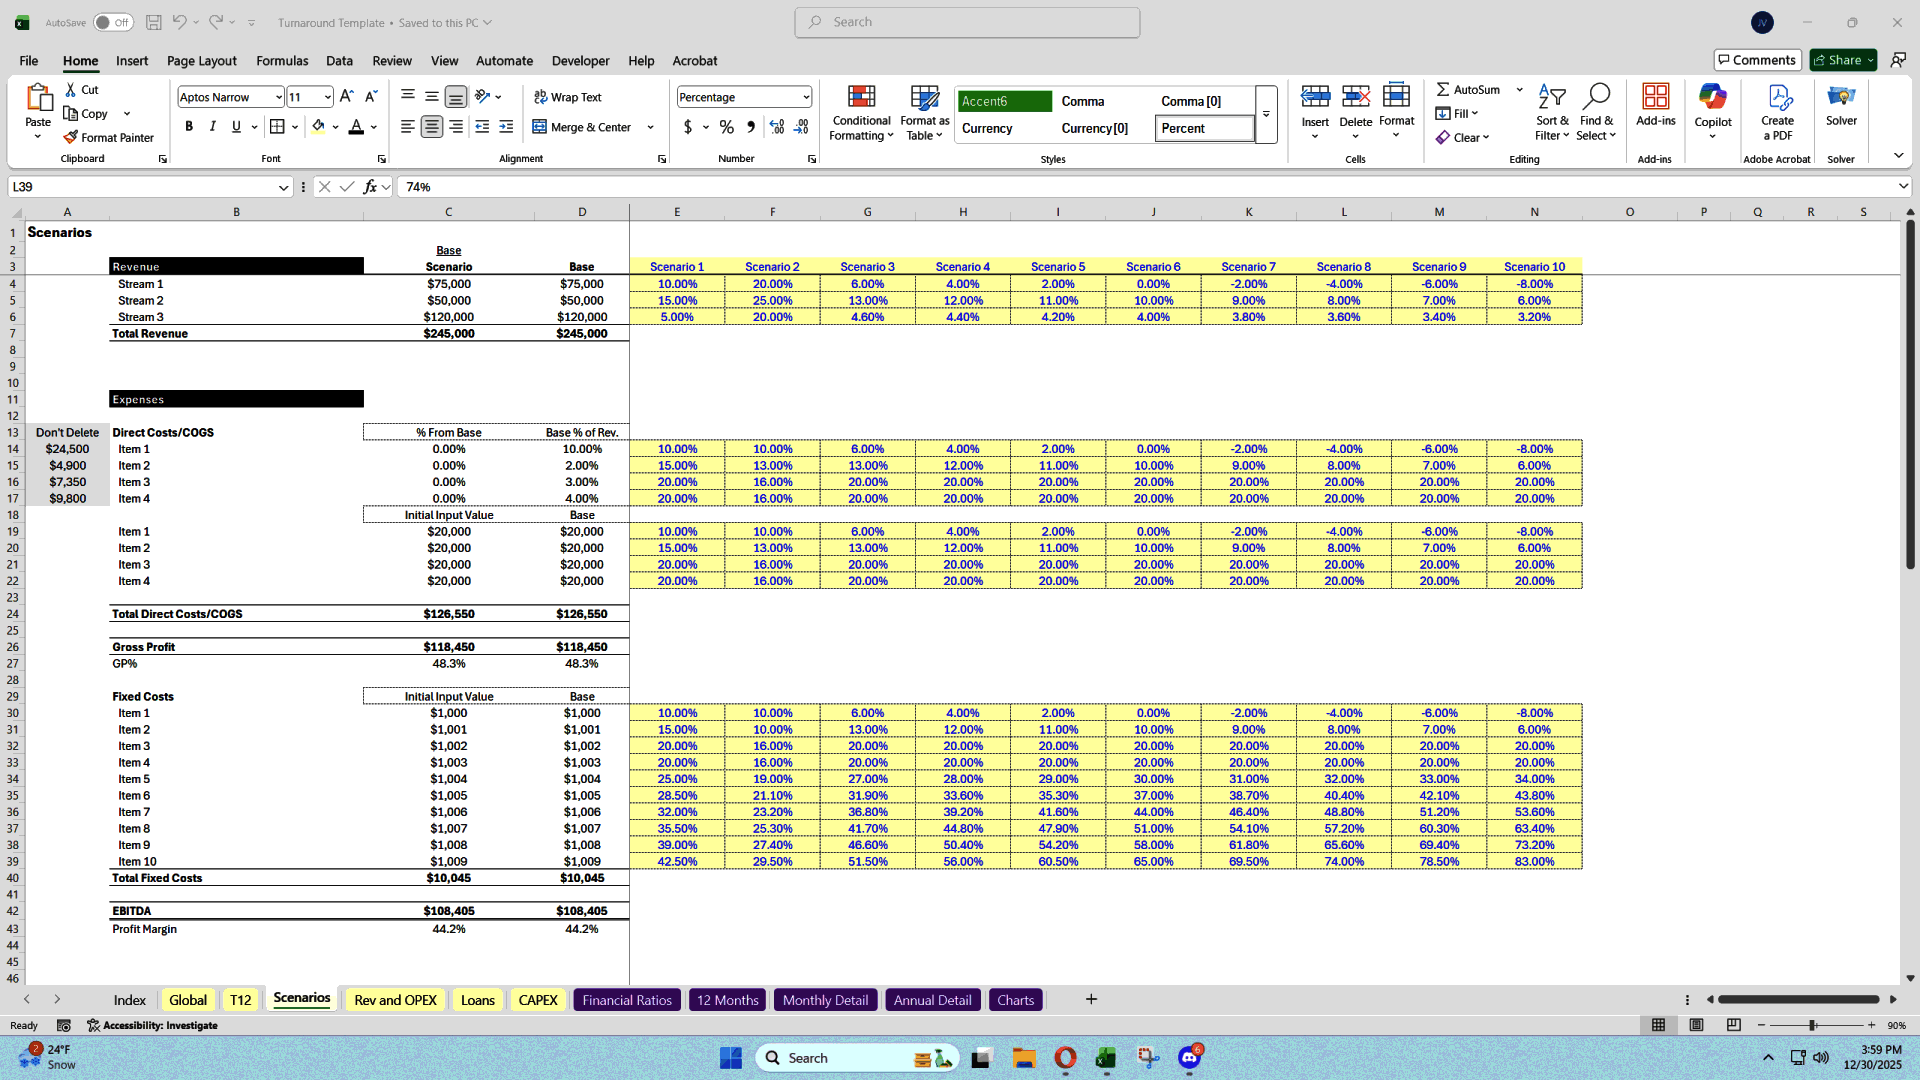
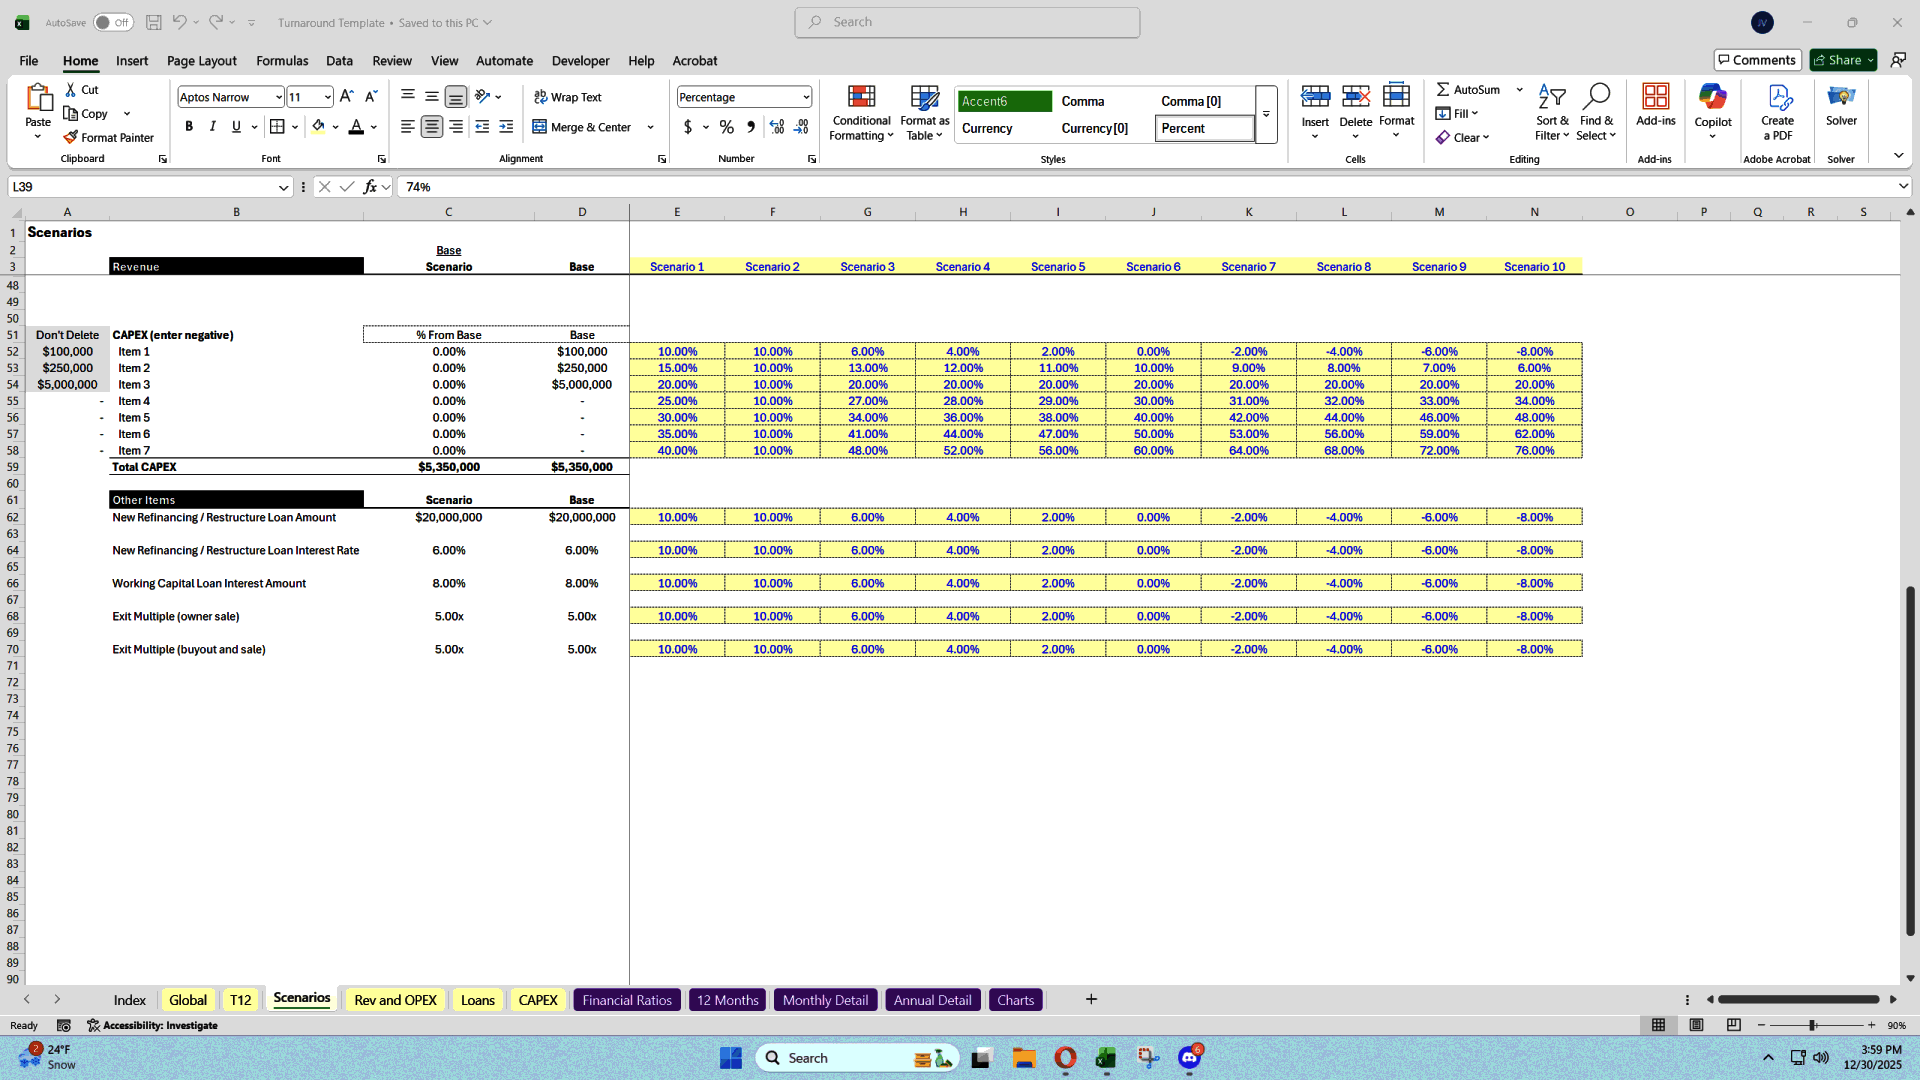
- The built-in 10-scenario toggle and side-by-side sensitivity tables make it easy to compare downside/base/upside outcomes and identify which assumptions matter most.
- The deal-structure framework (fees, equity kicker, exit vs. GP buyout, and financing assumptions) plus the built-in logic checks help ensure the operational plan and transaction terms stay coherent and negotiation-ready.
SCENARIO PLANNING EXCEL DESCRIPTION
Think of this template like a flight simulator for a business turnaround. You're not trying to recreate every bolt and wire of the real airplane (the company's accounting system); you're practicing the critical maneuvers like stabilizing cash flow, improving profitability, and choosing a safe landing plan (sell, keep operating, or buy out). You start with a snapshot of where the plane is today (the trailing 12 months), then you test different control inputs and growth assumptions, cost changes, financing terms to see how the business behaves over the next 12–24 months and beyond.
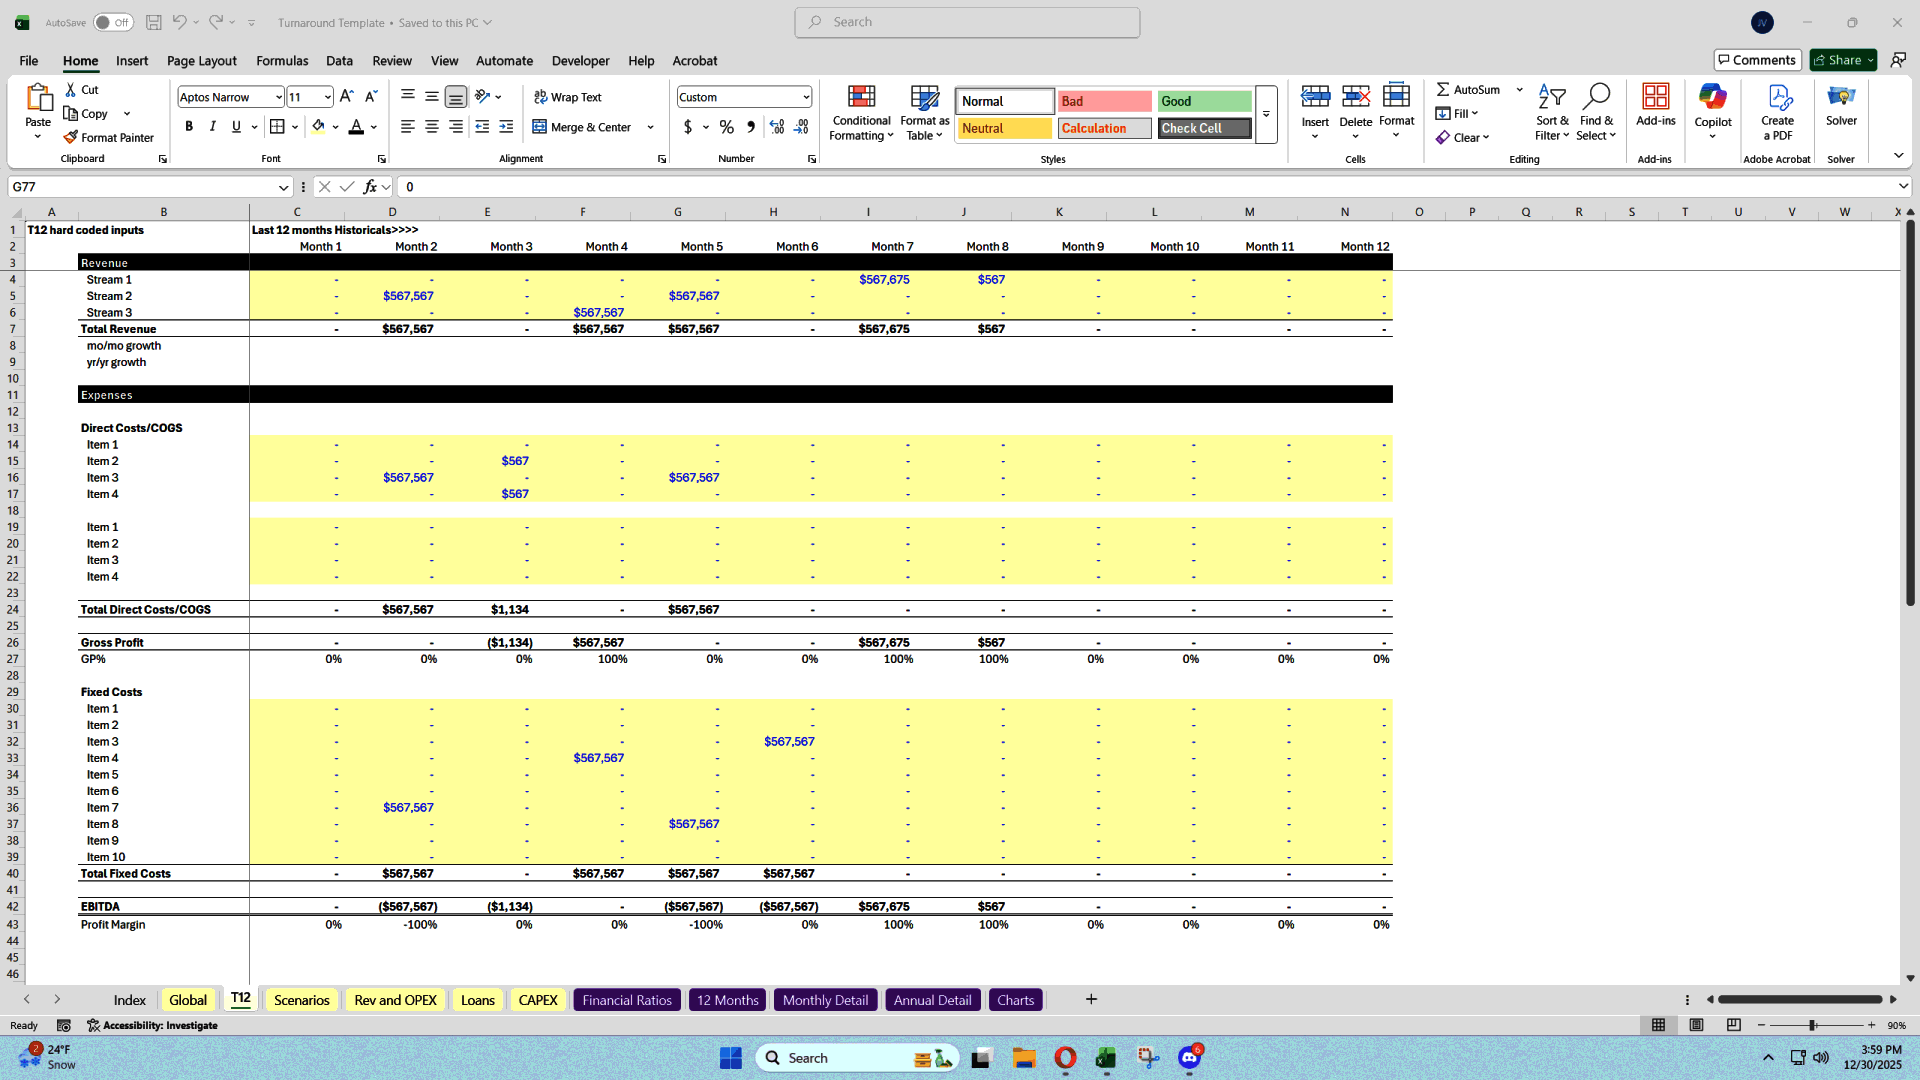
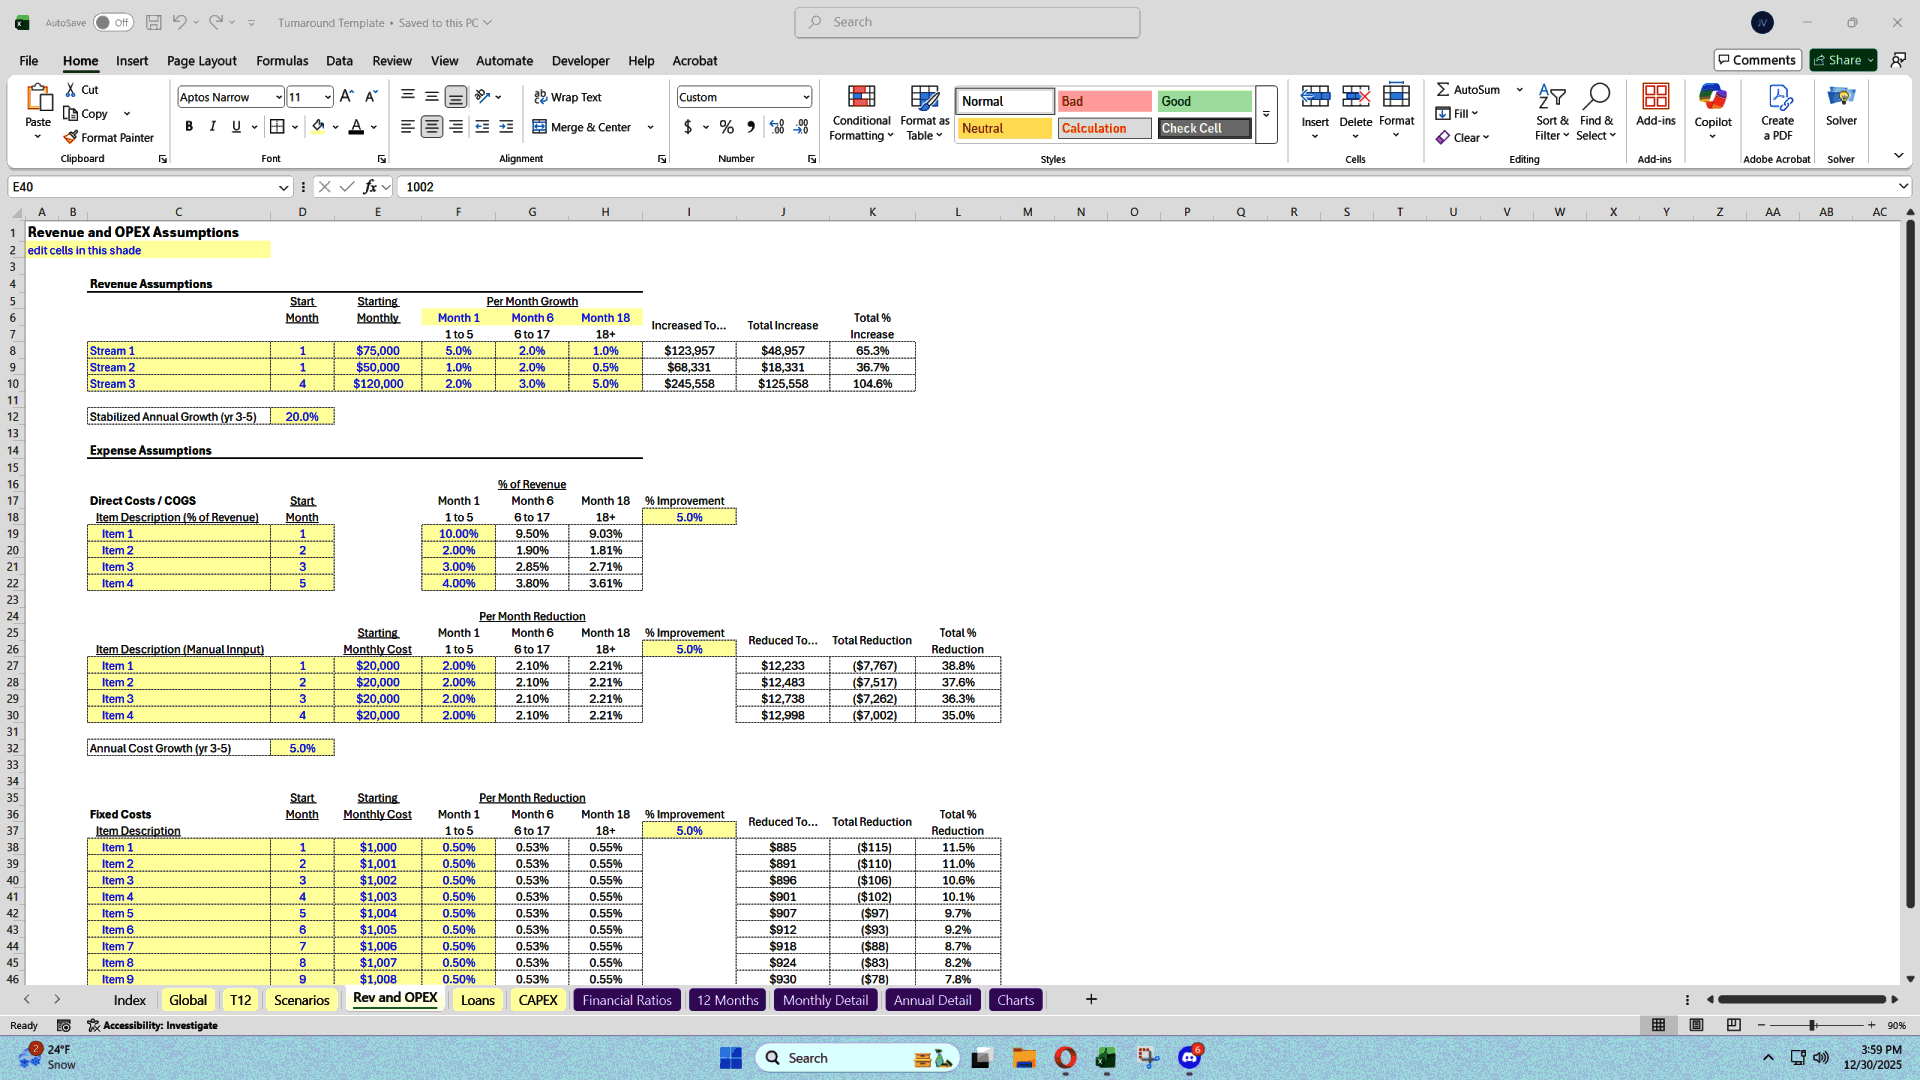
At its core, the model works like a thermostat and timer rather than a detailed blueprint. You enter a starting monthly level for major line items (revenue and costs), then you tell the model how those numbers should change over time using percentage-based "dials." Instead of asking you to micromanage every month differently, it splits the first 24 months into three time blocks, like "Phase 1: triage," "Phase 2: repairs," and "Phase 3: stabilization." After that, it shifts to annual assumptions for Years 3–5, acting more like setting cruise control once the business is flying steadily.
For costs, the template behaves like a two-part recipe: one ingredient scales with the size of the meal, and the other stays relatively fixed. The "scales with the meal" part is direct costs modeled as a percentage of revenue (variable costs). The "fixed ingredient" is direct costs modeled as a dollar input (fixed or semi-fixed costs). That structure lets you capture most real-life turnaround levers such as pricing and margin repair, vendor renegotiations, and operational efficiency without forcing you into an overly complex cost model that only works for one industry.
The scenario feature is best thought of as a lighting board with presets. Instead of manually re-adjusting every slider each time you want to see a different outcome, you can build up to 10 "presets" (downside, base, upside, lender case, aggressive case, etc.). Then you flip one switch and the entire model updates. The sensitivity tables are like having all your presets displayed side-by-side, so you can immediately see how the ending changes when the assumptions change as well as what's driving the difference, what's resilient, and what breaks first.
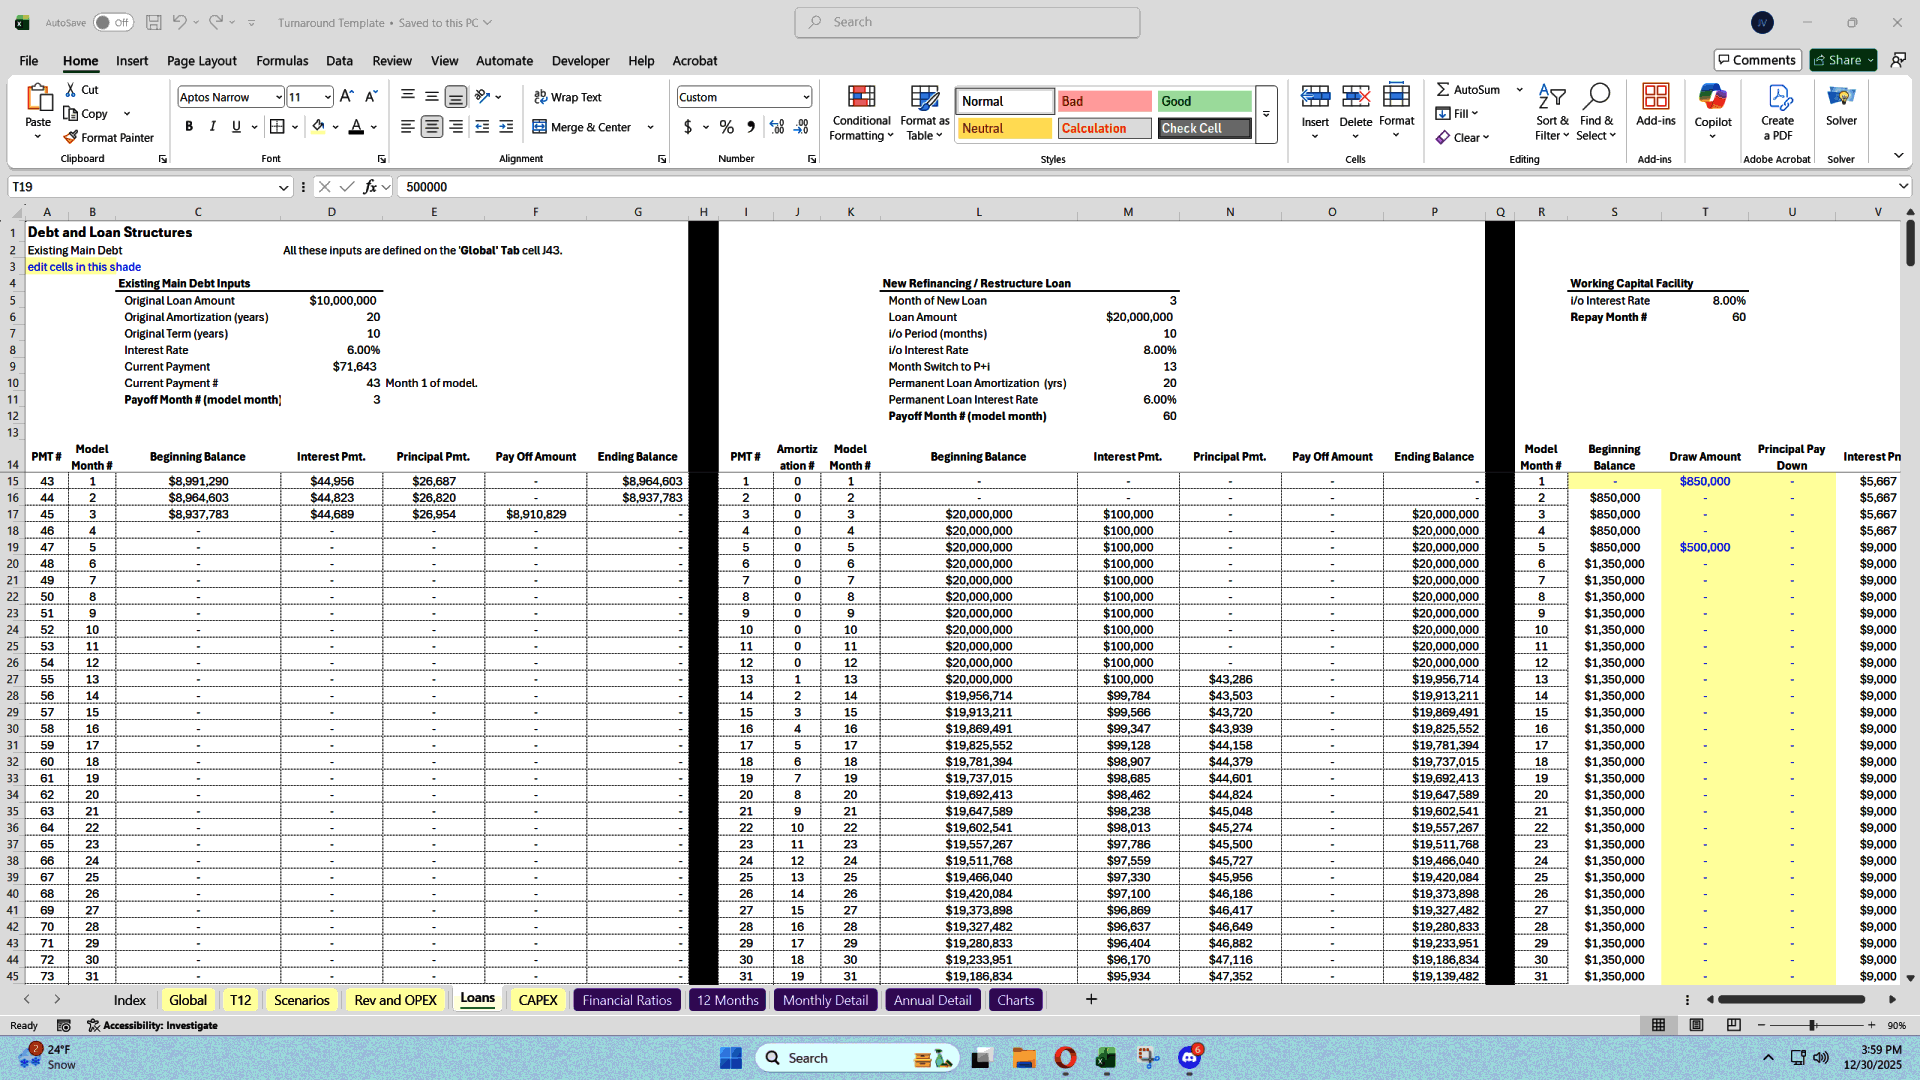
Finally, the deal structure portion is like a choose-your-own-adventure map for the GP/operator and the owners. The operator steps in under a 12-month contract and earns compensation through fees and potentially an equity kicker tied to value creation. This is similar to earning a performance bonus for getting the ship back on course. From there, the path can branch: owners can sell (with an optional GP facilitation fee), keep operating, or the GP can buy out the business using tools like seller financing (PIK), a stabilized loan, and exit multiples. The "check" table functions like guardrails on that map as it flags when you've selected two routes that can't logically happen at the same time, so the story of the turnaround remains consistent from inputs to outcome.
Got a question about the product? Email us at support@flevy.com or ask the author directly by using the "Ask the Author a Question" form. If you cannot view the preview above this document description, go here to view the large preview instead.
TOPIC FAQ
What are the typical short-term phases to model in a business turnaround?
Turnaround work commonly breaks the first 12–24 months into focused phases to reflect different actions and pacing. The approach described separates the first 24 months into 3 time blocks—typically triage, repairs, and stabilization—so you can apply different percentage-based assumption sets across 3 time blocks.How should I represent variable versus fixed costs in a simple turnaround model?
A practical two-part method models cost components that scale with revenue as percentages (variable costs) and components that are entered as dollar amounts (fixed or semi-fixed). This lets you capture margin repair and vendor renegotiation impacts using a percentage-based input and a dollar-based input.When should I use monthly versus annual assumptions in a turnaround forecast?
Use monthly granularity for the immediate recovery period to capture cash timing and interventions, then shift to annual assumptions once performance stabilizes. The model approach uses monthly inputs for the first 24 months (split into 3 blocks) and annual assumptions for Years 3–5.How do scenario presets and sensitivity tables help prioritize turnaround actions?
Scenario presets let you save multiple assumption sets (downside, base, upside, lender case) and flip between them to compare outcomes quickly. Sensitivity tables display those presets side-by-side to show what drives differences and which levers are most and least resilient using side-by-side sensitivity tables.What should I look for when selecting a turnaround financial model for purchase?
Look for a model that balances detail and usability: starting monthly snapshots, phased short-term blocks, percentage-based dials for key lines, variable/fixed cost handling, scenario presets, sensitivity comparisons, and deal-structure tools. Flevy's Business Turnaround Scenario & Sensitivity Financial Model documents these elements with 3 time blocks and up to 10 presets.How much financial modeling skill is required to use a turnaround template effectively?
You’ll need basic-to-intermediate Excel and corporate finance familiarity: entering trailing 12-month starting monthly levels, setting percentage-based growth/cost dials, and interpreting cash runway and sensitivity outputs. The model operates as a thermostat/timer using starting monthly inputs and percentage dials across 3 phases.I’m deciding whether owners should sell, keep operating, or accept a GP buyout—how can modeling inform that choice?
A model can simulate each path’s financial outcomes by applying different control inputs, financing terms, and operator compensation structures, and flag inconsistent choices. The described toolkit includes options for a 12-month operator contract, GP fees and equity kicker, seller financing (PIK), stabilized loans, and exit multiples.How can sensitivity analysis reveal what "breaks first" in a turnaround plan?
By varying key assumptions and showing outcomes side-by-side, sensitivity analysis highlights which inputs (pricing, revenue growth, margin, financing cost) cause the largest swings in ending cash or valuation. The approach uses side-by-side sensitivity tables to show what’s resilient and what fails first.Source: Best Practices in Scenario Planning, Turnaround Excel: Business Turnaround Scenario & Sensitivity Financial Model Excel (XLSX) Spreadsheet, Jason Varner | SmartHelping
ABOUT THE AUTHOR
I graduated in 2011 with a Bachelor's degree in Accounting and began my career as a financial analyst at a small chain of auto repair shops. After gaining valuable experience, I launched my own practice specializing in real estate underwriting, later expanding into general business modeling.
I honed my spreadsheet modeling expertise by completing over 400 projects on Upwork with a 100% success
... [read more]
Ask the Author a Question
You must be logged in to contact the author.
