
 Click main image to view in full screen. Unlock all 20 preview images:
Vertical Farming Financial and Valuation Model – Excel XLSX
Excel (XLSX) + supplemental PDF


BENEFITS OF THIS DOWNLOADABLE EXCEL DOCUMENT
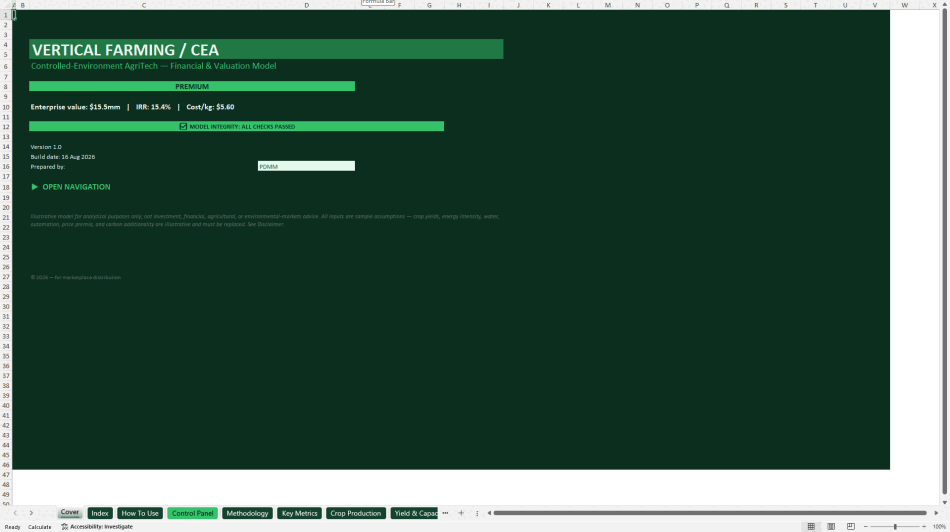
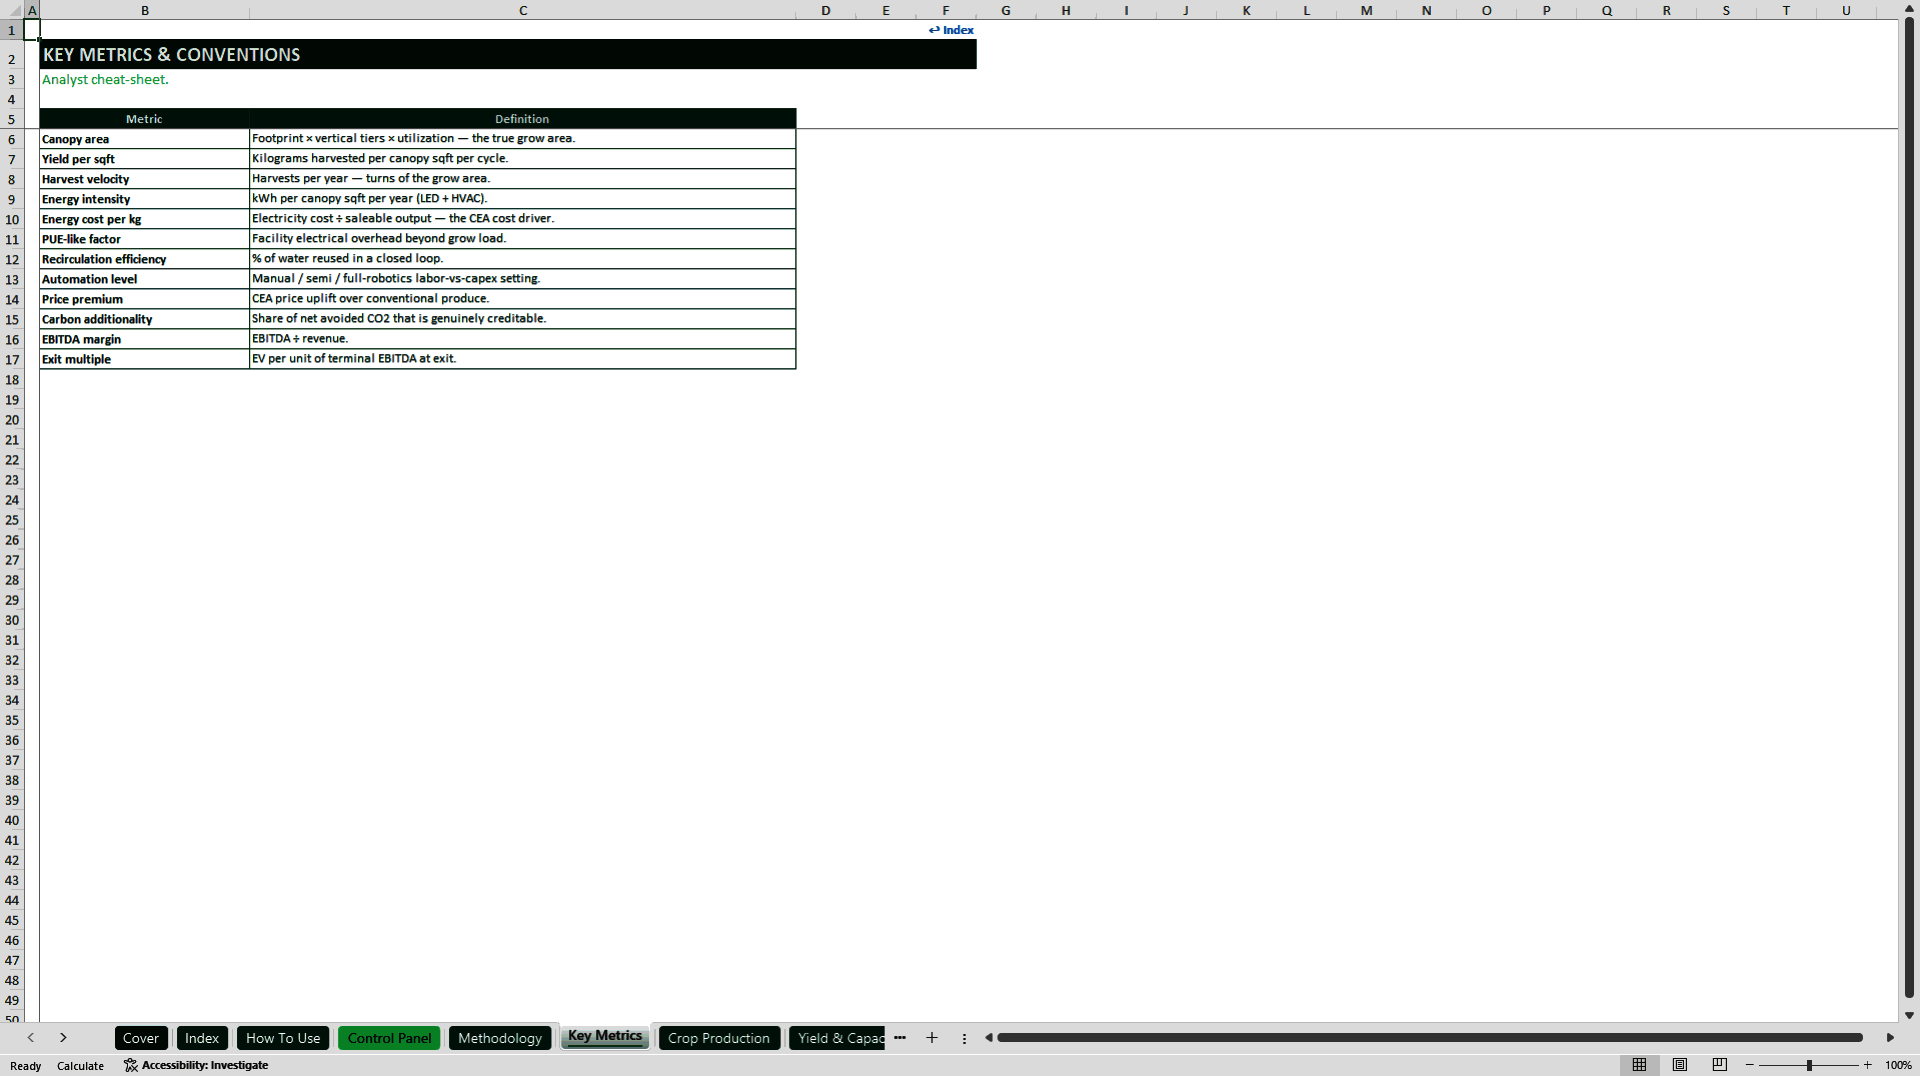
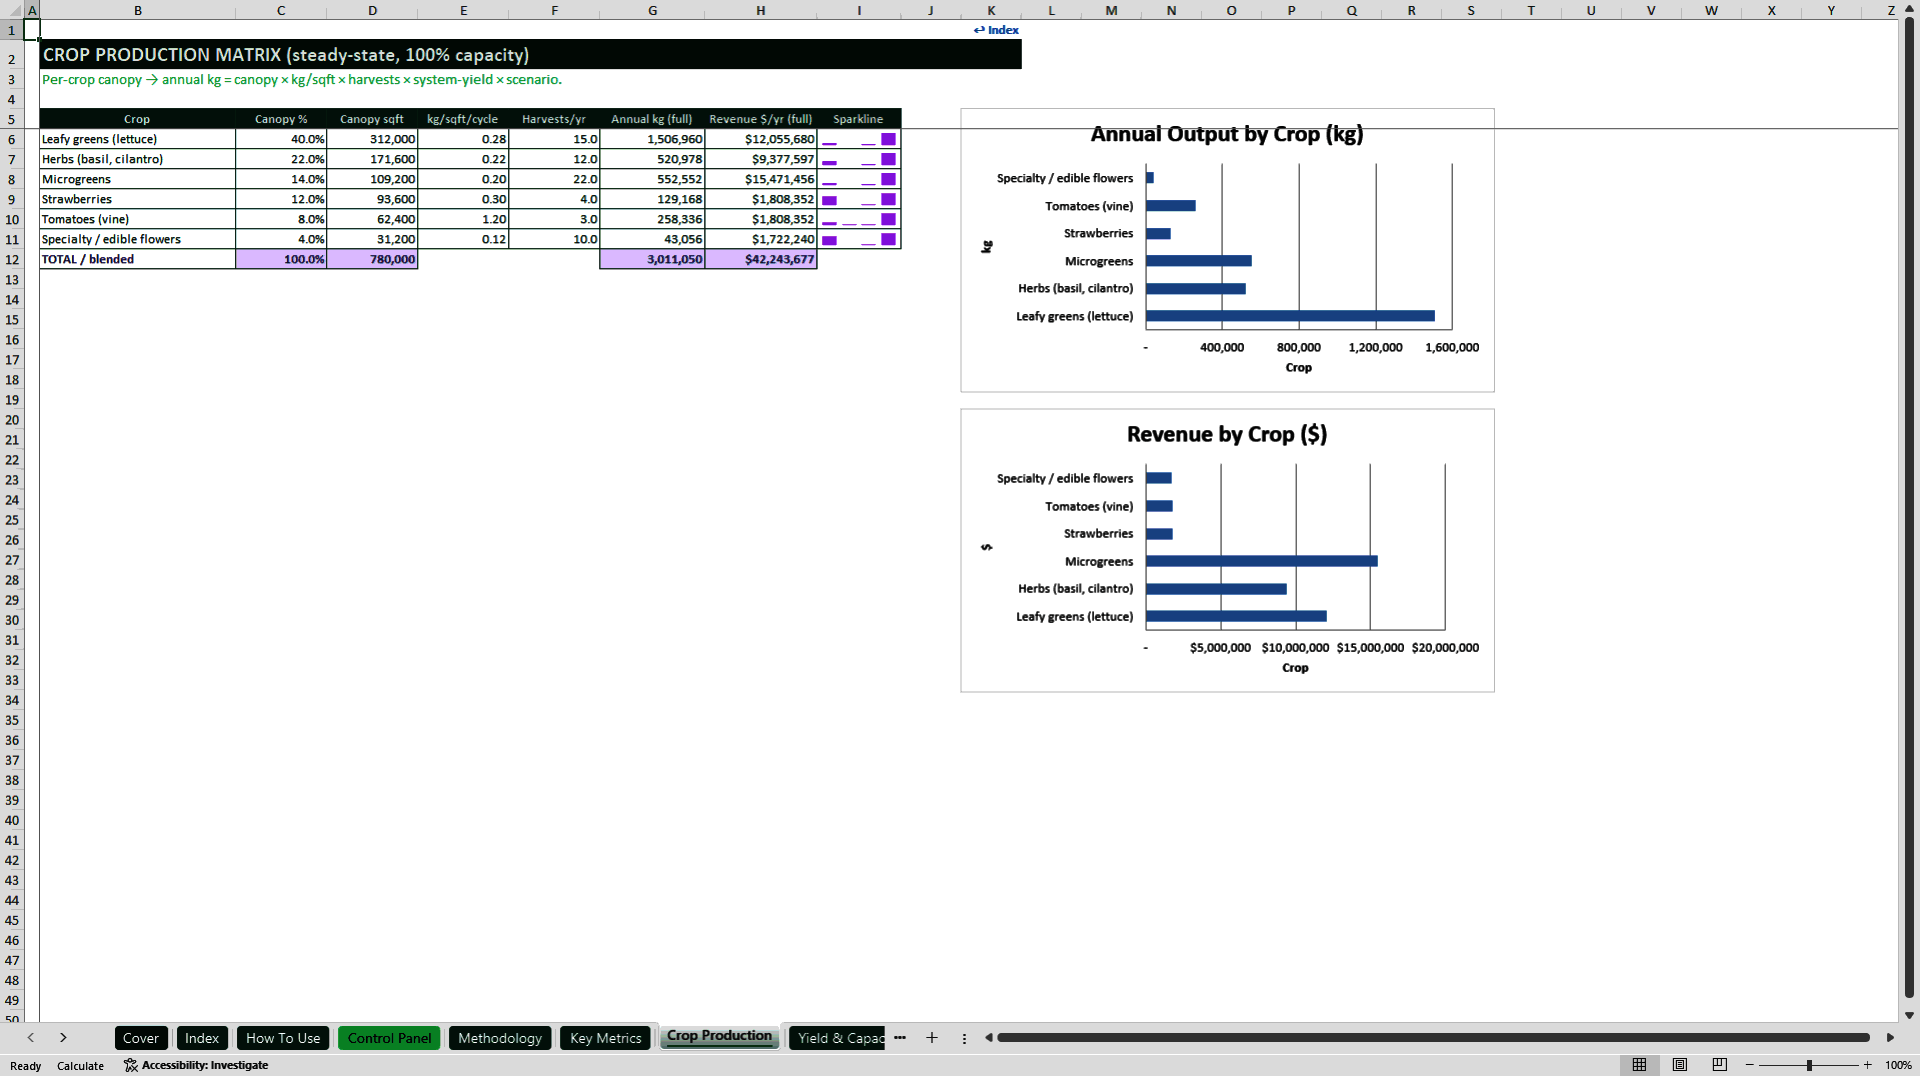
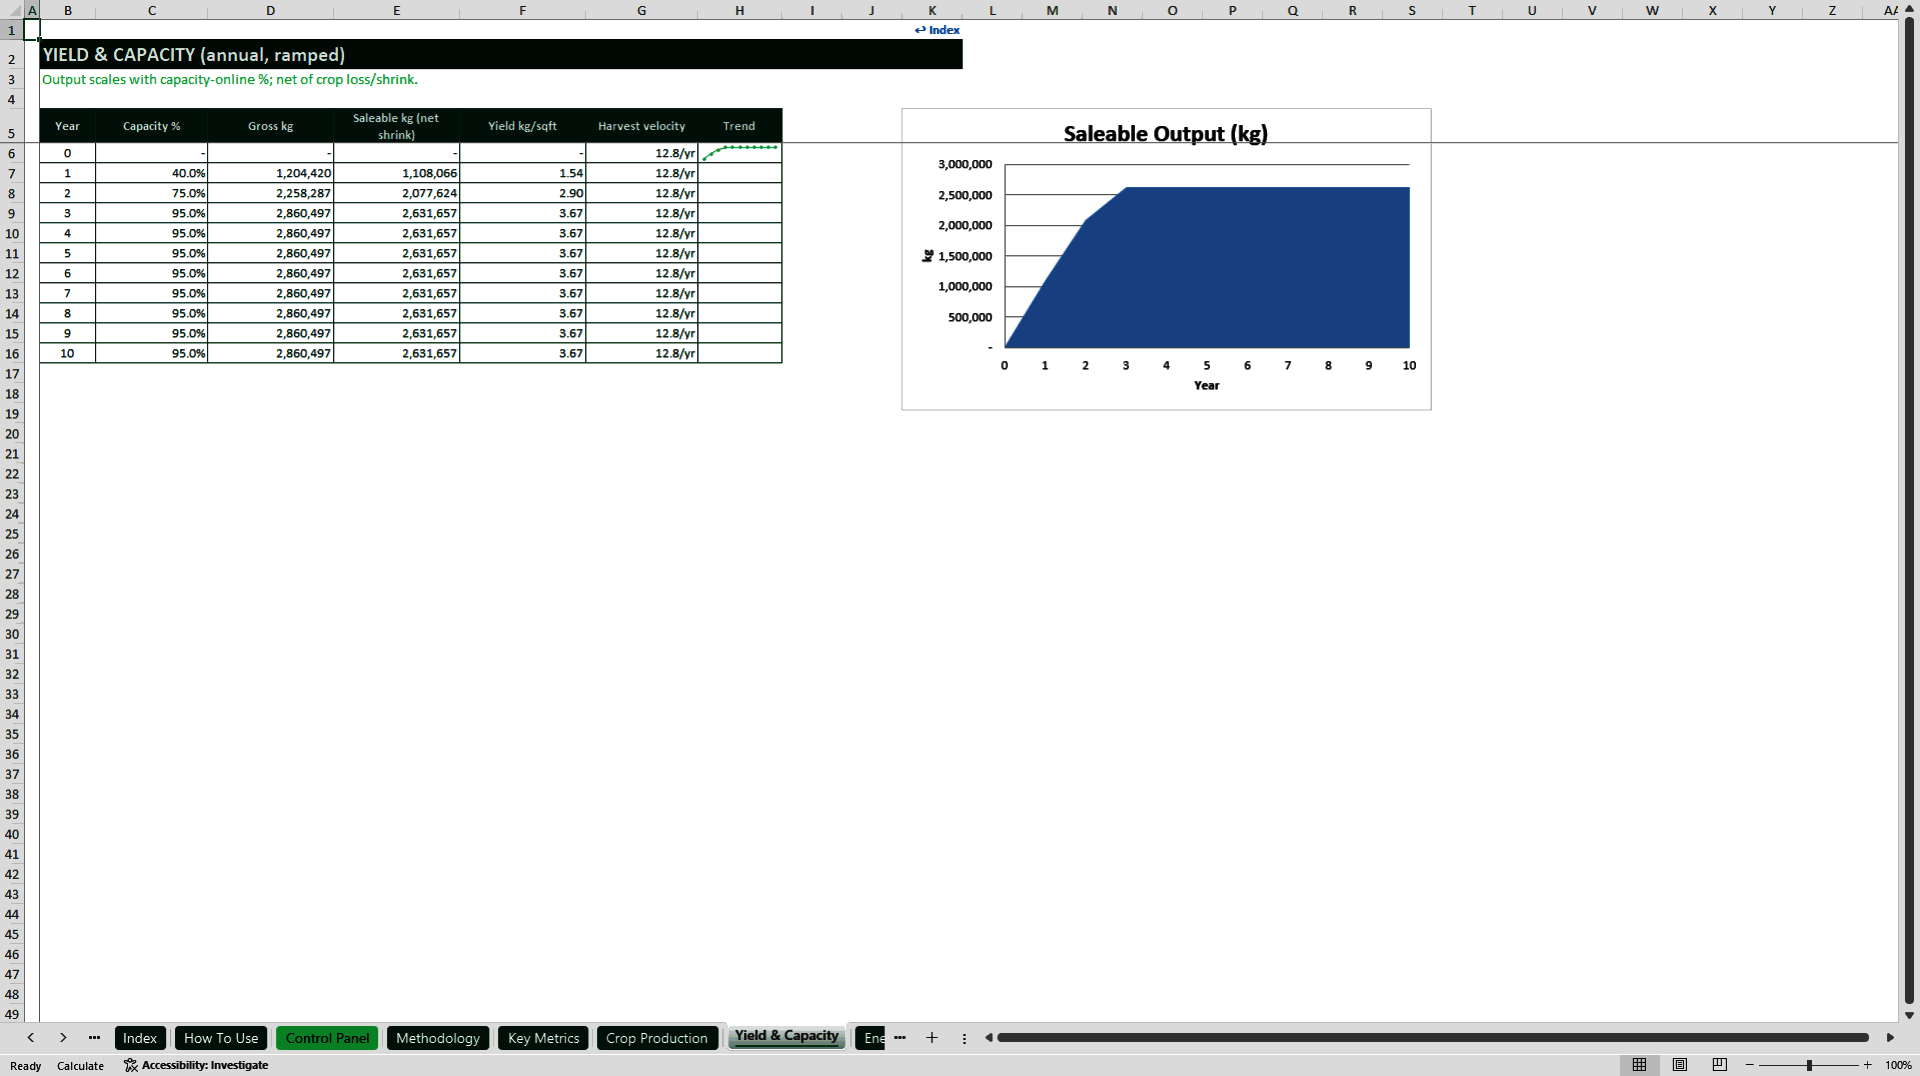
- Converts vertical-farm design, crop, operating, and commercial assumptions into linked 10-year production, financial, cash-flow, and valuation outputs.
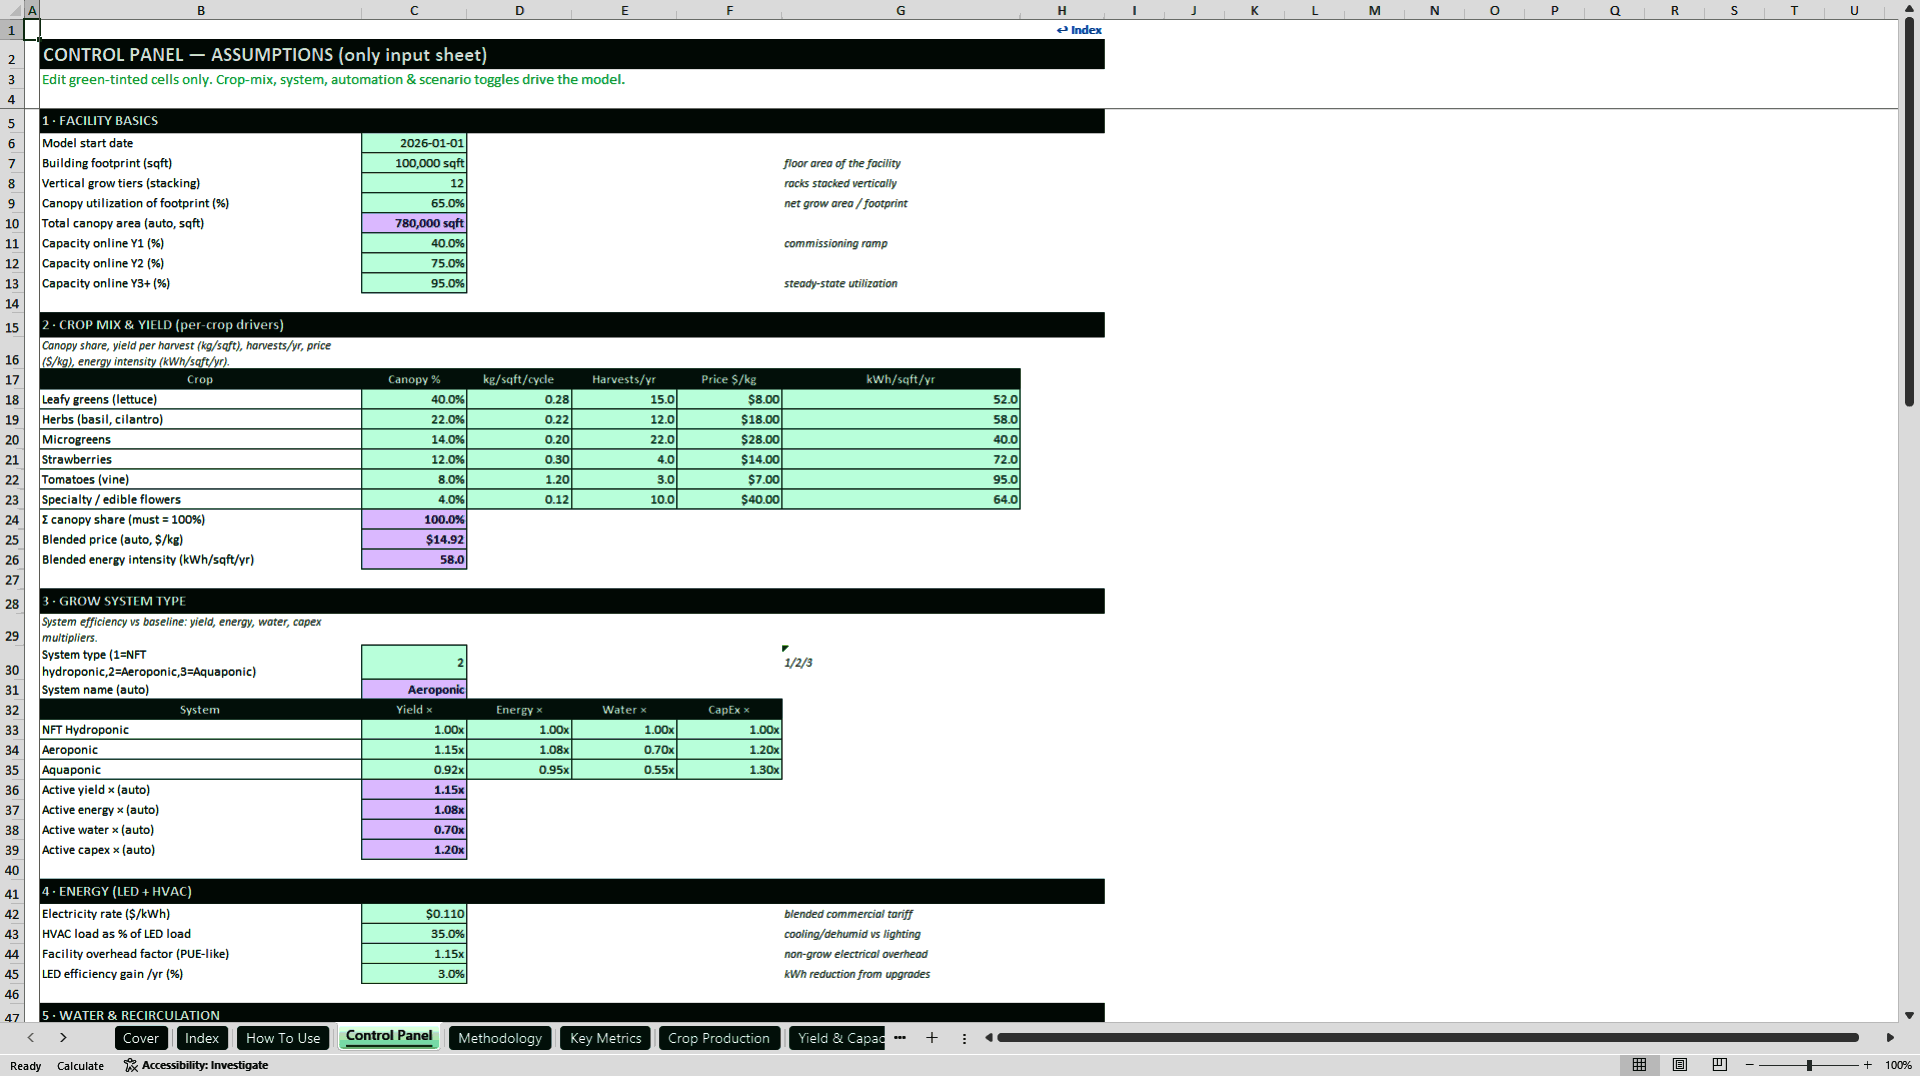
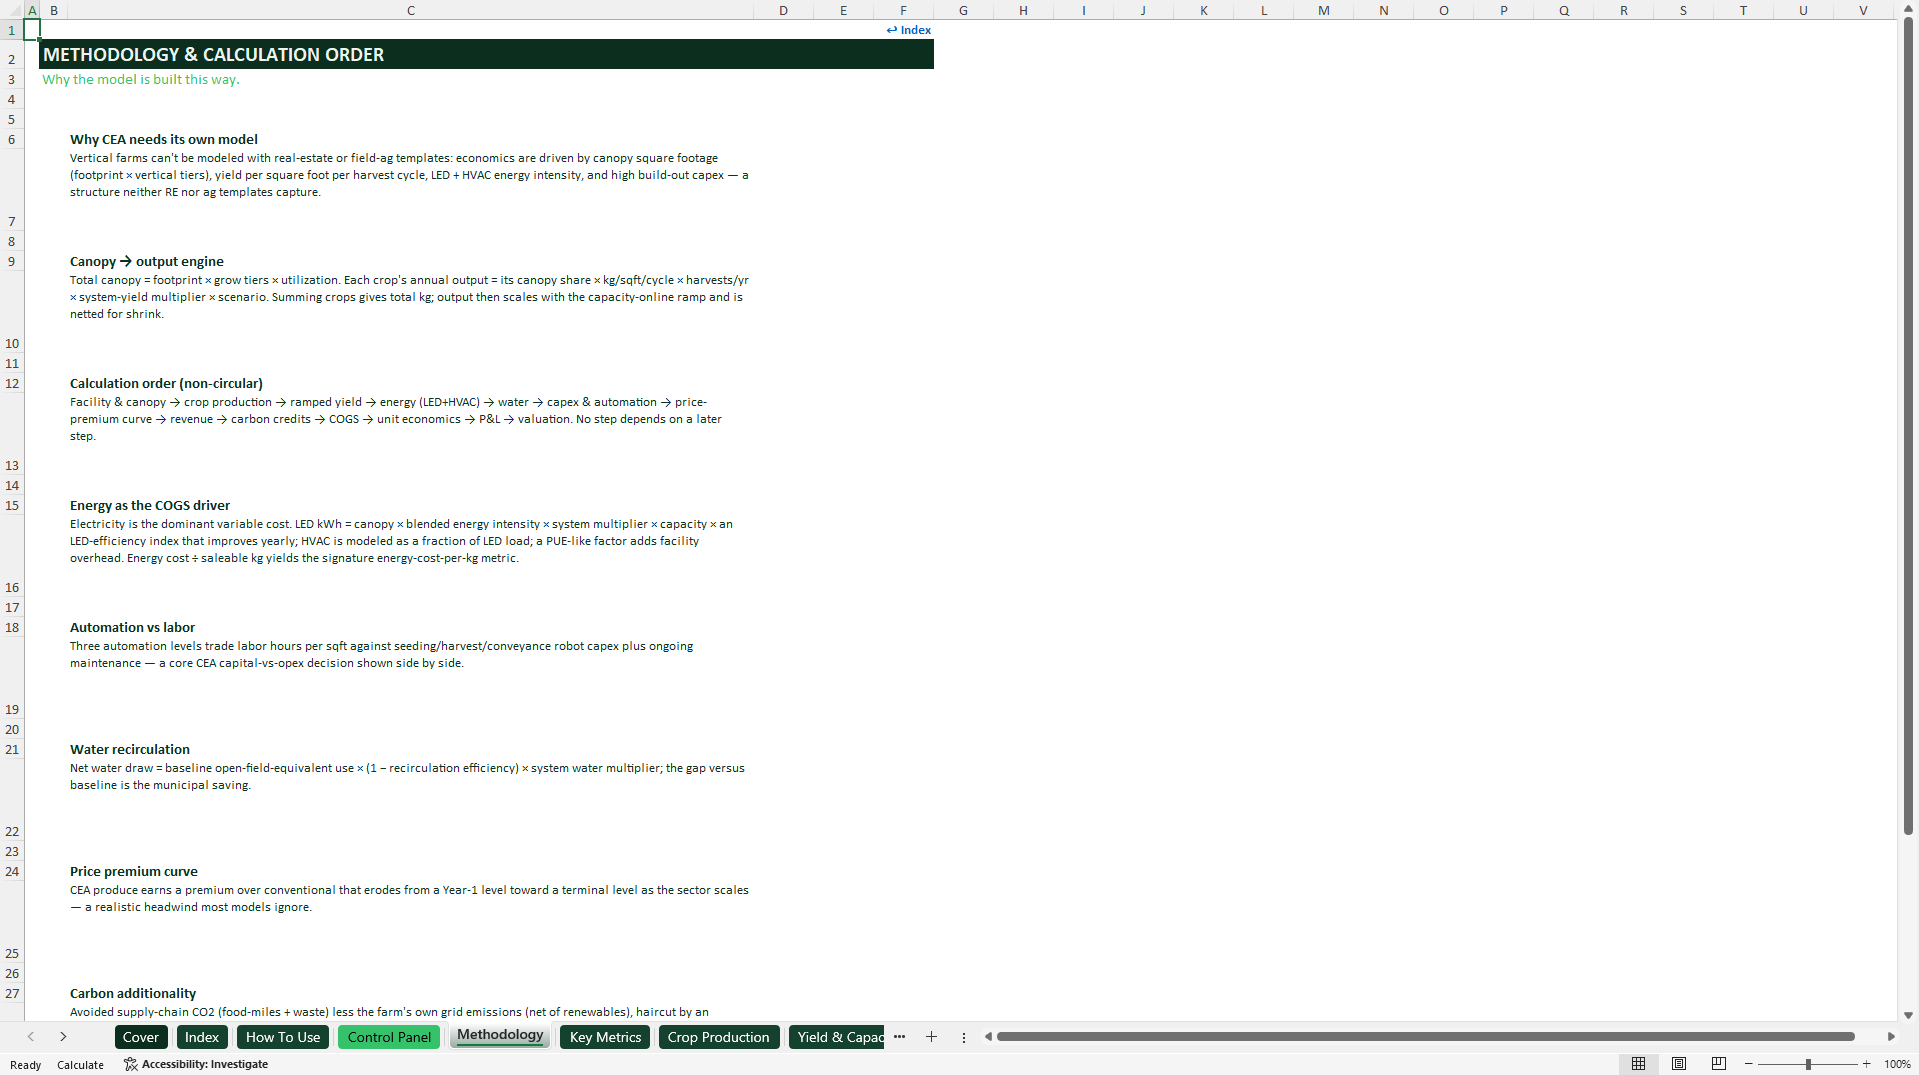
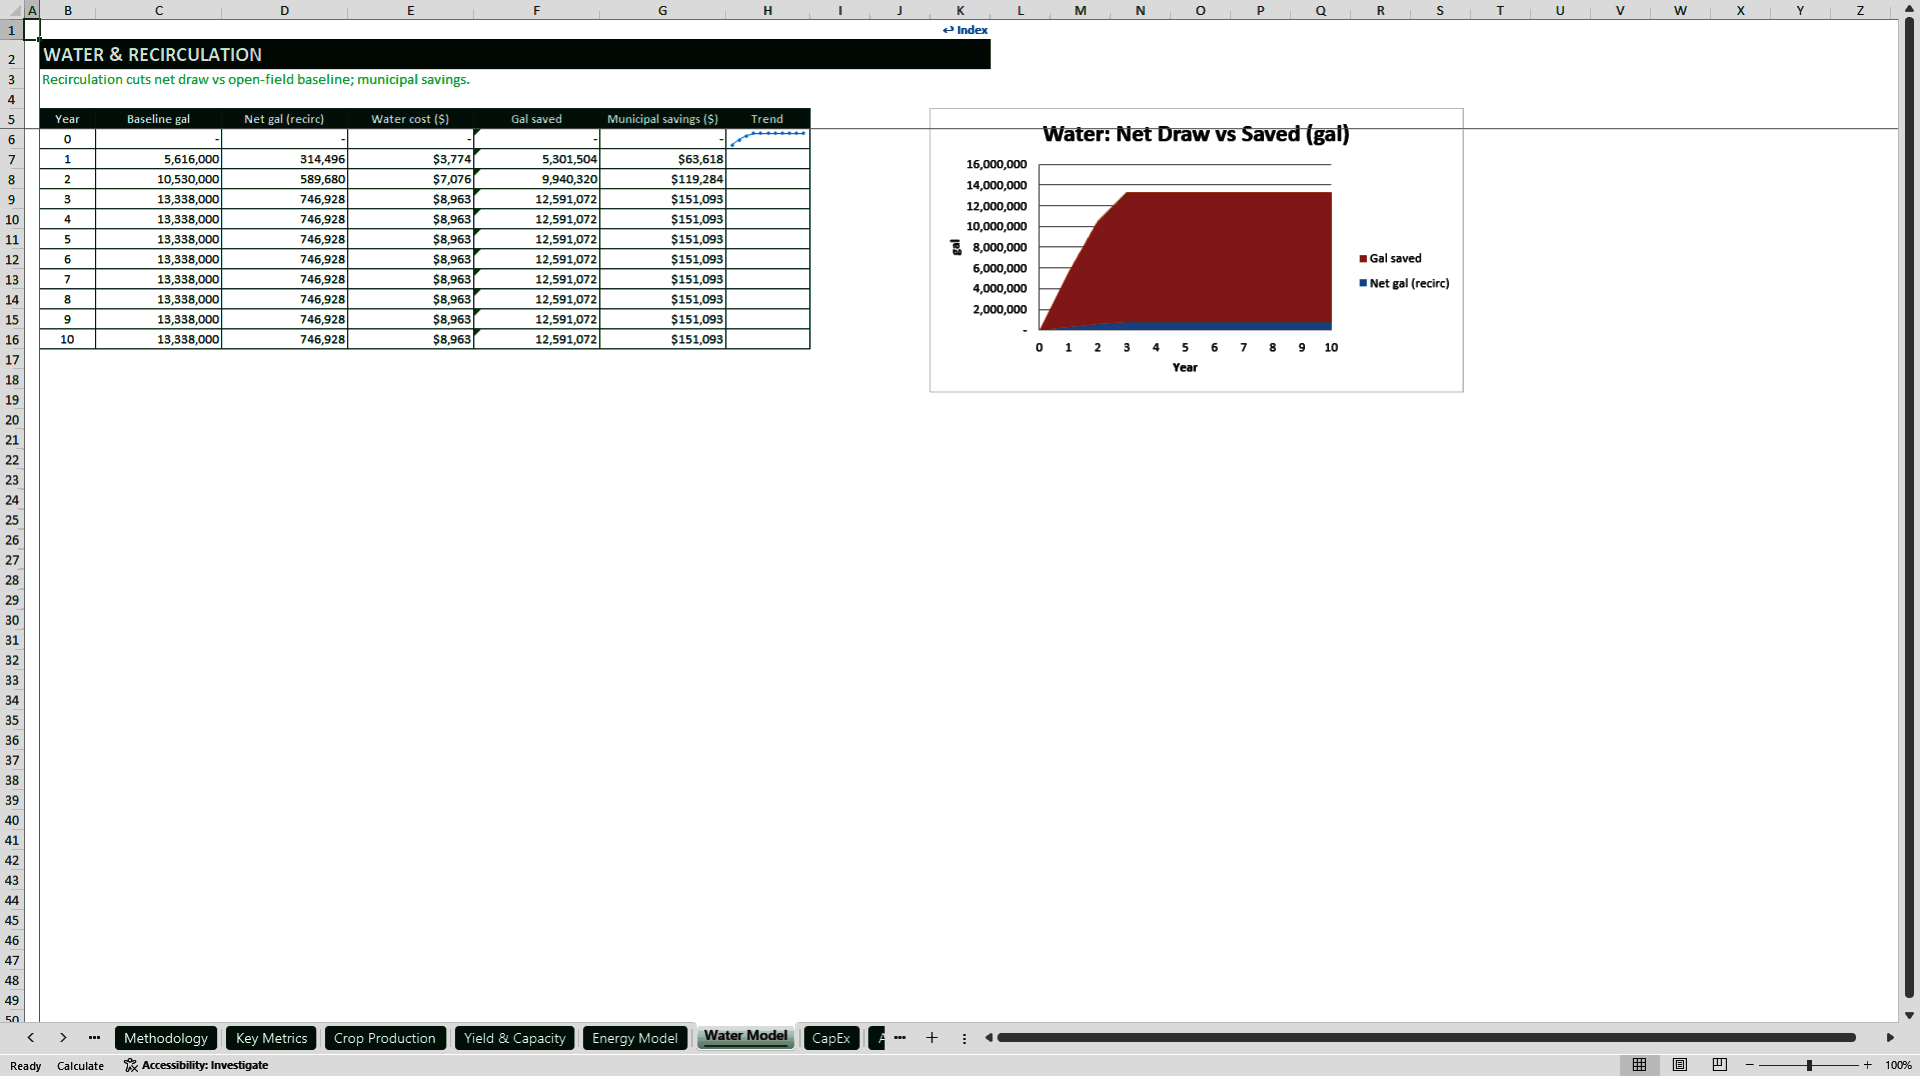
- Quantifies the decisions that drive controlled-environment agriculture economics, including grow-system choice, automation, energy intensity, water recirculation, crop mix, yield, price premium, and carbon additionality.
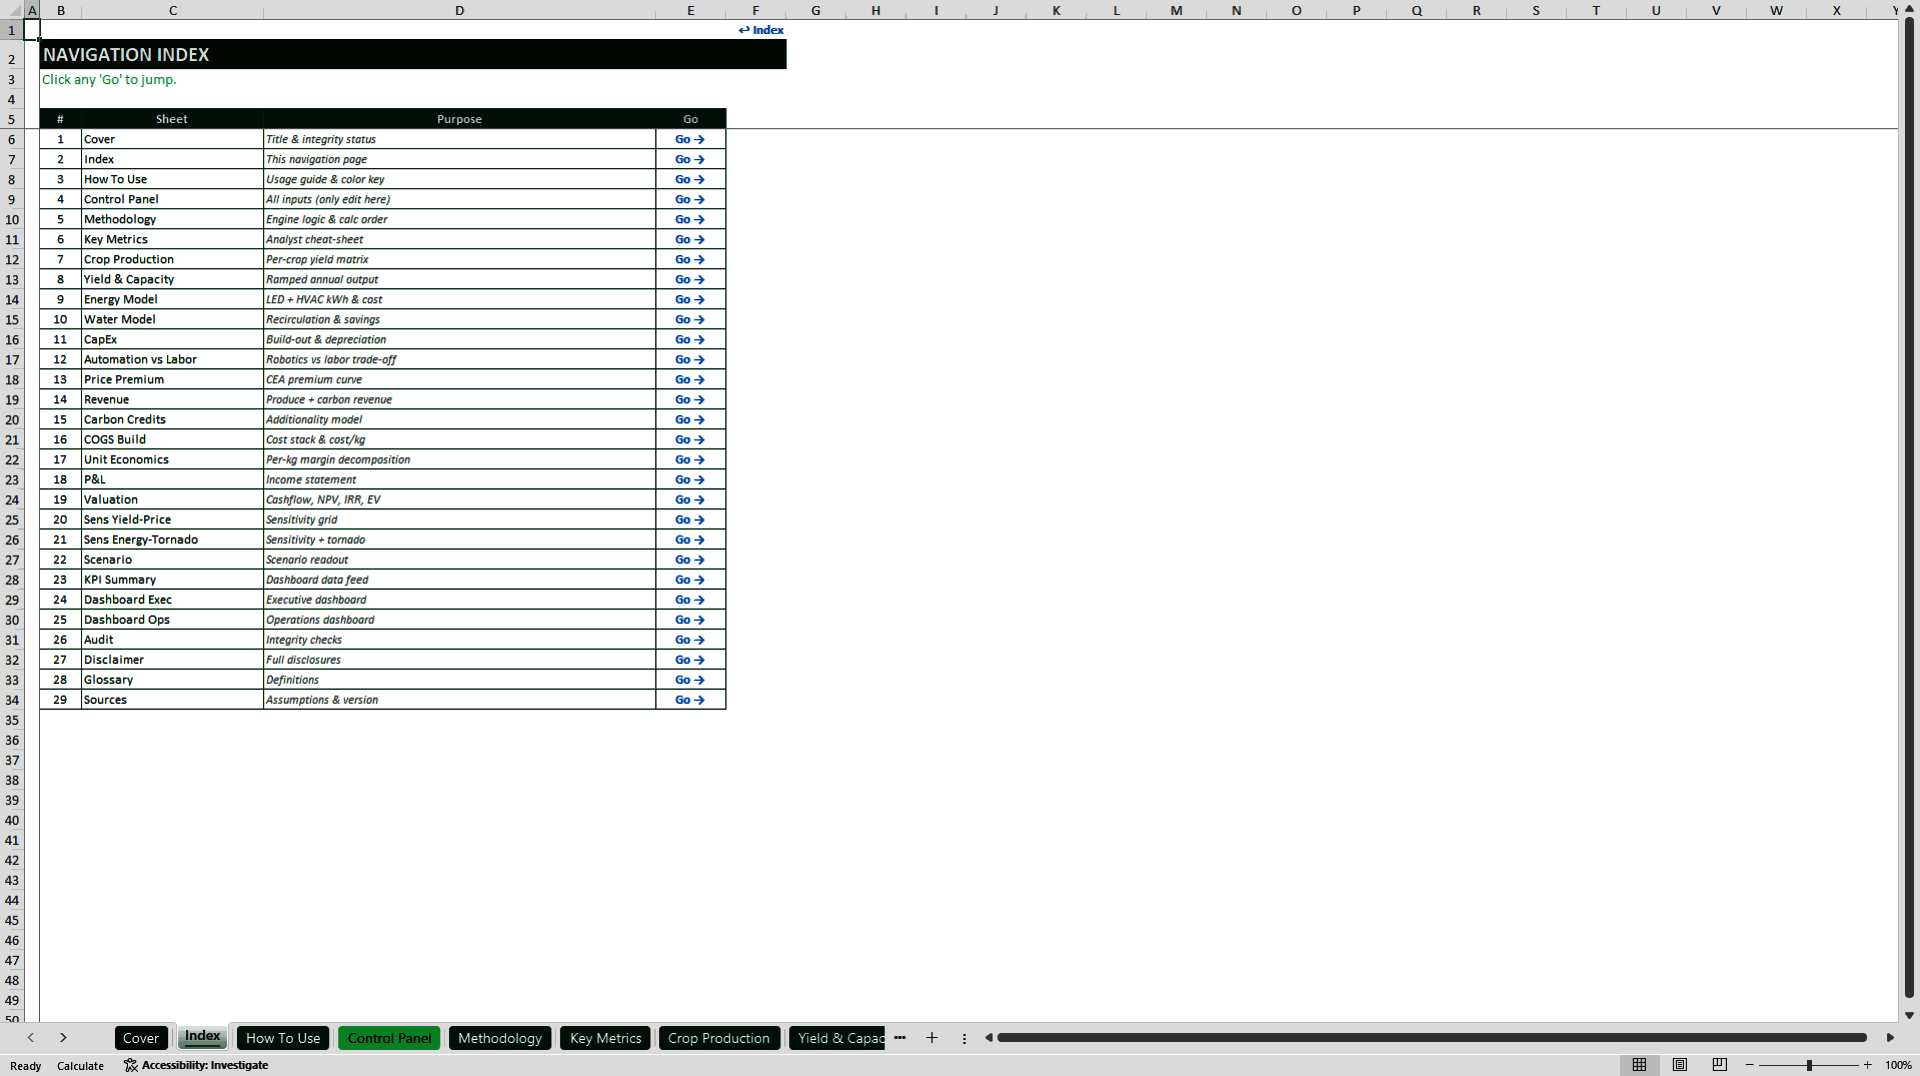
- Accelerates feasibility reviews and investment discussions with executive and operating dashboards, scenarios, sensitivities, unit economics, and formula-driven integrity checks.
AGRICULTURE INDUSTRY EXCEL DESCRIPTION
🧠 PSYCHEDELIC MEDICINE PIPELINE & VALUATION
The Psychedelic Medicine rNPV and Commercial Model is a 32-sheet financial-planning workbook for evaluating an emerging psychedelic-therapeutics company over a 12-year annual horizon. It connects clinical pipeline risk, launch timing, development cost, therapy-session economics, patient adoption, clinic rollout, reimbursement, scheduling uncertainty, intellectual property, competition, P&L, cash flow, funding, and valuation in one formula-driven framework.
The workbook combines program-level risk-adjusted net present value with a consolidated commercial discounted cash flow. Users can compare each program's contribution, calculate a probability-weighted portfolio value, forecast the commercial organization, and triangulate both approaches into a blended valuation.
🎛️ CENTRALIZED INPUTS
All editable assumptions are located on one Control Panel and grouped into 11 operating and financial sections. Users can replace the illustrative pipeline, phases, probabilities, breakthrough status, peak sales, launch timing, scheduling, treatment-course inputs, patient assumptions, clinic network, training, reimbursement, exclusivity, competition, costs, WACC, tax, and exit multiple.
• Violet-tinted cells identify editable inputs.
• Bear, Base, and Bull cases flex probability of success, peak sales, penetration, pricing, and reimbursement together.
• Pharma-led, Balanced, and Retreat-pressured modes adjust competitive share and price realization.
• Validation flags test important input boundaries before results are used.
🧪 FIVE-PROGRAM PIPELINE & PHASE PROBABILITY
The illustrative portfolio includes five compound-and-indication programs across psilocybin, MDMA, and a ketamine analog. Each row accepts a compound, development phase, breakthrough flag, peak-sales estimate, and years to launch.
Separate transition probabilities for Phase 1 to 2, Phase 2 to 3, Phase 3 to filing, and filing to approval calculate cumulative probability from the current phase to approval. Breakthrough assumptions can adjust cumulative probability and launch timing. The Pipeline Overview then presents launch year, cumulative probability, peak sales, risk-adjusted peak sales, and exclusivity end for every asset.
💎 PROGRAM-LEVEL rNPV ENGINE
The rNPV Engine shows annual cash flows for every program from Y0 through Y12. It calculates the launch indicator, commercial ramp, post-exclusivity retention, success-case revenue, probability-adjusted revenue, development cost, net risk-adjusted cash flow, discounted cash flow, and individual program rNPV.
• Analyze value by program rather than relying on one portfolio total.
• See how phase, probability, time to market, peak sales, exclusivity, cost, scheduling, and WACC affect value.
• Replace the sample programs while preserving the linked valuation architecture.
⚖️ SCHEDULING & COMMERCIAL ACCESS RISK
The scheduling module allows the user to enter the current and assumed post-approval scheduling status, probability of a favorable reclassification, possible delay, and controlled-substance handling burden. The workbook calculates commercial cash-flow weighting and the portfolio value exposed to an unfavorable outcome. These inputs are illustrative and should be replaced with jurisdiction- and product-specific regulatory analysis.
🩺 THERAPY-SESSION ECONOMICS
Psychedelic-assisted therapy is modeled as a care-delivery process, not merely a drug sale. Course economics include dosing sessions, session length, preparation and integration hours, therapists required during dosing, therapist cost, drug/formulation cost, controlled-substance handling, facility fees, and course price.
The schedule calculates total therapy hours, billable therapist-hours, therapist cost, delivered cost, gross profit per course, and course-level gross margin. This provides a transparent bridge from the treatment protocol to commercial profitability.
👥 PATIENT ACCESS, CLINICS & TRAINING
The Patient Funnel grows the eligible population, ramps penetration, includes re-treatment, and estimates annual course demand. The Clinic Network models clinics added, operating clinics, therapists, throughput, and utilization. Licensing and therapist-training investment is capitalized as the network expands and amortized over a user-defined life.
These modules connect patient demand, workforce requirements, care-delivery infrastructure, capital investment, and operating capacity to the financial forecast.
💳 REIMBURSEMENT & PRICING
The reimbursement module models a transition from predominantly cash-pay treatment toward a higher reimbursed share. Users can change coverage at launch, terminal reimbursed share, adoption period, and payer haircut. The model calculates payer-net price, cash-pay price, blended realized price, and realized price versus list.
📉 PATENT CLIFF & COMPETITION
The IP module includes an effective exclusivity period, annual post-cliff erosion, retention floor, and IP-strength factor. These assumptions create a revenue-retention curve that feeds program value.
The competitive selector compares Pharma-led, Balanced, and Retreat-pressured environments. Each mode changes the pharmaceutical channel's share of treated patients and price realization, allowing users to test approved/reimbursed premium treatment against alternative cash-pay delivery models.
📈 COMMERCIAL FORECAST, P&L & CASH FLOW
The Revenue Build combines treated courses, blended realized price, and competitive share. COGS is separated into therapist, drug, controlled-substance handling, and facility costs.
The linked P&L forecasts net revenue, COGS, gross profit, SG&A, ongoing R&D, amortization, EBIT, tax, and net income. The Cash Flow schedule calculates free cash flow after tax and capitalized licensing/training investment, tracks cumulative cash flow, and identifies peak funding need.
💰 VALUATION & RETURN ANALYSIS
The Valuation Summary compares probability-weighted pipeline rNPV with a consolidated commercial DCF. The DCF combines operating NPV with the discounted value of an exit based on risk-adjusted peak sales and a configurable multiple.
Outputs include pipeline rNPV, commercial enterprise value, blended valuation, risk-adjusted peak sales, implied EV/peak-sales multiple, peak funding need, and commercial project IRR.
🌡️ SCENARIOS, SENSITIVITIES & TORNADO
The workbook includes integrated Bear, Base, and Bull cases; a probability-of-success versus peak-sales valuation grid; a scheduling-probability versus reimbursement grid; and a tornado view covering probability, peak sales, scheduling, reimbursement, penetration, patent erosion, competitive share, and WACC.
These tools identify the assumptions that create the greatest change in value and help structure downside, base, and upside discussions.
📊 DASHBOARDS & CONTROLS
The Executive Dashboard presents the headline pipeline value, commercial valuation, blended valuation, project IRR, funding need, revenue, EBIT, and cumulative free cash flow. The Clinical & Operations Dashboard focuses on phase probability, patient demand, treated courses, clinic rollout, and reimbursement.
A KPI Summary consolidates the key results. The Audit sheet performs 22 automated checks covering rNPV aggregation, valuation links, COGS, gross profit, EBIT, revenue, demand and capacity, DCF construction, capitalized investment, retention, reimbursement, cash flow, funding, probabilities, peak sales, IRR, scheduling cost, gross margin, competition, and scenario validity.
⚙️ RECOMMENDED WORKFLOW
1. Replace the illustrative inputs on the Control Panel with company- and program-specific assumptions.
2. Select a Bear, Base, or Bull scenario and a competitive mode, or create a custom case.
3. Review the Pipeline Overview and rNPV Engine to understand asset-level value.
4. Review therapy economics, patients, clinics, reimbursement, IP, competition, P&L, cash flow, and valuation.
5. Use the dashboards, KPI Summary, sensitivities, and tornado analysis for presentation and decision support.
6. Confirm that all Control Panel validation flags and Audit checks remain clear.
The buyer receives one fully editable, macro-free Microsoft Excel workbook containing 32 organized sheets, 22 embedded charts, two dashboards, centralized assumptions, scenario controls, a five-program pipeline, program-level rNPV, commercial forecasting, valuation triangulation, sensitivities, instructions, methodology, glossary, risk disclosures, and 22 automated checks. The workbook is self-contained and has no external file links.
Got a question about the product? Email us at support@flevy.com or ask the author directly by using the "Ask the Author a Question" form. If you cannot view the preview above this document description, go here to view the large preview instead.
Source: Best Practices in Agriculture Industry, Integrated Financial Model Excel: Vertical Farming Financial and Valuation Model Excel (XLSX) Spreadsheet, PDMM Financial Models
ABOUT THE AUTHOR

PDMM Financial Models develops professional, decision-ready Excel models for business owners, entrepreneurs, investors, consultants, analysts, and finance teams. Our objective is to transform complex business assumptions into clear, structured analysis that supports better planning and investment decisions.
Our models cover business planning, forecasting, budgeting, feasibility analysis,
... [read more]
Ask the Author a Question
You must be logged in to contact the author.




























