
 Click main image to view in full screen. Unlock all 9 preview images:
Urea Plant Financial Model | Natural Gas to Urea Excel – Excel XLSB
Excel (XLSB) + supplemental PDF


FINANCIAL MODELING EXCEL DESCRIPTION
A detailed, institutional-grade urea plant financial model for a natural gas-to-urea project, covering construction, operations and financing – with three integrated statements, a full cash waterfall and complete lender metrics, built in Excel.
A urea plant lives or dies on the spread between two volatile commodities – natural gas going in as feedstock and fuel, and urea coming out as the product sold into a global fertilizer market. Add a capital-intensive EPC build spanning reforming, air separation and ammonia synthesis before urea synthesis even begins, and you have an asset whose viability turns on getting that spread, and the debt structure layered on top of it, right. That is why this urea plant financial model is built to project-finance discipline, not stretched from a generic industrials template.
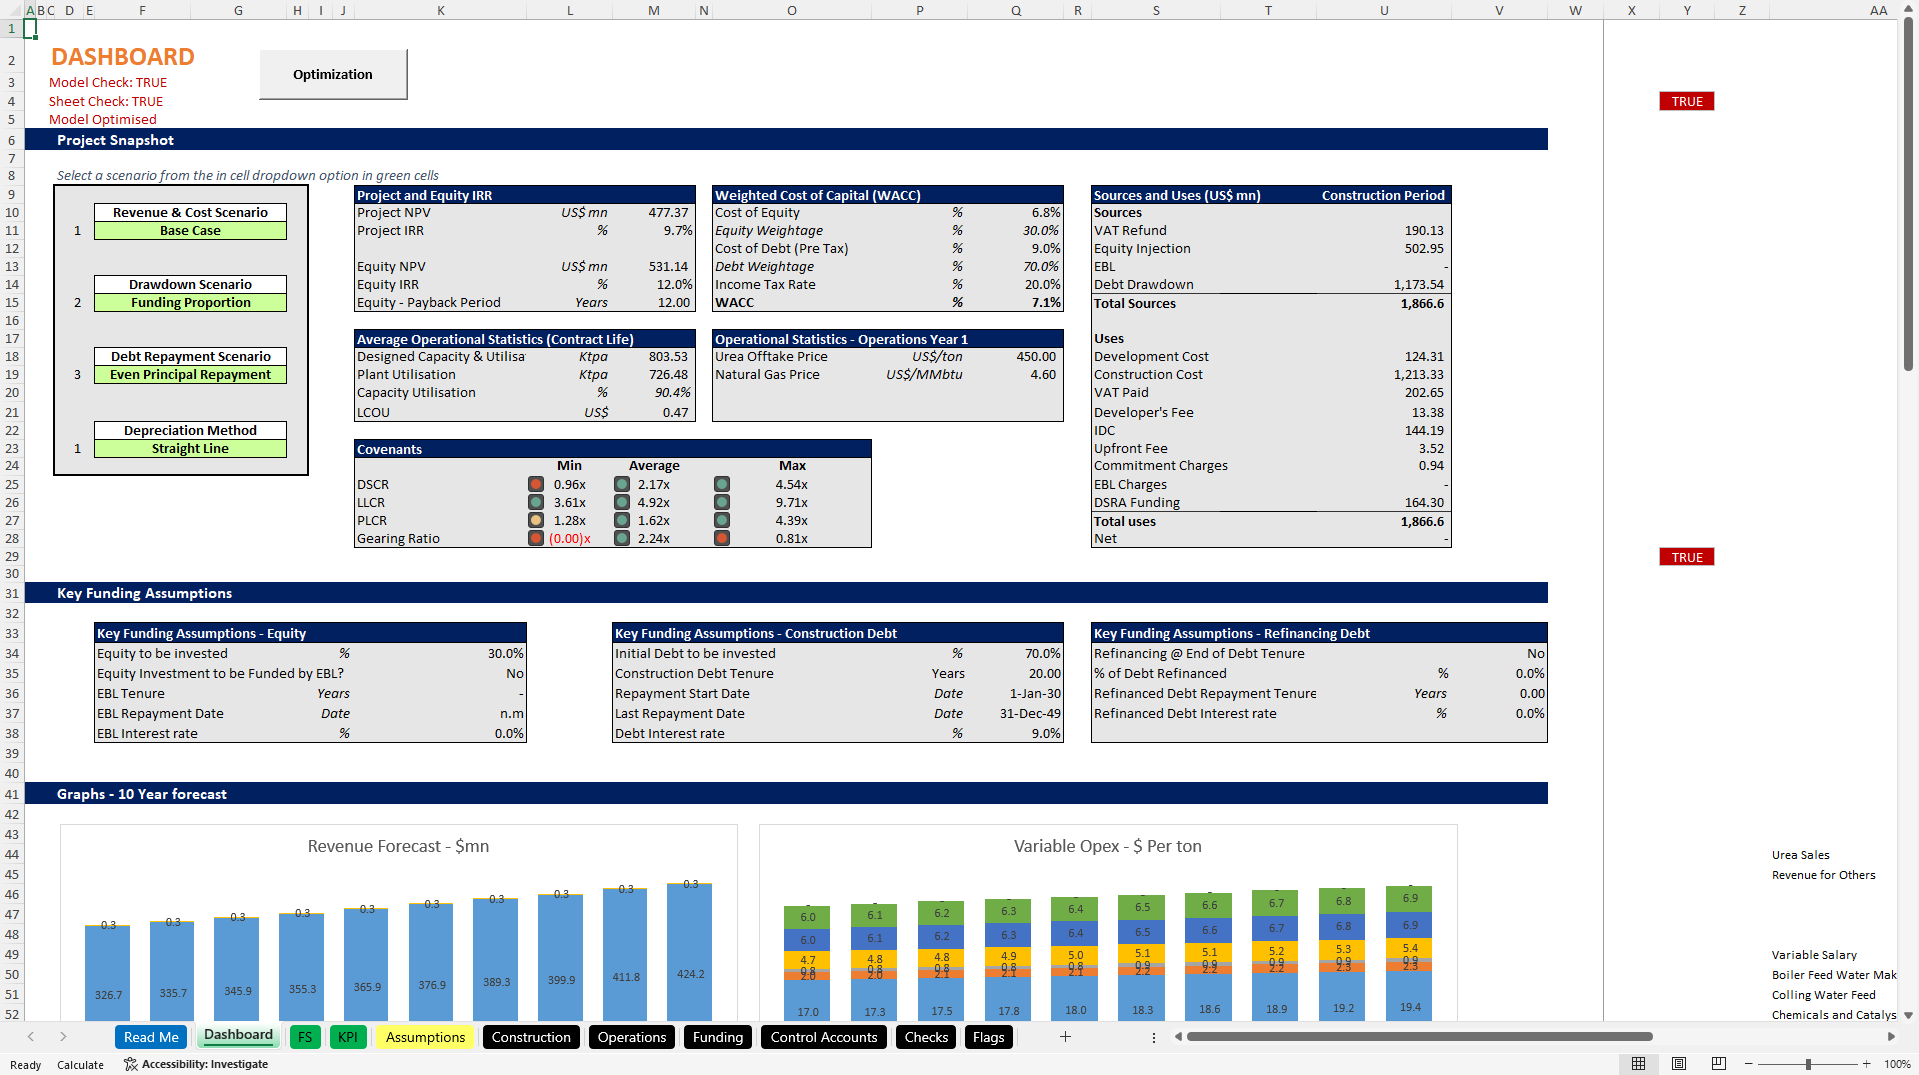
Because it follows the discipline of project finance, the model resolves every assumption into the complete suite of bankability outputs a developer, sponsor or lender needs – Project and Equity IRR and NPV, minimum and average DSCR, LLCR, PLCR, gearing ratio, a Levelized Cost of Urea (LCOU), and a full cash waterfall.
Two Commodities, Modelled Properly:
1. The economics of a urea plant are a spread, not a single price. Natural gas cost going in and urea price coming out each sit on their own scenario curve with independent indexation – natural gas carries a dedicated price curve separate from general inflation, since it rarely moves in line with CPI. That lets you stress the spread that actually drives the project, rather than just one side of it.
2. Between the two sits the natural gas efficiency factor – the gas consumed per tonne of urea produced – which converts the feedstock assumption into a cost per tonne of output. It is the single technical parameter that most directly determines whether the plant is competitive, and it is an explicit, editable input.
Two Phases, a Flexible Timeline and Three Scenarios:
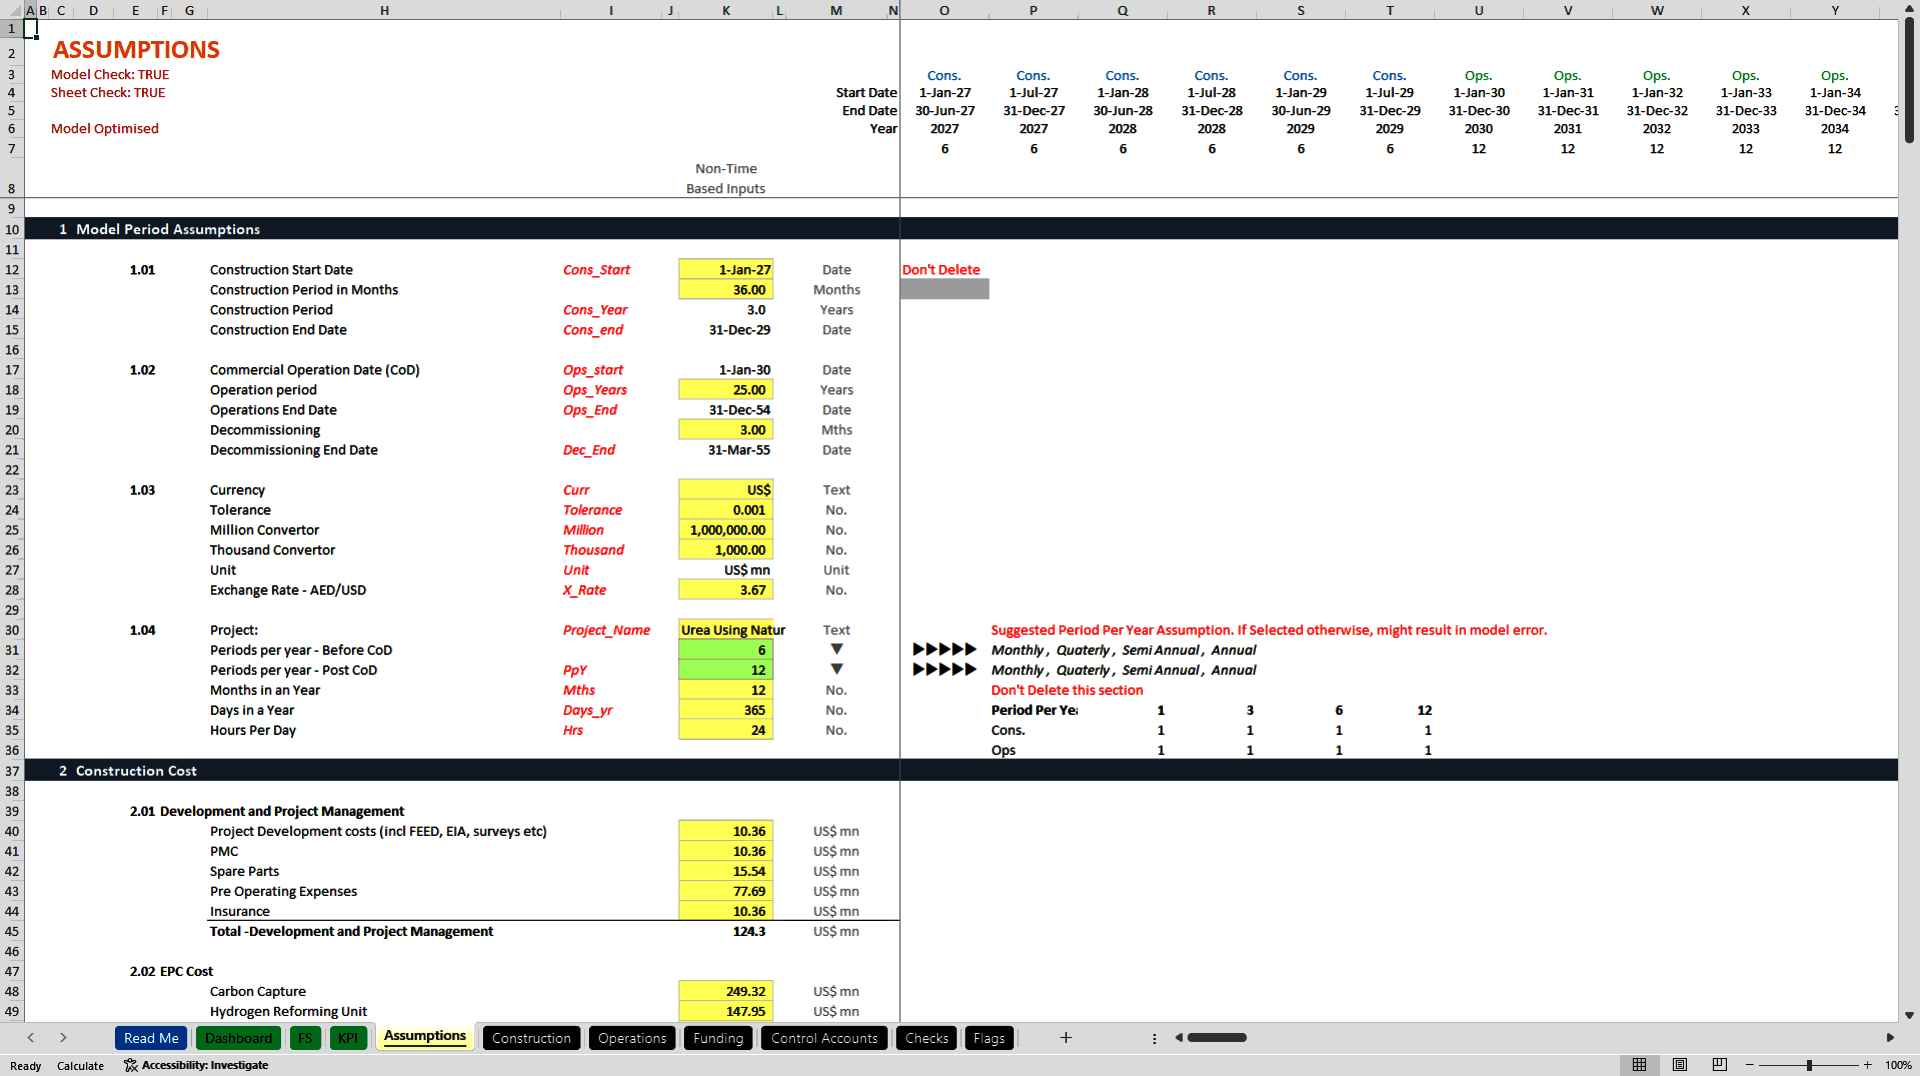
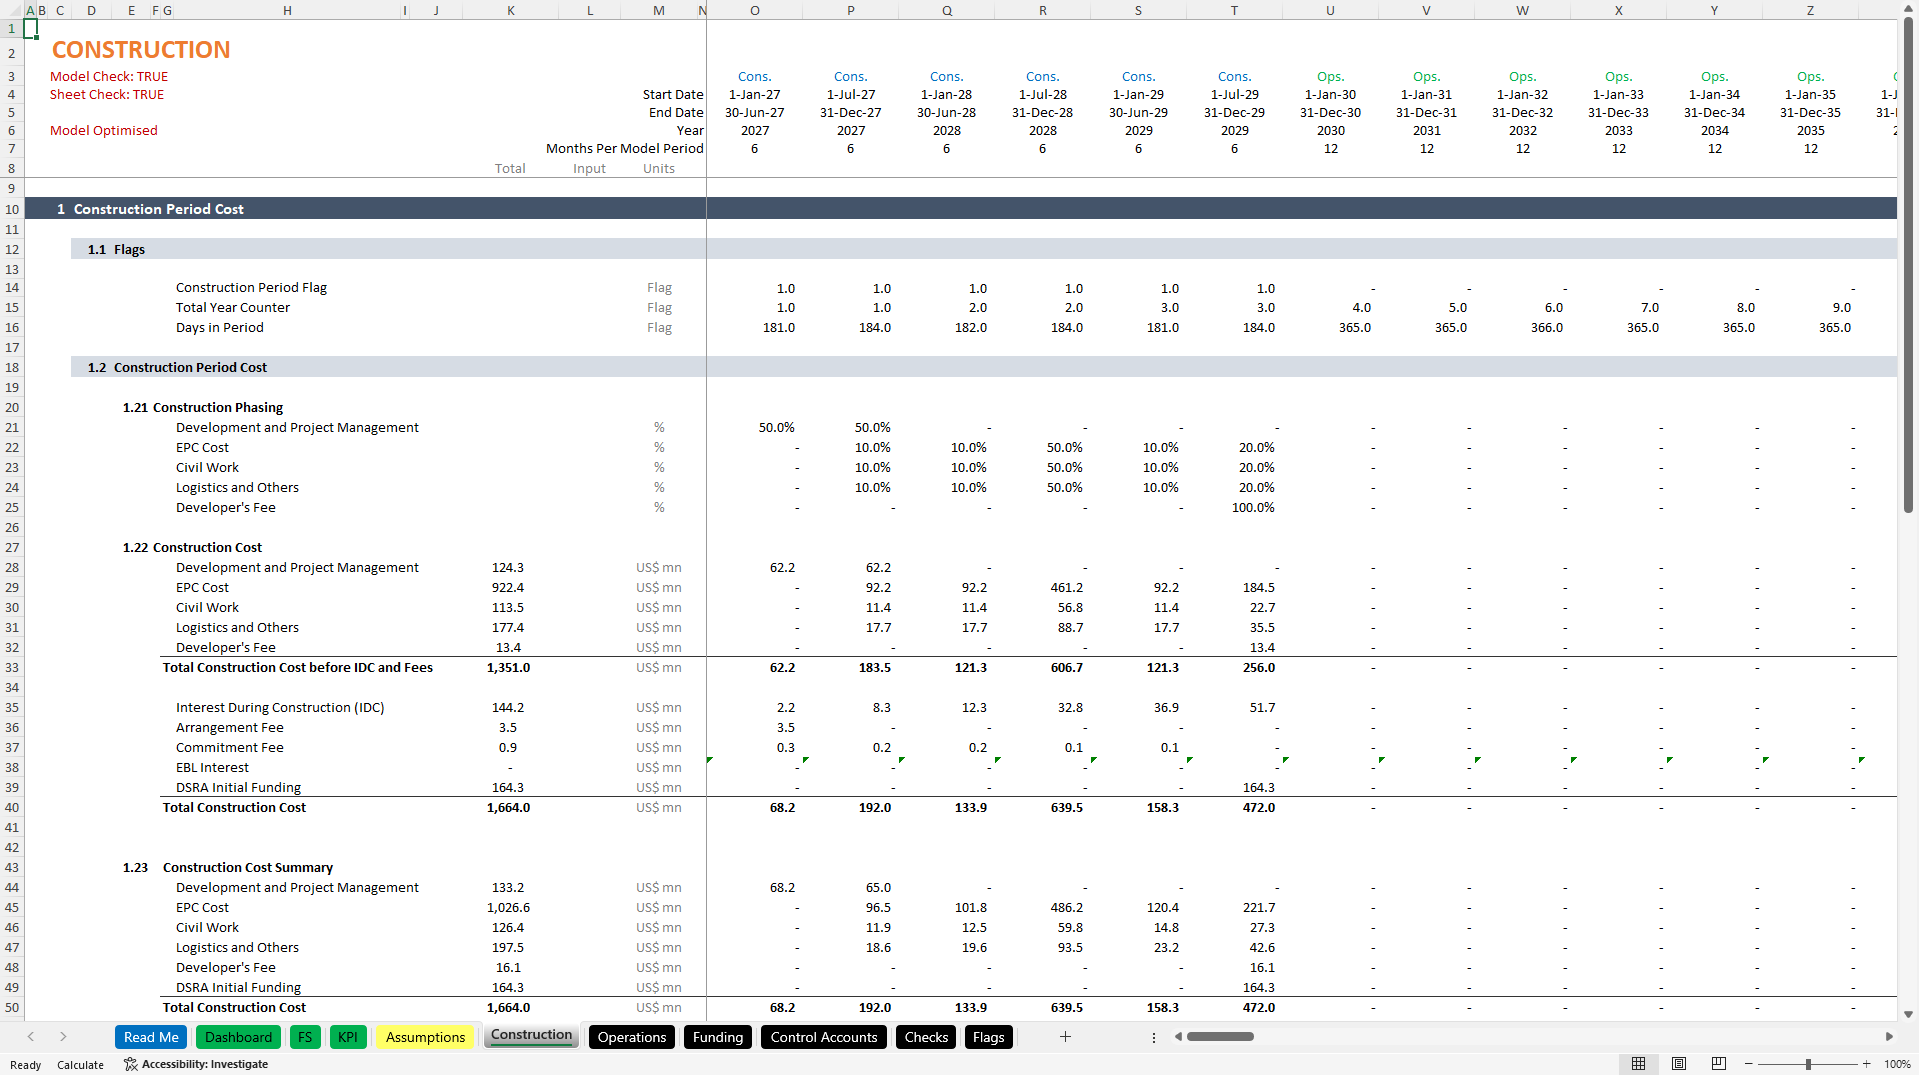
1. The model separates the construction and operations phases cleanly on a quarterly timeline, with an automated flag engine tracking construction progress, commercial operations date and an optional decommissioning period.
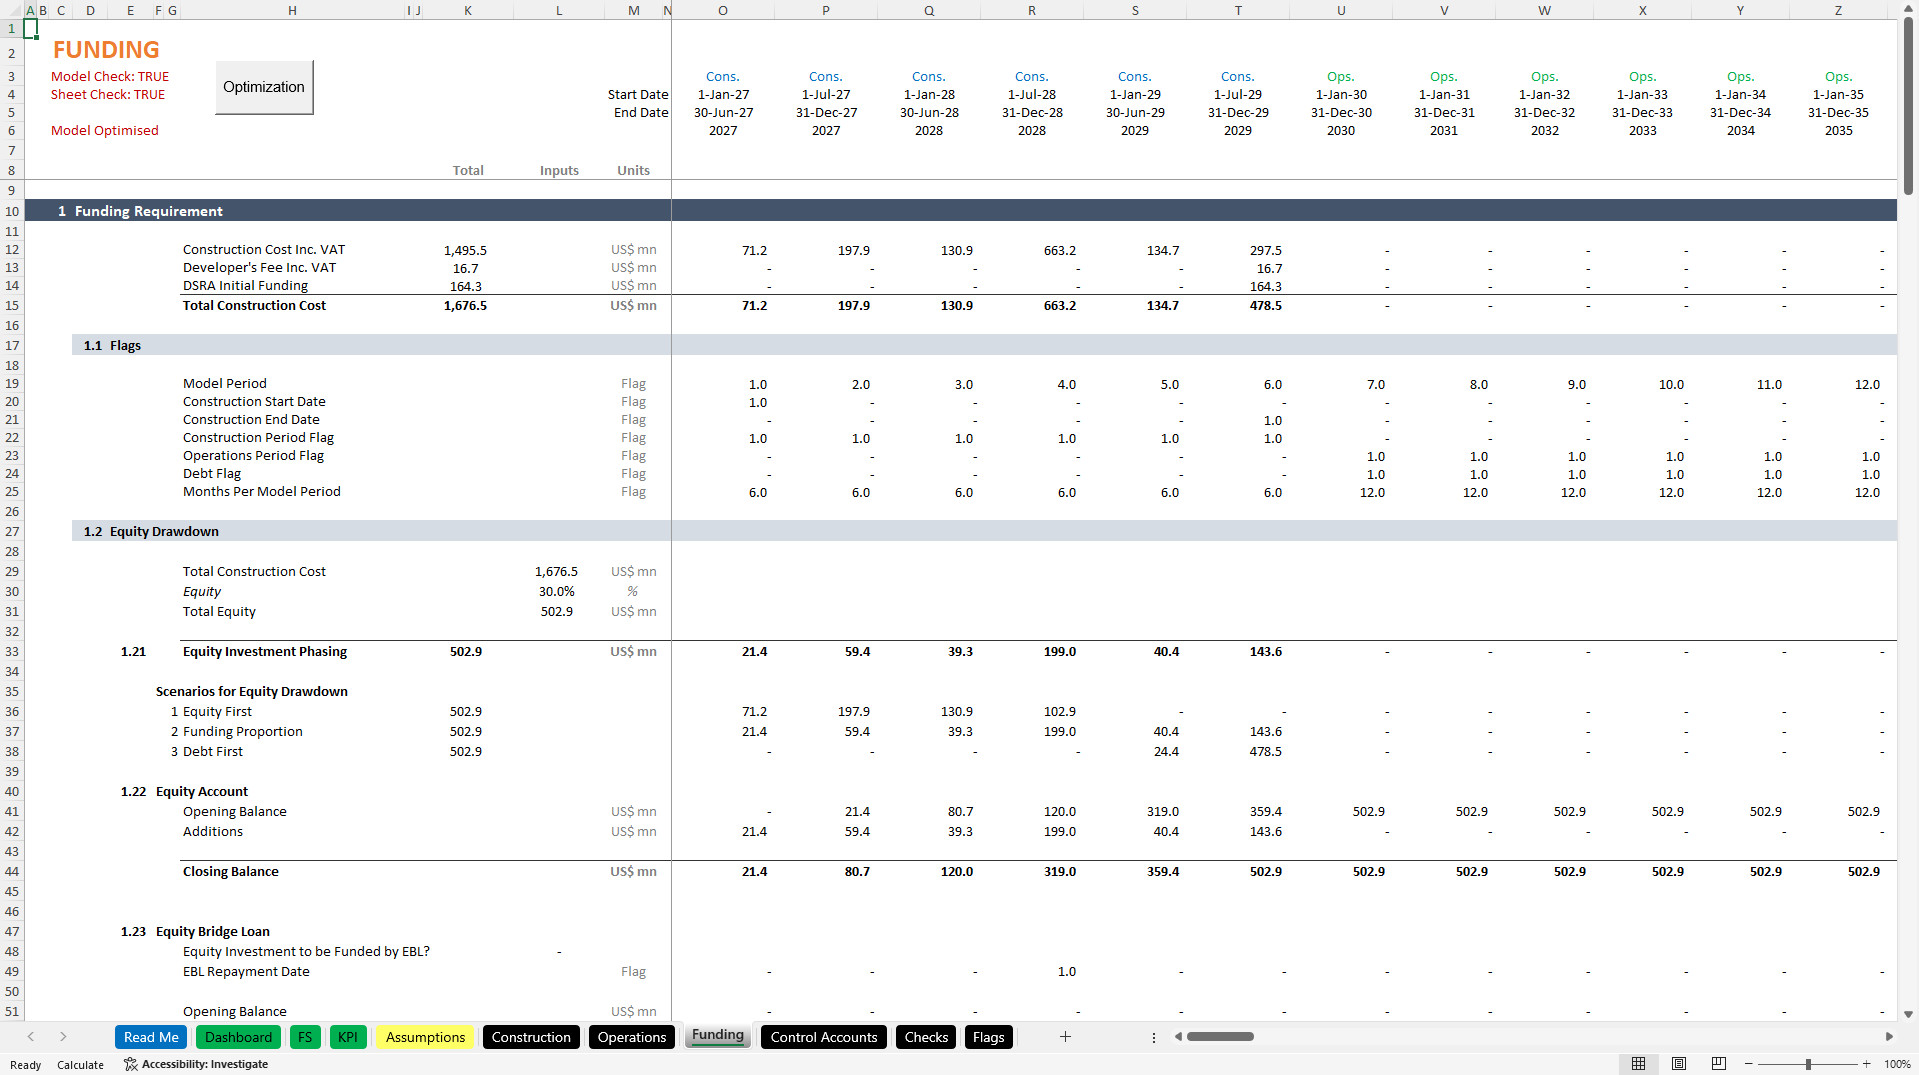
2. Every revenue and cost assumption can be entered across three scenarios – low, base case and upside – and switched instantly from a dropdown on the Dashboard, each carrying its own indexation curve. Debt drawdown carries its own phasing scenarios, and repayment can be profiled as annuity, sculpted to a target DSCR, or even-principal, each flowing through to IRR and coverage ratios instantly.
What's Inside the Urea Plant Financial Model:
Every driver of viability is an explicit, editable input, organized into eight categories:
1. Development & Construction Development costs (FEED, EIA, surveys), PMC, spare parts, pre-operating expenses, EPC cost across reforming, ASU, ammonia synthesis and carbon capture, civil works, contingency, license fee and developer's fee
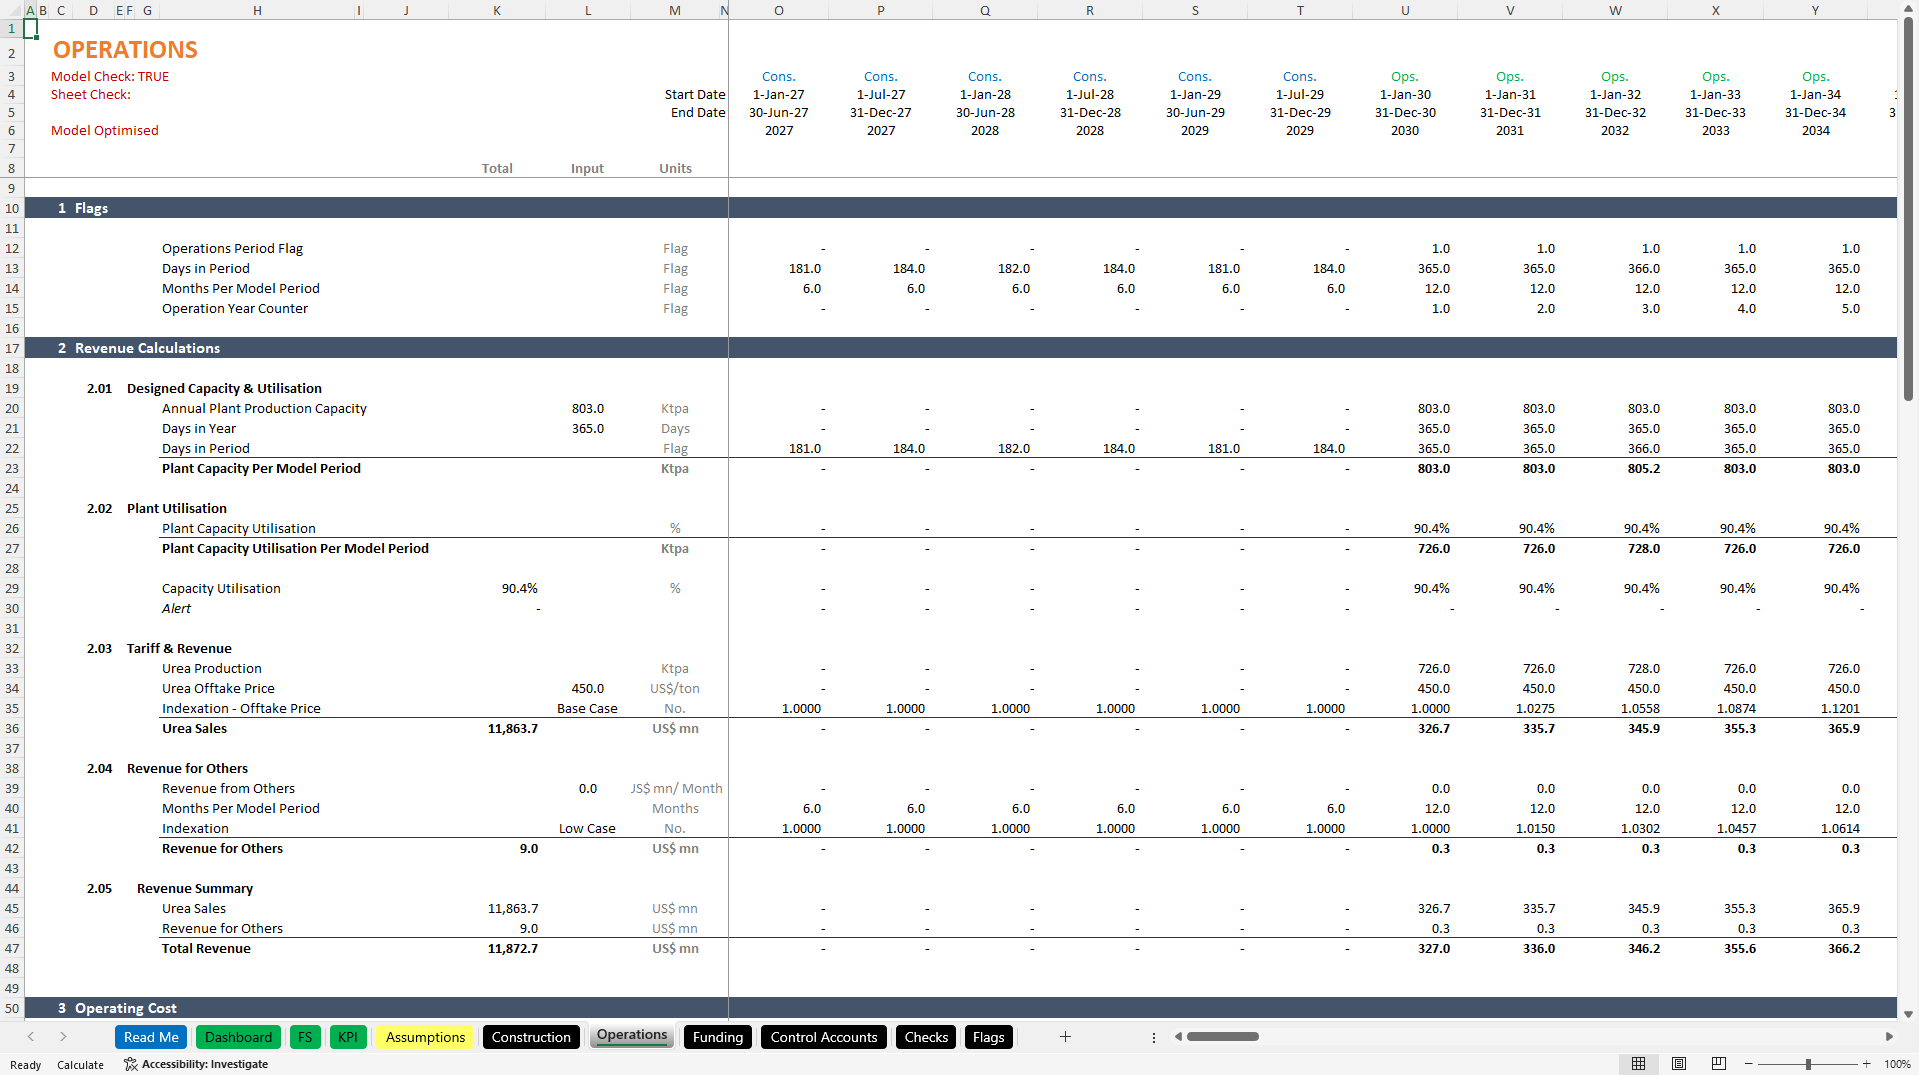
2. Plant & Feedstock Annual production capacity, plant utilisation (3 cases) and the natural gas efficiency factor per tonne of urea produced
3. Revenue Streams Urea offtake price (3 scenarios with indexation) and revenue from other sources
4. Variable O&M Natural gas cost, power consumption and cost, and other variable costs across salary, boiler feed water, cooling water, chemicals & catalyst, and overheads – each on its own scenario and indexation
5. Fixed Costs SPV costs, insurance, land lease, security, community payment and management fee
6. Funding Profile Cash equity, Equity Bridge Loan, senior construction debt, DSRA, refinancing of balloon repayment, and overdraft facilities
7. Debt Repayment Annuity, debt sculpting to a target DSCR, and even-principal options
8. Adjustments CPI and gas-price indexation curves, VAT during construction and operations, depreciation options, working capital (receivable/payable days) and income tax with tax holiday
Lender & Investor Outputs
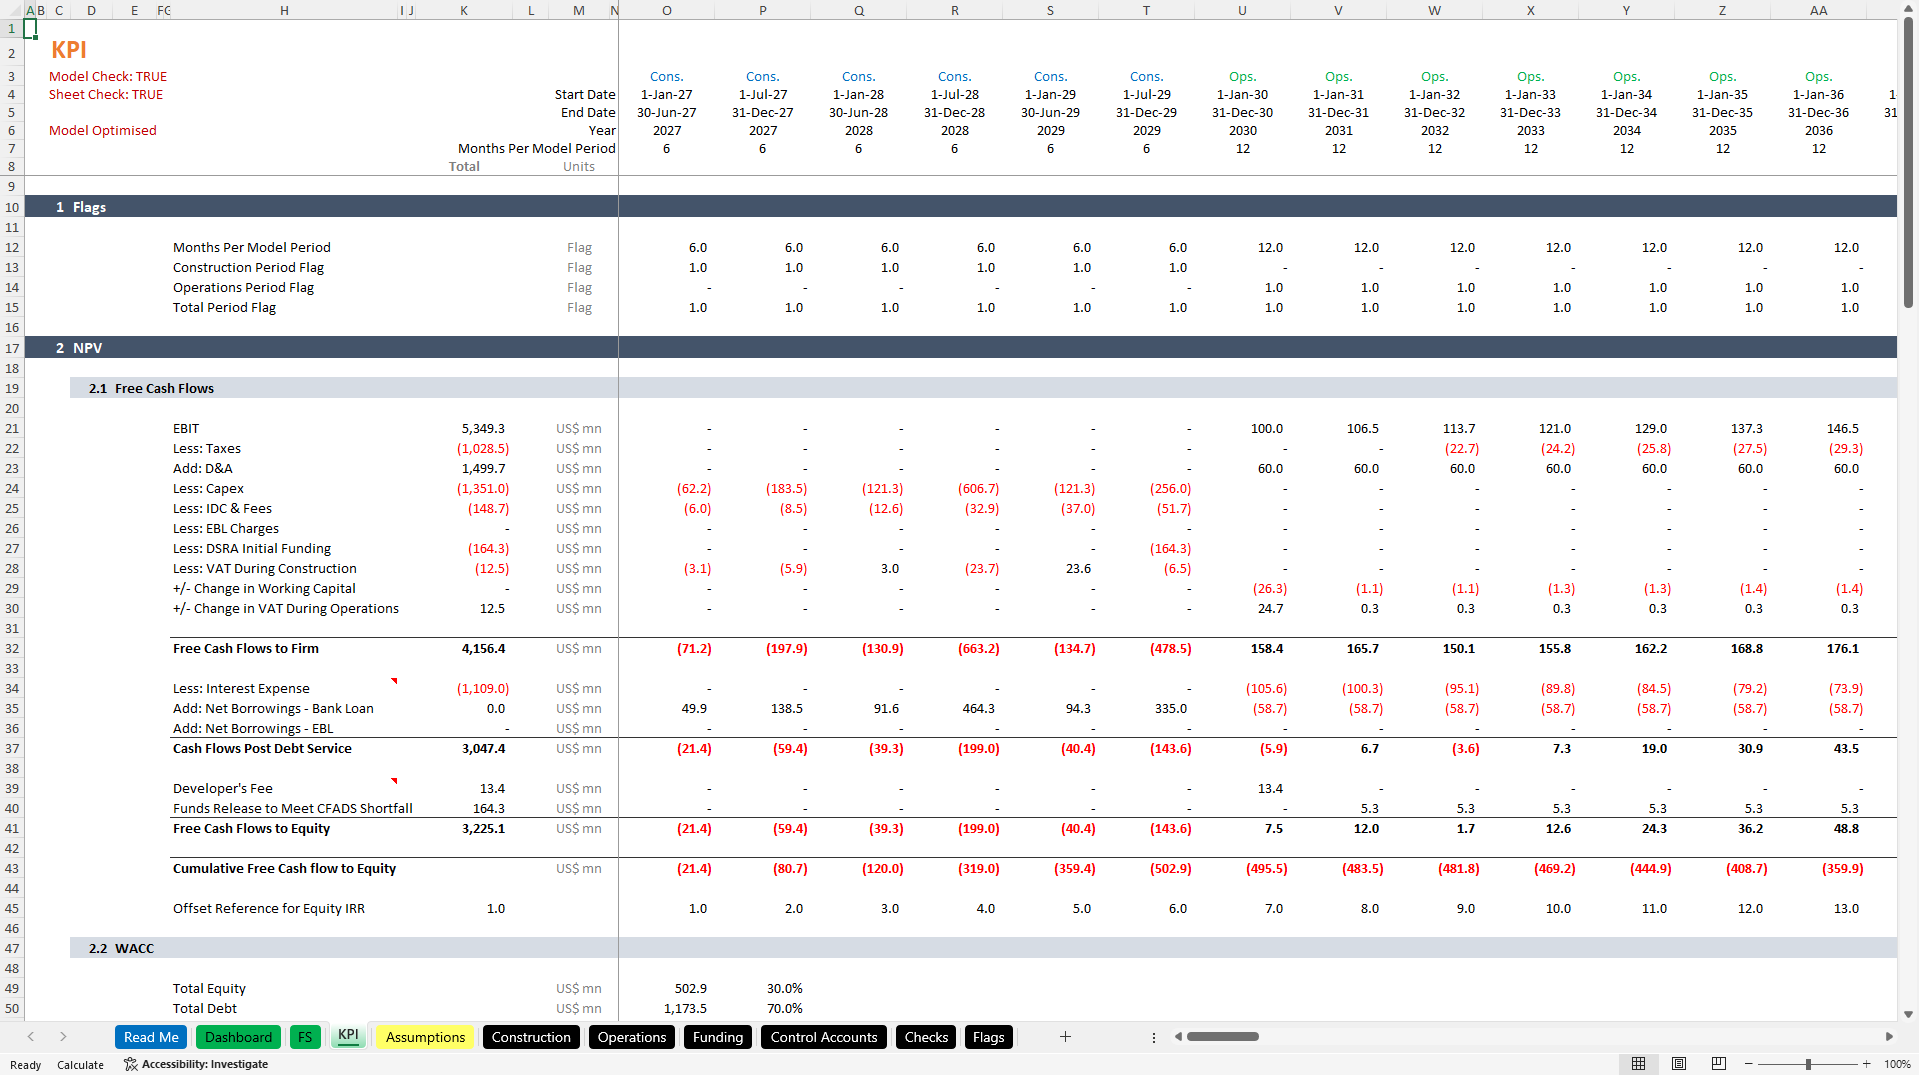
1. Project IRR & NPV – returns to the project as a whole
2. Equity IRR & NPV – returns to shareholders after debt service
3. Minimum & Average DSCR – the coverage lenders scrutinise first
4. LLCR & PLCR – loan life and project life coverage ratios
5. Gearing Ratio – the debt-to-equity structure of the project
6. Levelized Cost of Urea (LCOU) – the all-in cost per tonne that sets your competitive floor
7. Cash Waterfall & Debt Service Profile – the full cascade of cash through the structure
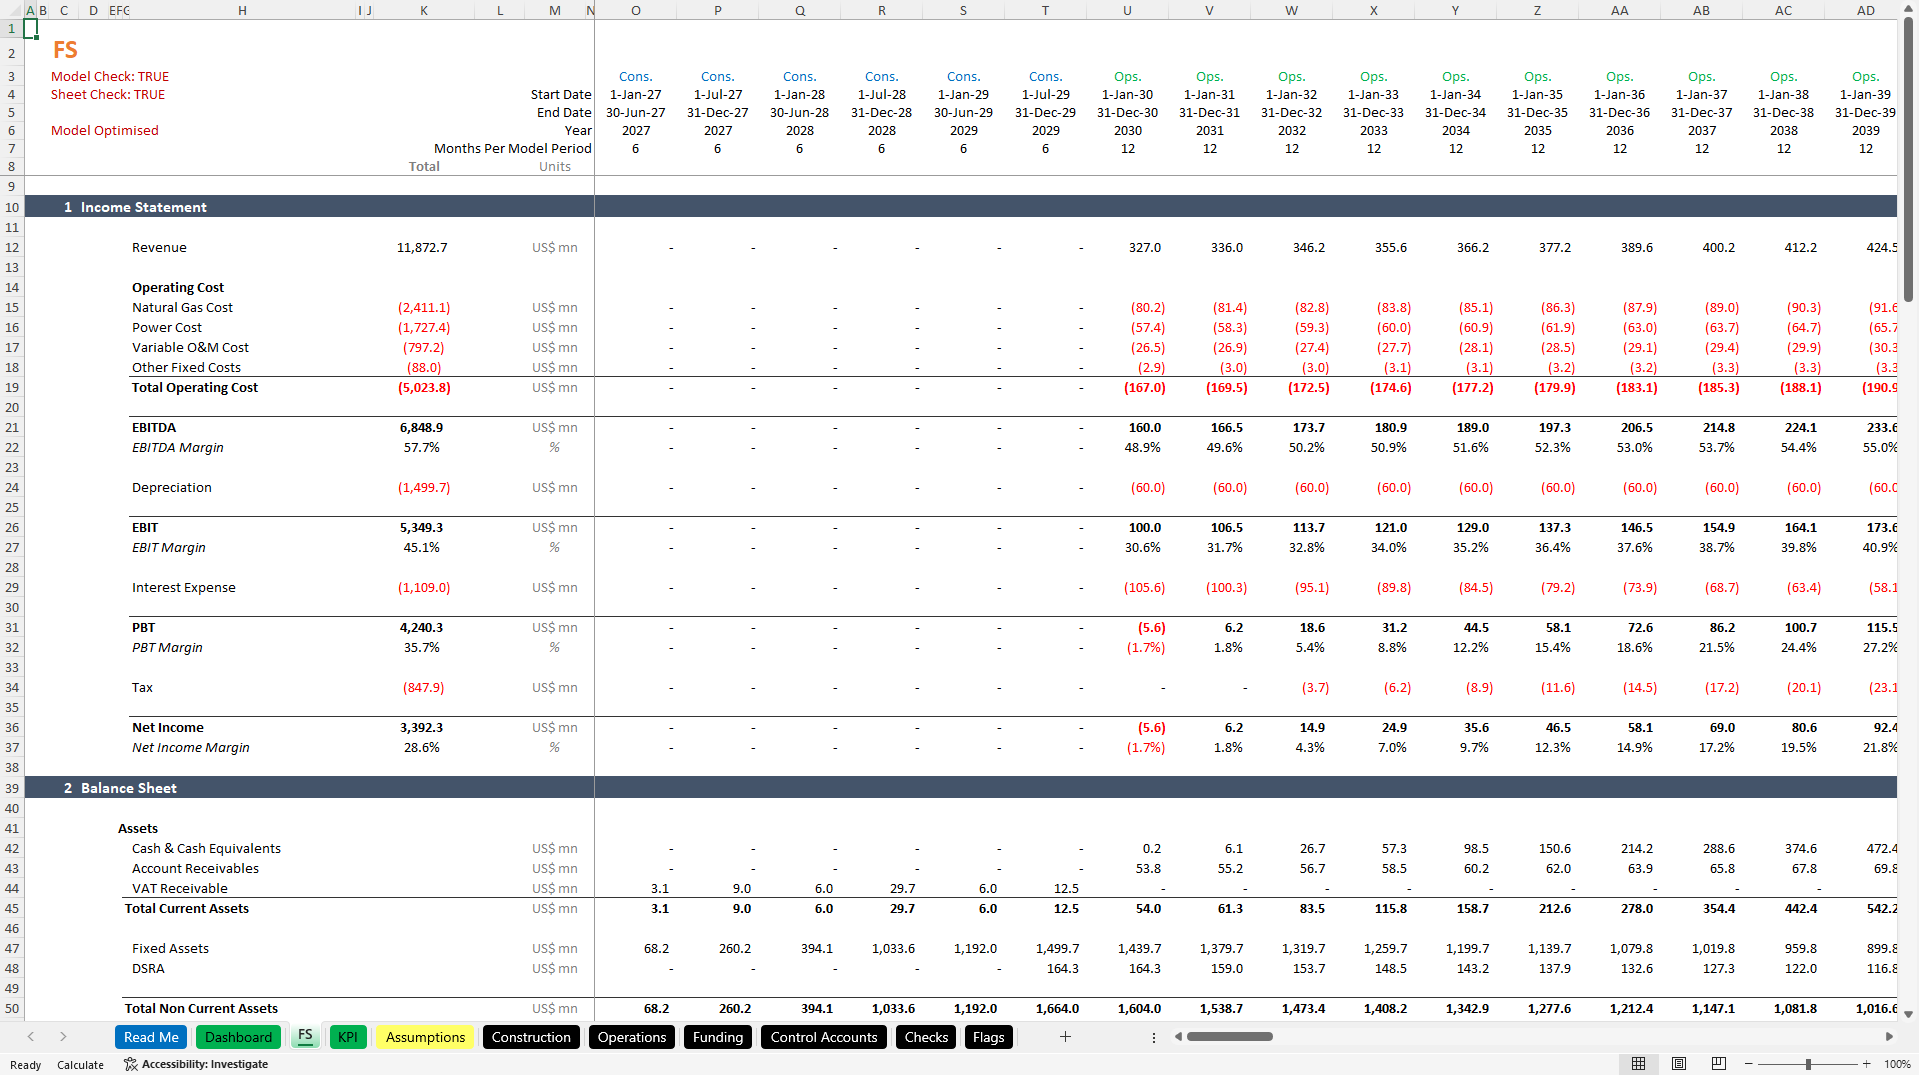
8. Integrated Financial Statements & Dashboard – income statement, balance sheet, cash flow and a fully linked dashboard
Who This Urea Plant Financial Model Is For
1. Urea and nitrogen fertilizer developers building the case for a build-and-operate project
2. Gas-to-chemicals and industrial investors assessing returns and structuring equity
3. Lenders and debt advisors testing coverage ratios and debt sizing
4. Project finance advisors preparing bankable models for financial close
5. Fertilizer and energy finance teams running feasibility and scenario analysis
Got a question about the product? Email us at support@flevy.com or ask the author directly by using the "Ask the Author a Question" form. If you cannot view the preview above this document description, go here to view the large preview instead.
Source: Best Practices in Financial Modeling, Chemical Industry Excel: Urea Plant Financial Model | Natural Gas to Urea Excel Excel (XLSB) Spreadsheet, Fin-Wiser Advisory
ABOUT THE AUTHOR

Fin-wiser is a specialist advisory boutique focused on providing financial modelling, financial analysis, business transformation and business research services.
Our mission is to deliver high-quality Financial Models, Financial Analysis, Operational Transformation and Data Analytics which are custom made as per the business requirements. These solutions can integrate elements of business,
... [read more]
Ask the Author a Question
You must be logged in to contact the author.




























