
 Click main image to view in full screen. Unlock all 9 preview images:
Feasibility Study Financial Model: DSCR, NPV & IRR – Excel XLSX
Excel (XLSX) + supplemental PDF


BENEFITS OF THIS DOWNLOADABLE EXCEL DOCUMENT
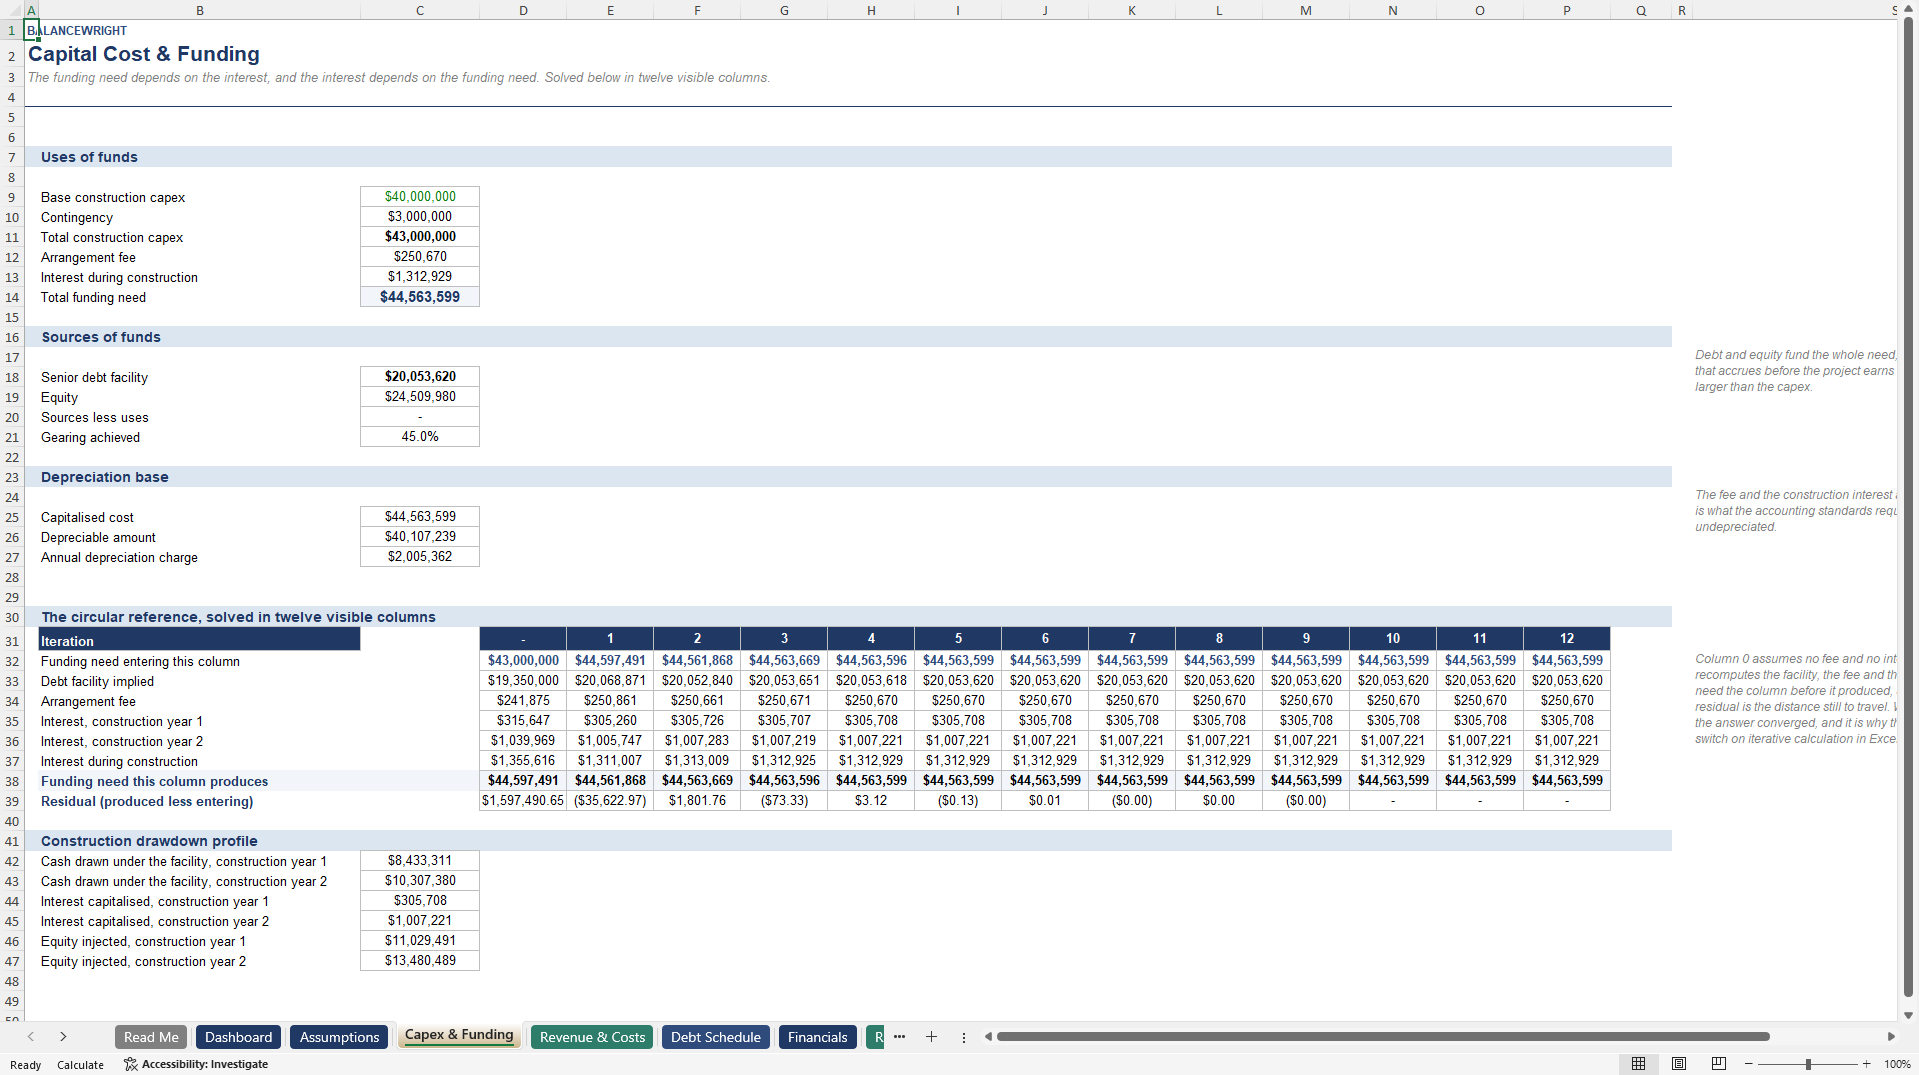
- Sizes the funding need including the arrangement fee and the interest that accrues during construction, solving that circular reference in twelve visible columns.
- Answers the lender's question as well as the investor's: the cover ratio in every operating year, and the debt a bank would actually have sized against your cash flow.
- Three sensitivity ladders that re-derive the whole cash flow from scratch, and seventeen integrity checks that must all read PASS.
FINANCIAL MODELING EXCEL DESCRIPTION
A feasibility study exists to answer two questions, and most templates answer only the first. Is the project worth doing, and can it be financed?
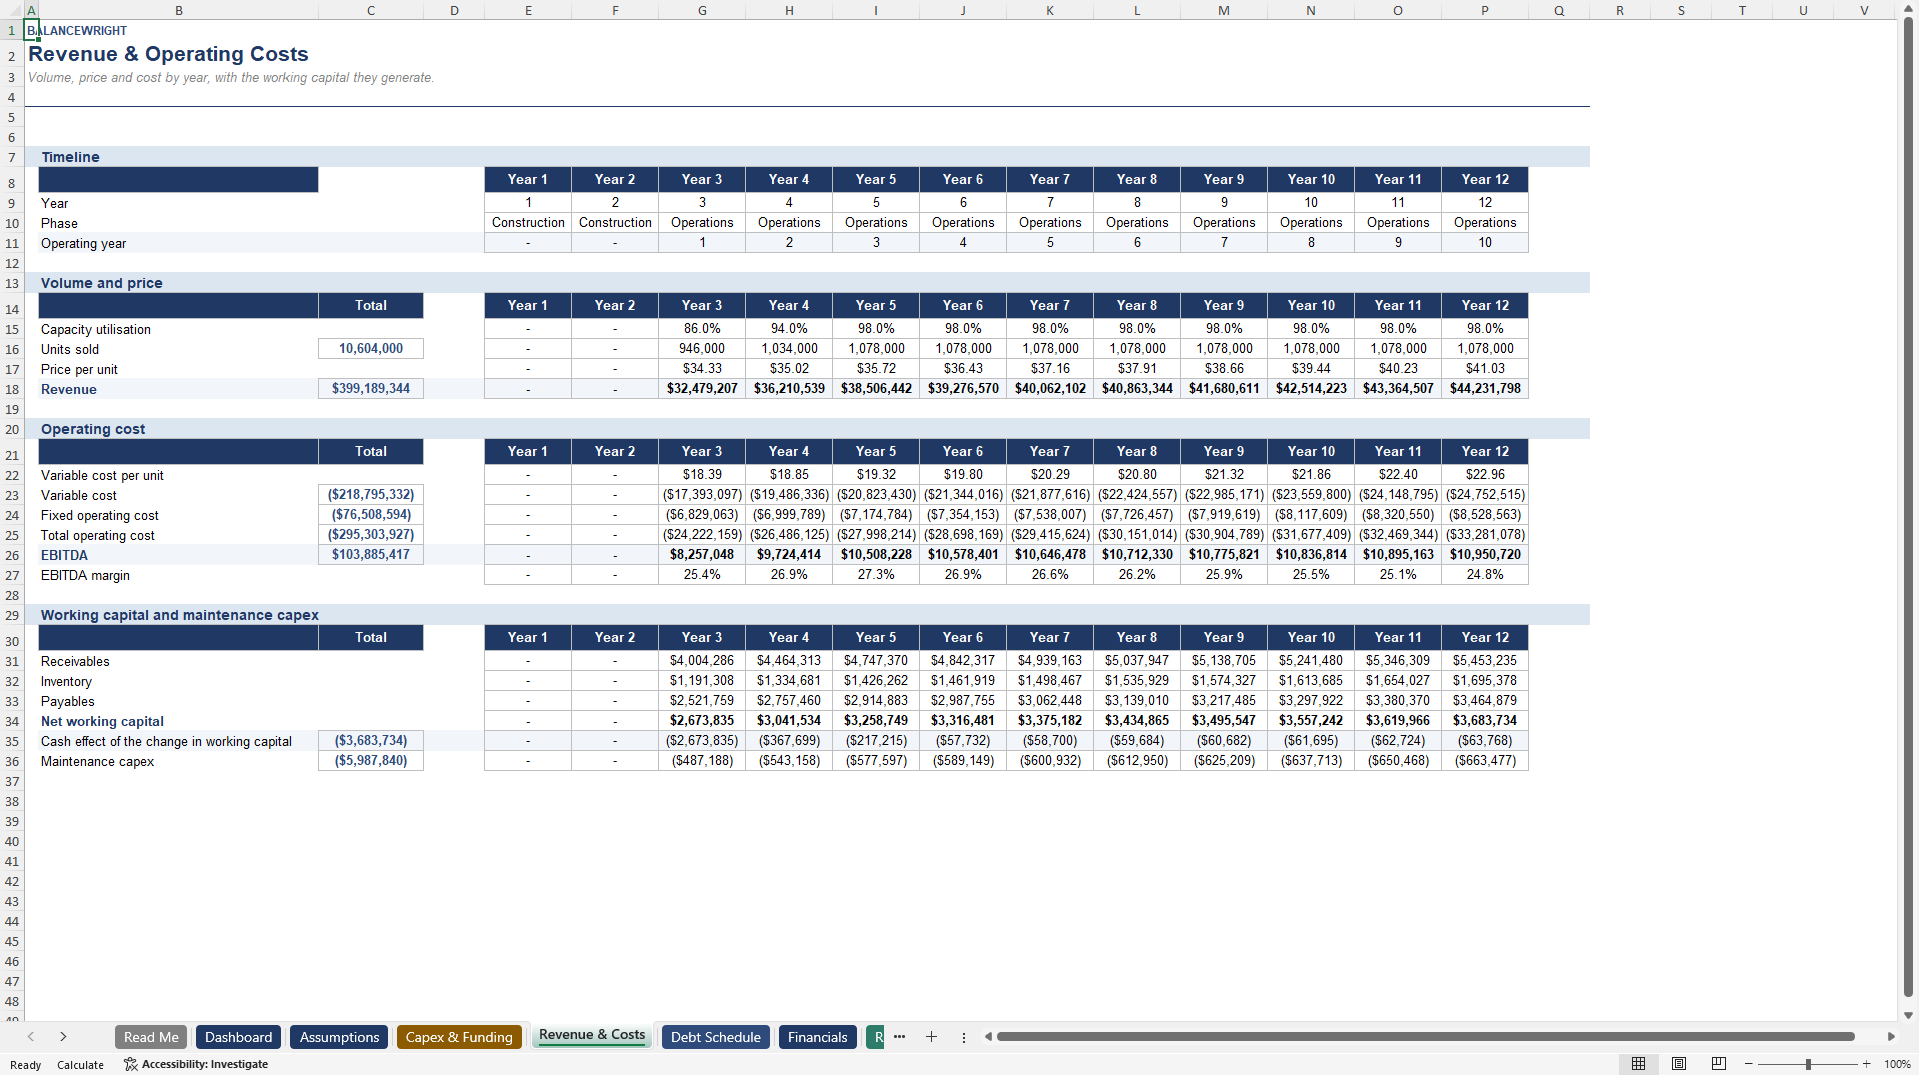
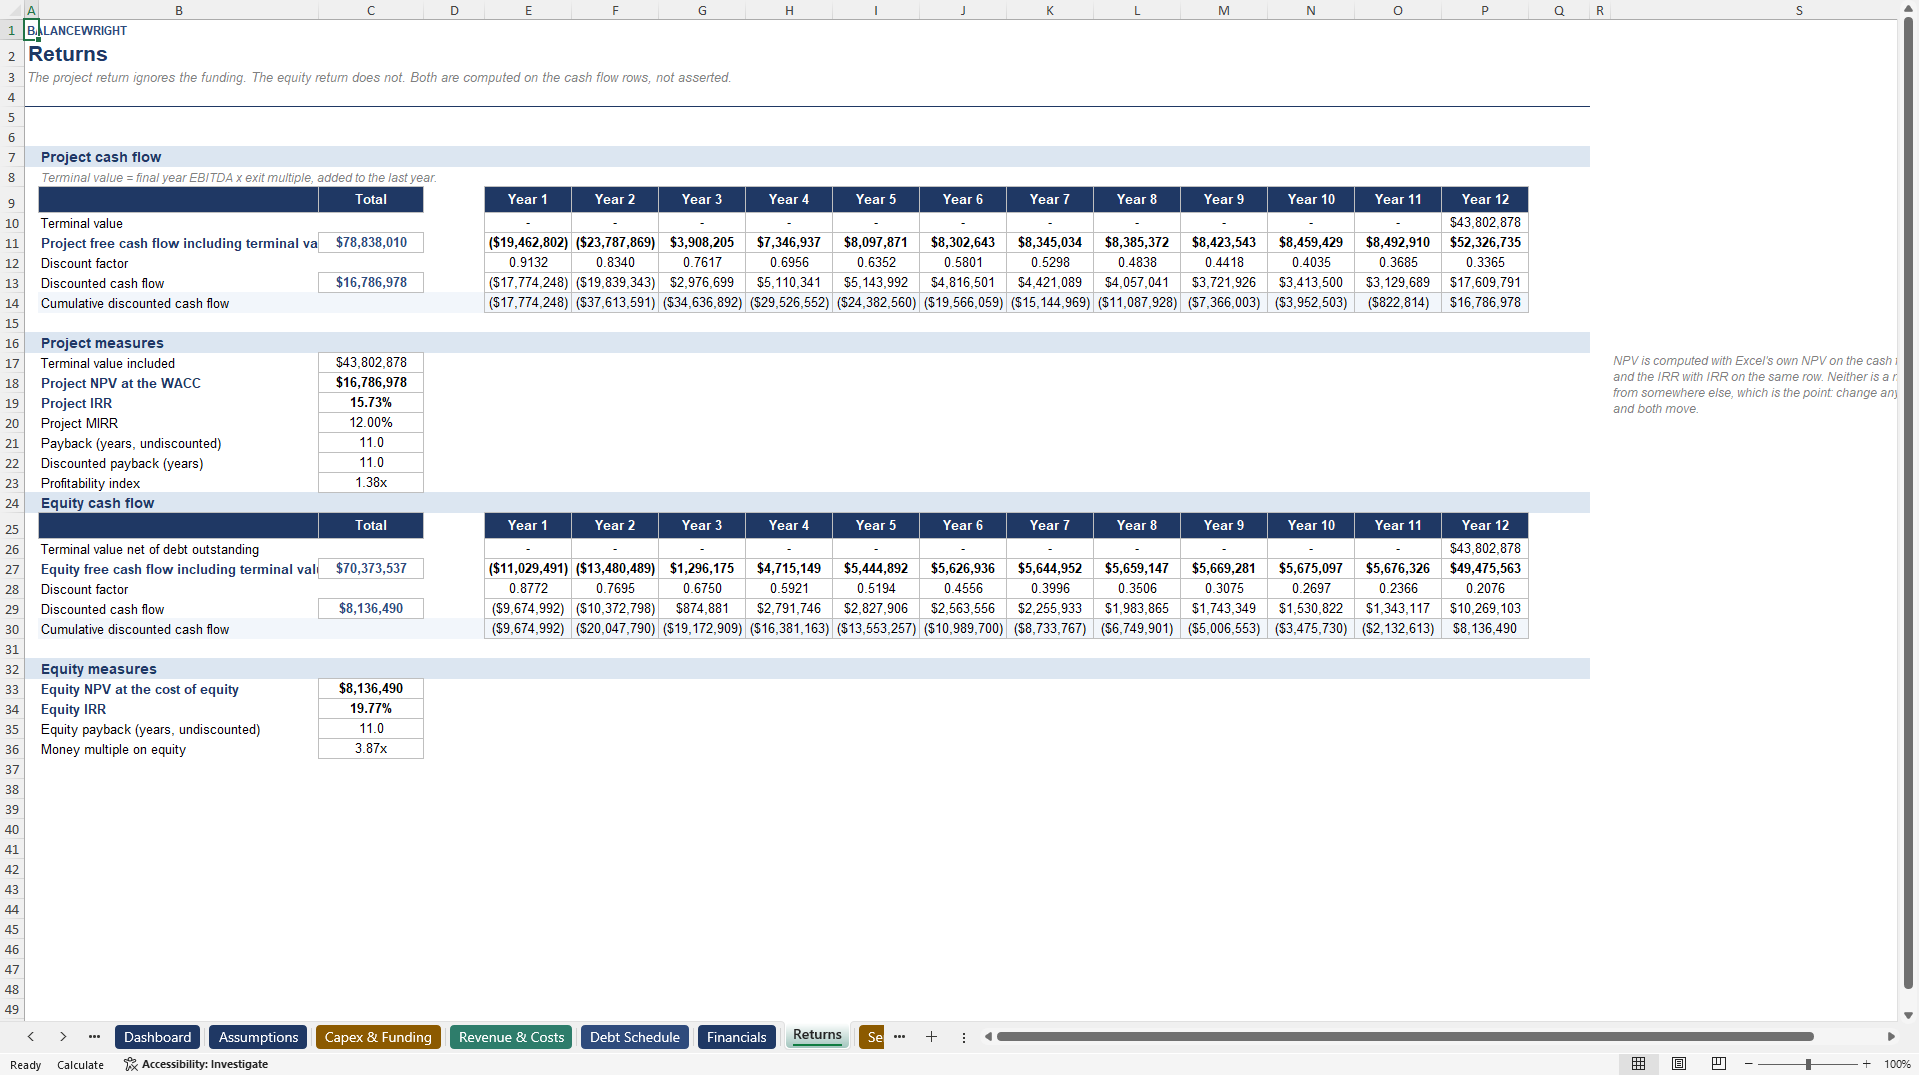
This Excel model answers both. It sizes the capital cost and the funding need, builds a debt schedule from that need, reports the cover ratio in every operating year against the covenant a lender would set, and computes the return to the project and to the equity separately. Every figure is a live formula. It is industry-agnostic: a plant, a hotel, a fleet, a processing line – anything with a construction period followed by an operating life.
THE CIRCULAR REFERENCE EVERY PROJECT MODEL HAS
The interest that accrues while a project is being built has to be funded. Funding it enlarges the amount to be raised. Raising more means the debt is larger, and a larger debt accrues more interest. That is a circular reference, and a spreadsheet cannot resolve it without either iterative calculation or a solve.
Most feasibility templates deal with this by pretending it does not exist. They size the debt on the capex alone and add the construction interest afterwards, which understates the funding need and overstates the equity return. In the worked example the difference is $1.56m on a $43m project.
This model puts the loop on the page. Twelve columns run left to right. Column zero assumes no fee and no interest at all, and each column afterwards recomputes the facility, the fee and the construction interest from the funding need the column before it produced. The residual row is the distance still to travel, and you can watch it fall from $1.6m to zero. Excel's iterative calculation setting is never touched.
THE QUESTION A LENDER ASKS
An investor asks whether the return beats the cost of capital. A lender asks something narrower: does the cash arrive in time to service the loan in the year it is thinnest. A project can clear its hurdle rate comfortably and still be unfundable.
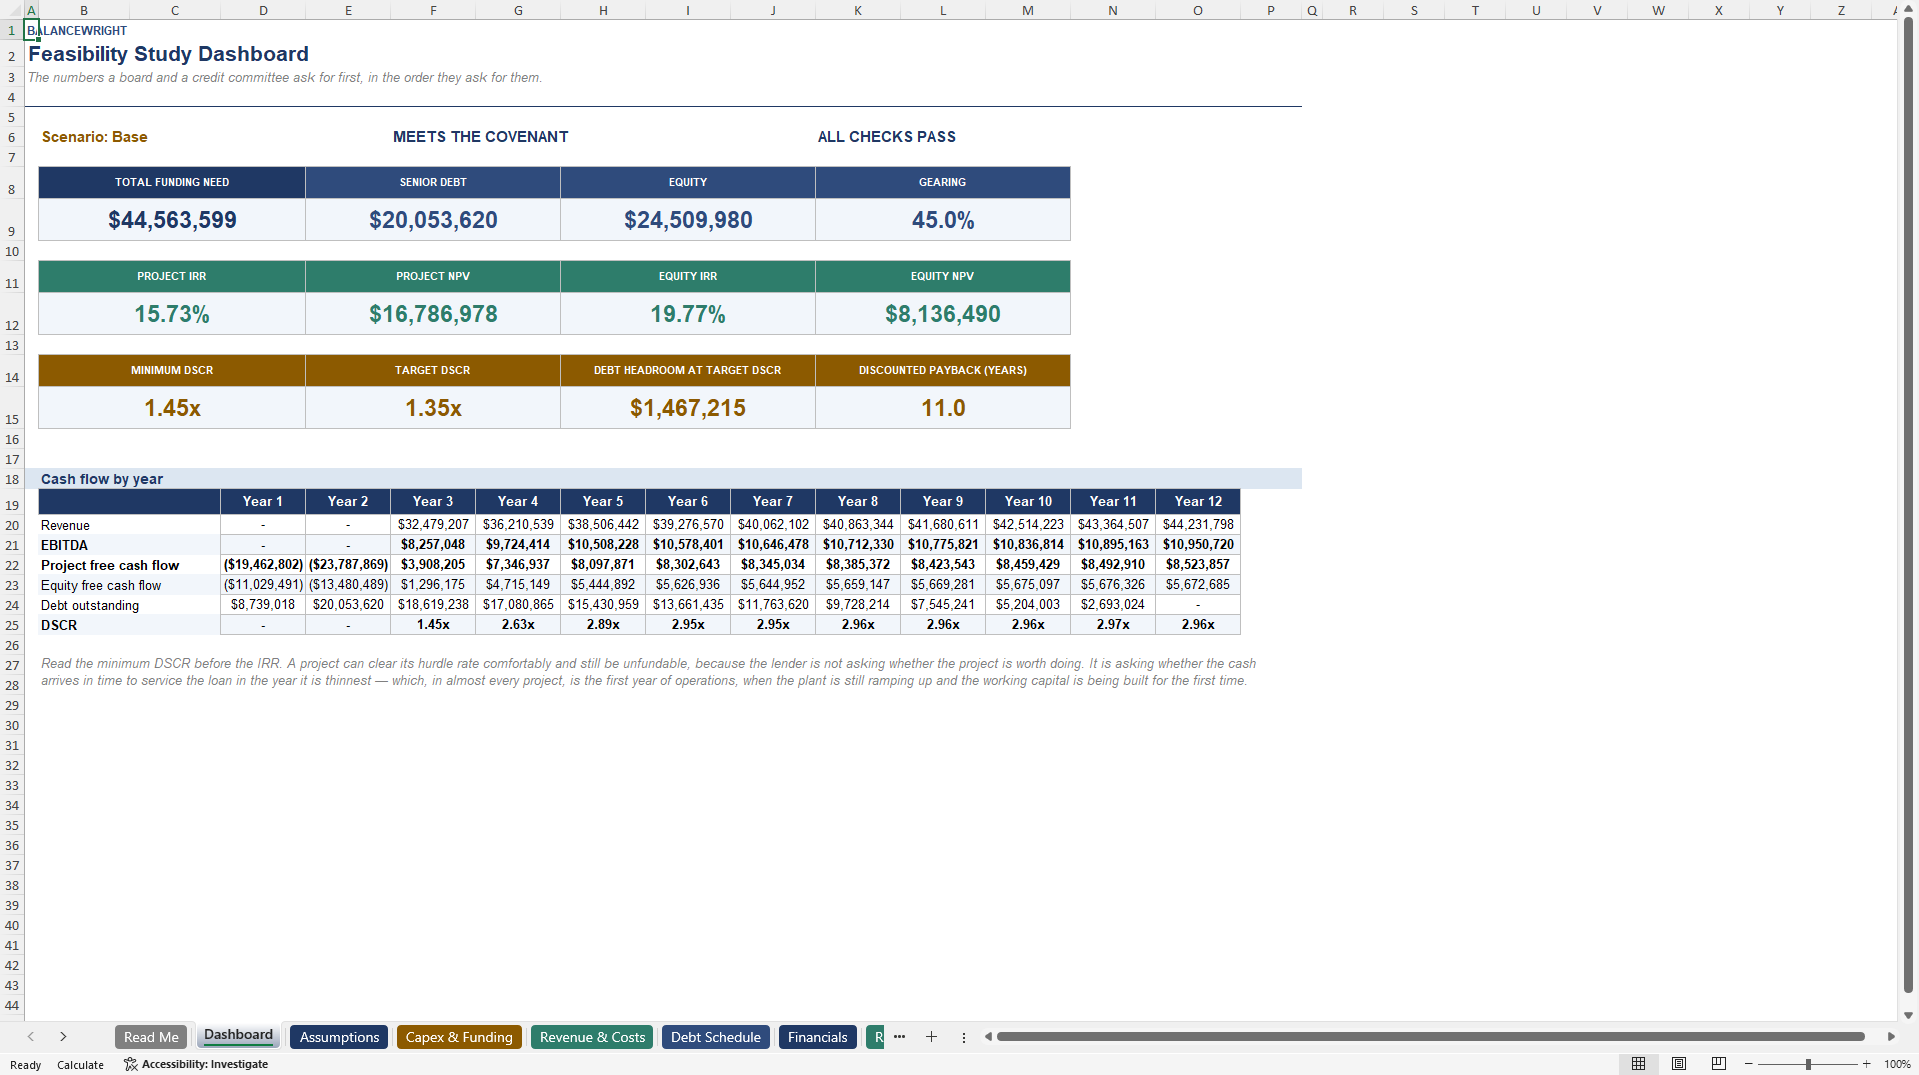
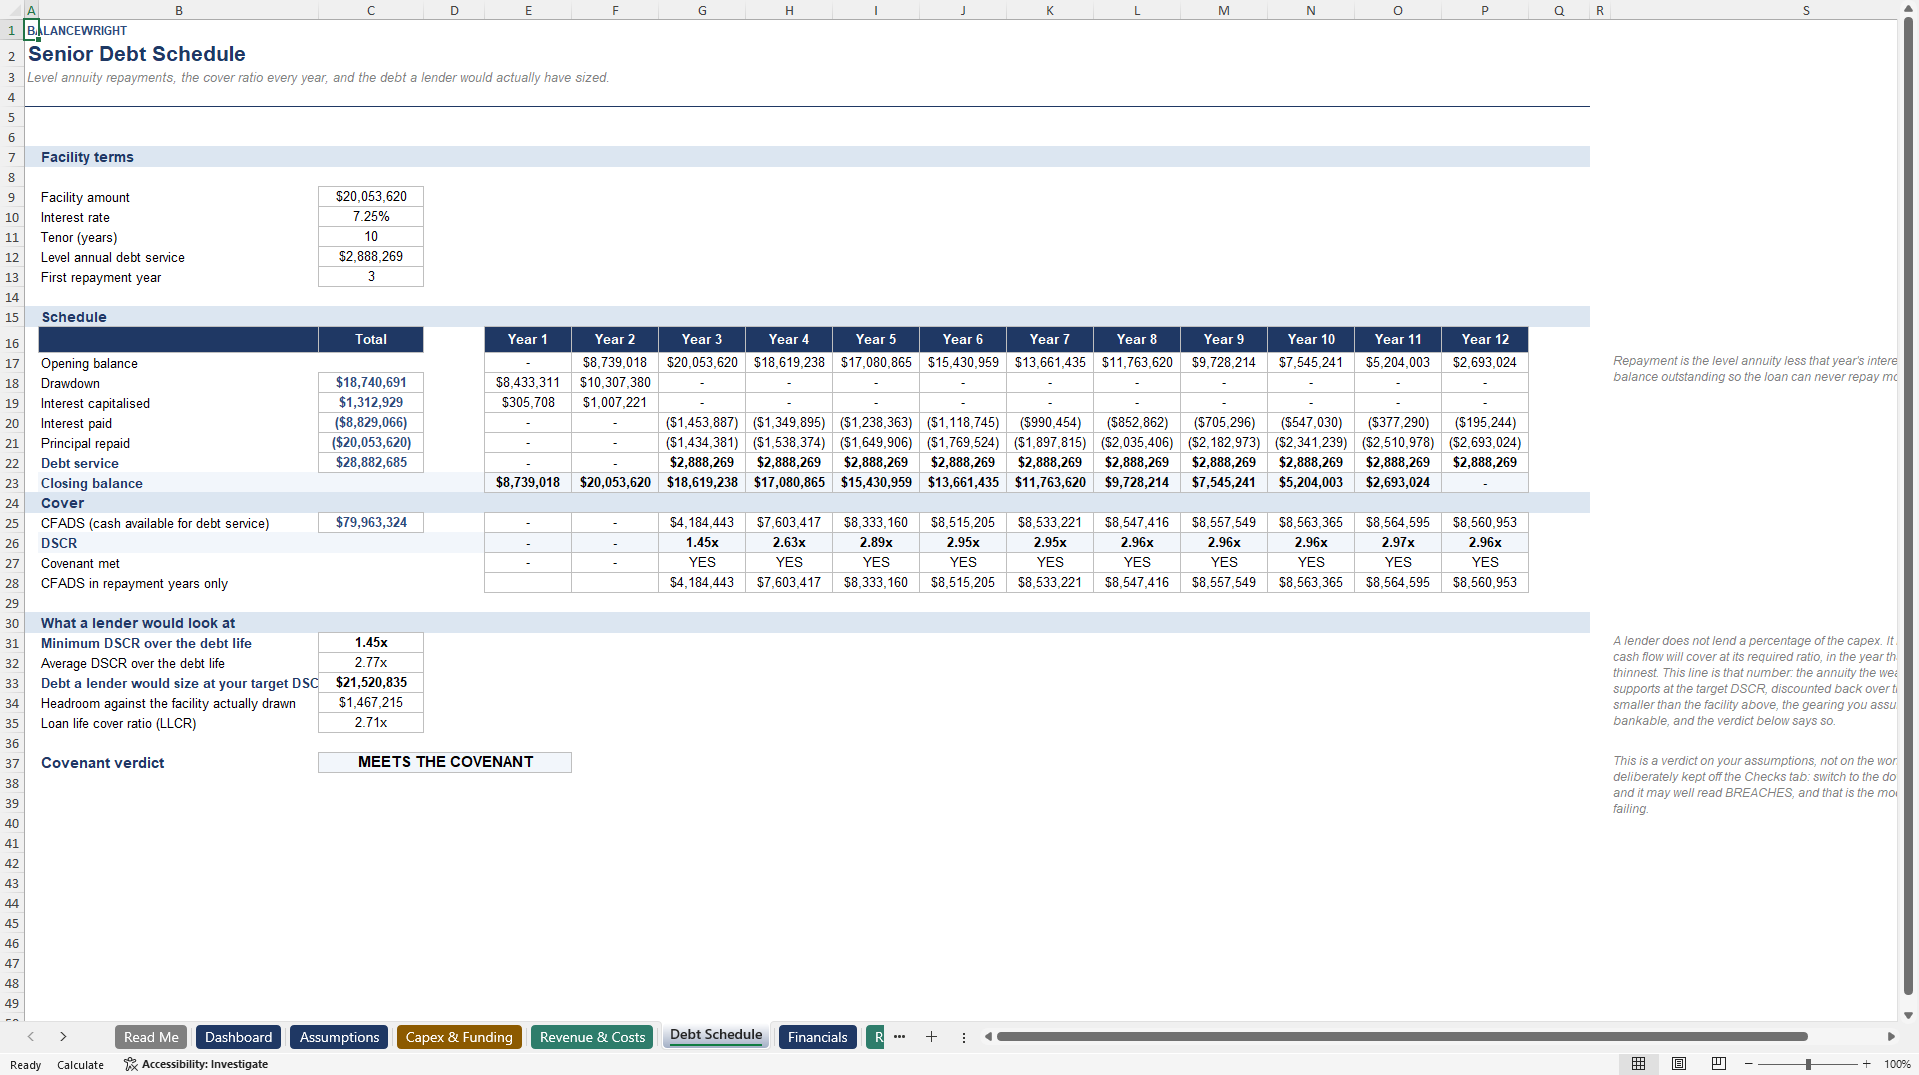
The Debt Schedule tab reports the debt service cover ratio in every operating year, tests it against your covenant, and gives a verdict. It also reports the debt a lender would have sized on this cash flow – the annuity the weakest year supports at your target ratio, discounted over the tenor. In the worked example that is $21.5m against a facility of $20.1m, so the gearing survives, with $1.5m to spare and no more.
The binding year is almost always the first year of operations, when the plant is still ramping up and the working capital is being built for the first time. Here the ratio is 1.45x in that year and about 2.95x for the rest of the loan's life. The average tells you nothing.
TWO TAX LINES
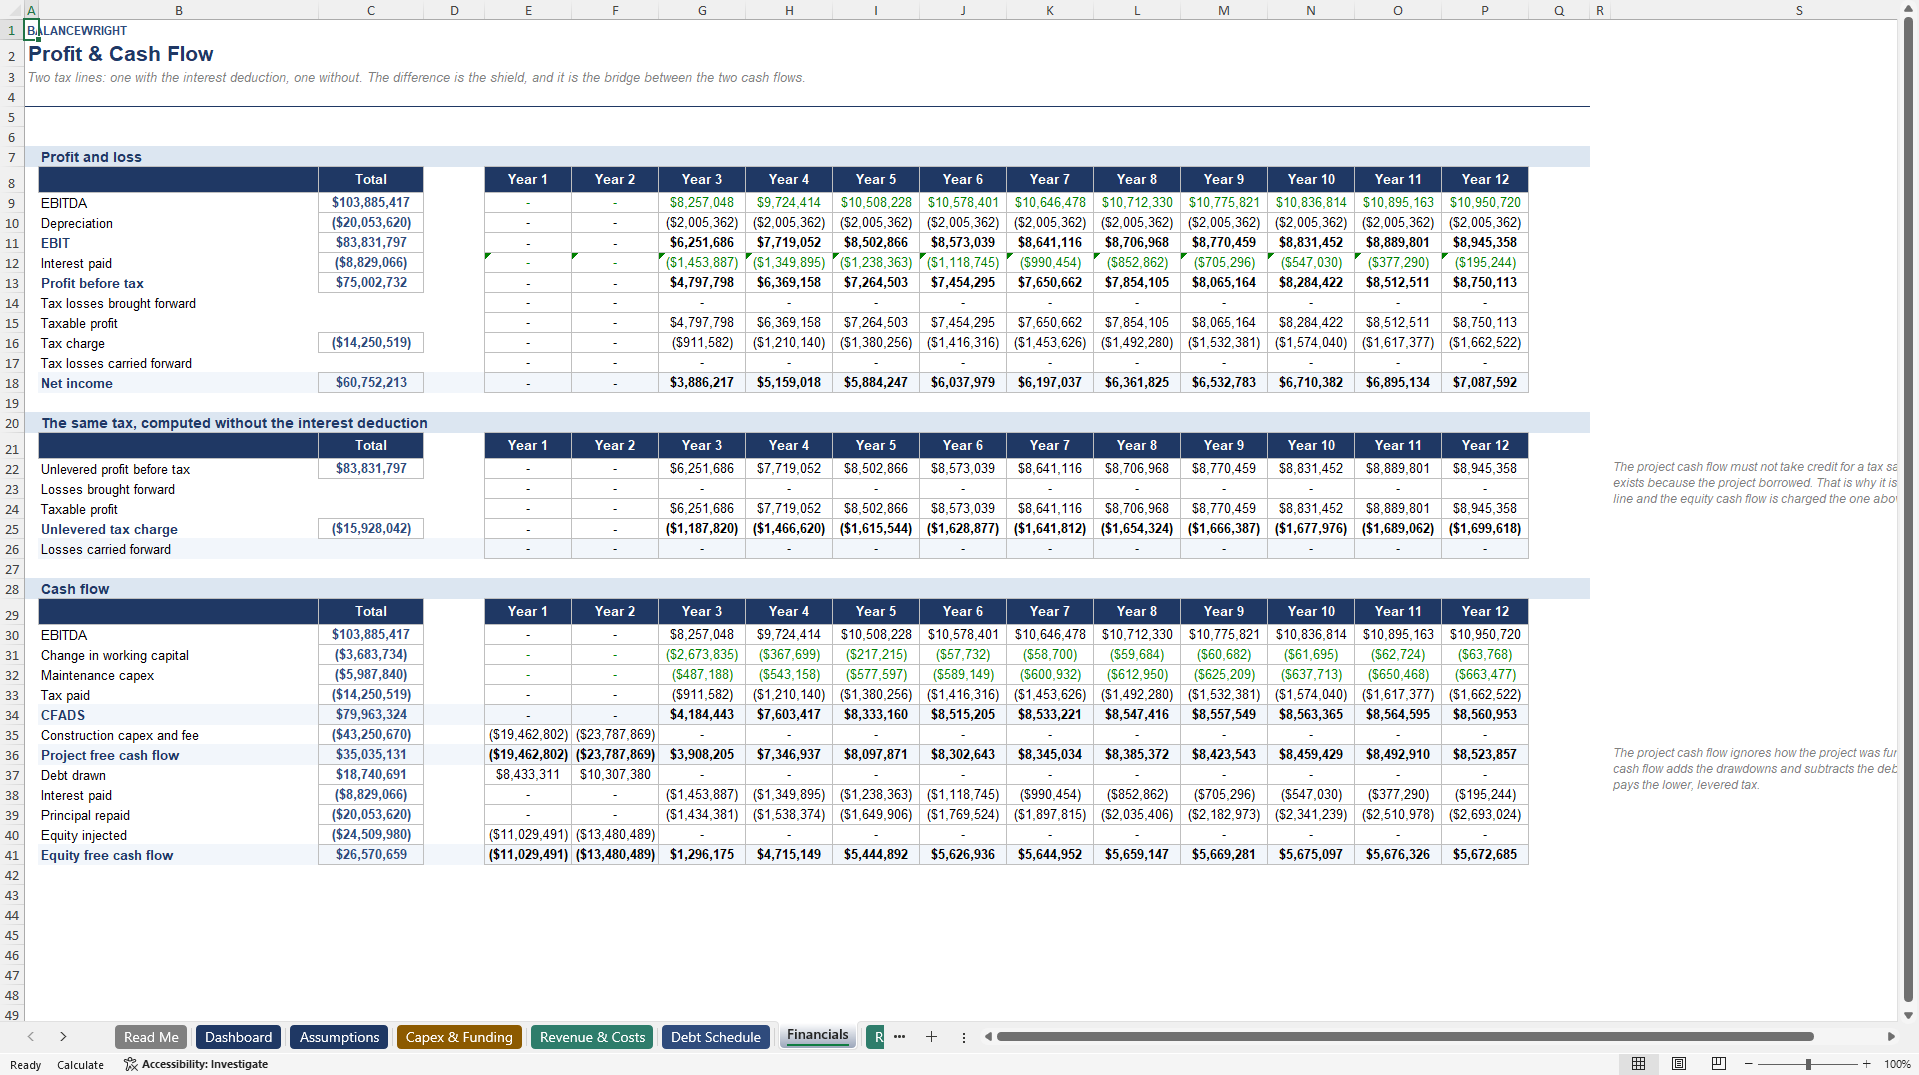
Interest is deductible, so a geared project pays less tax than an ungeared one. That saving belongs to the financing, not to the project. A project IRR that quietly includes it is flattering the asset with a benefit that came from the balance sheet. This model computes tax twice, charges the unlevered figure to the project cash flow and the levered one to the equity, and an integrity check proves the two differ by exactly the financing and the shield.
WHAT IS INSIDE
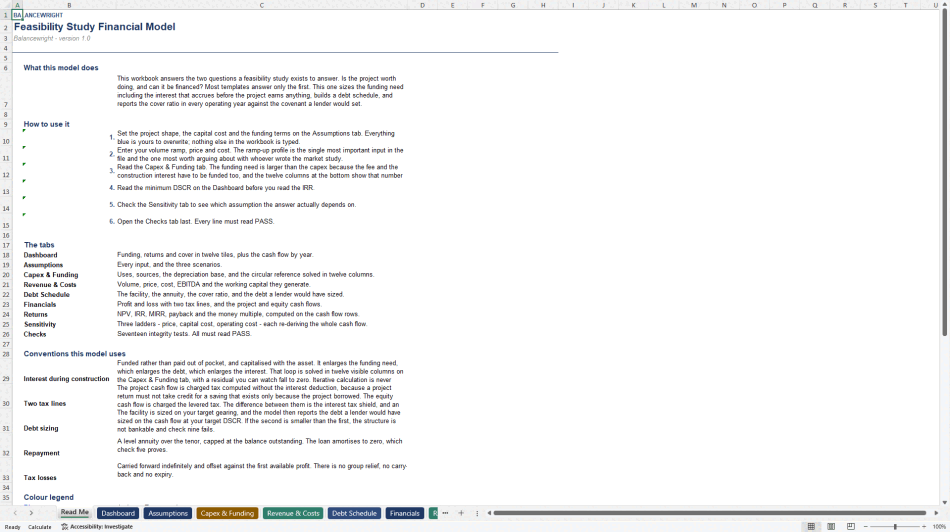
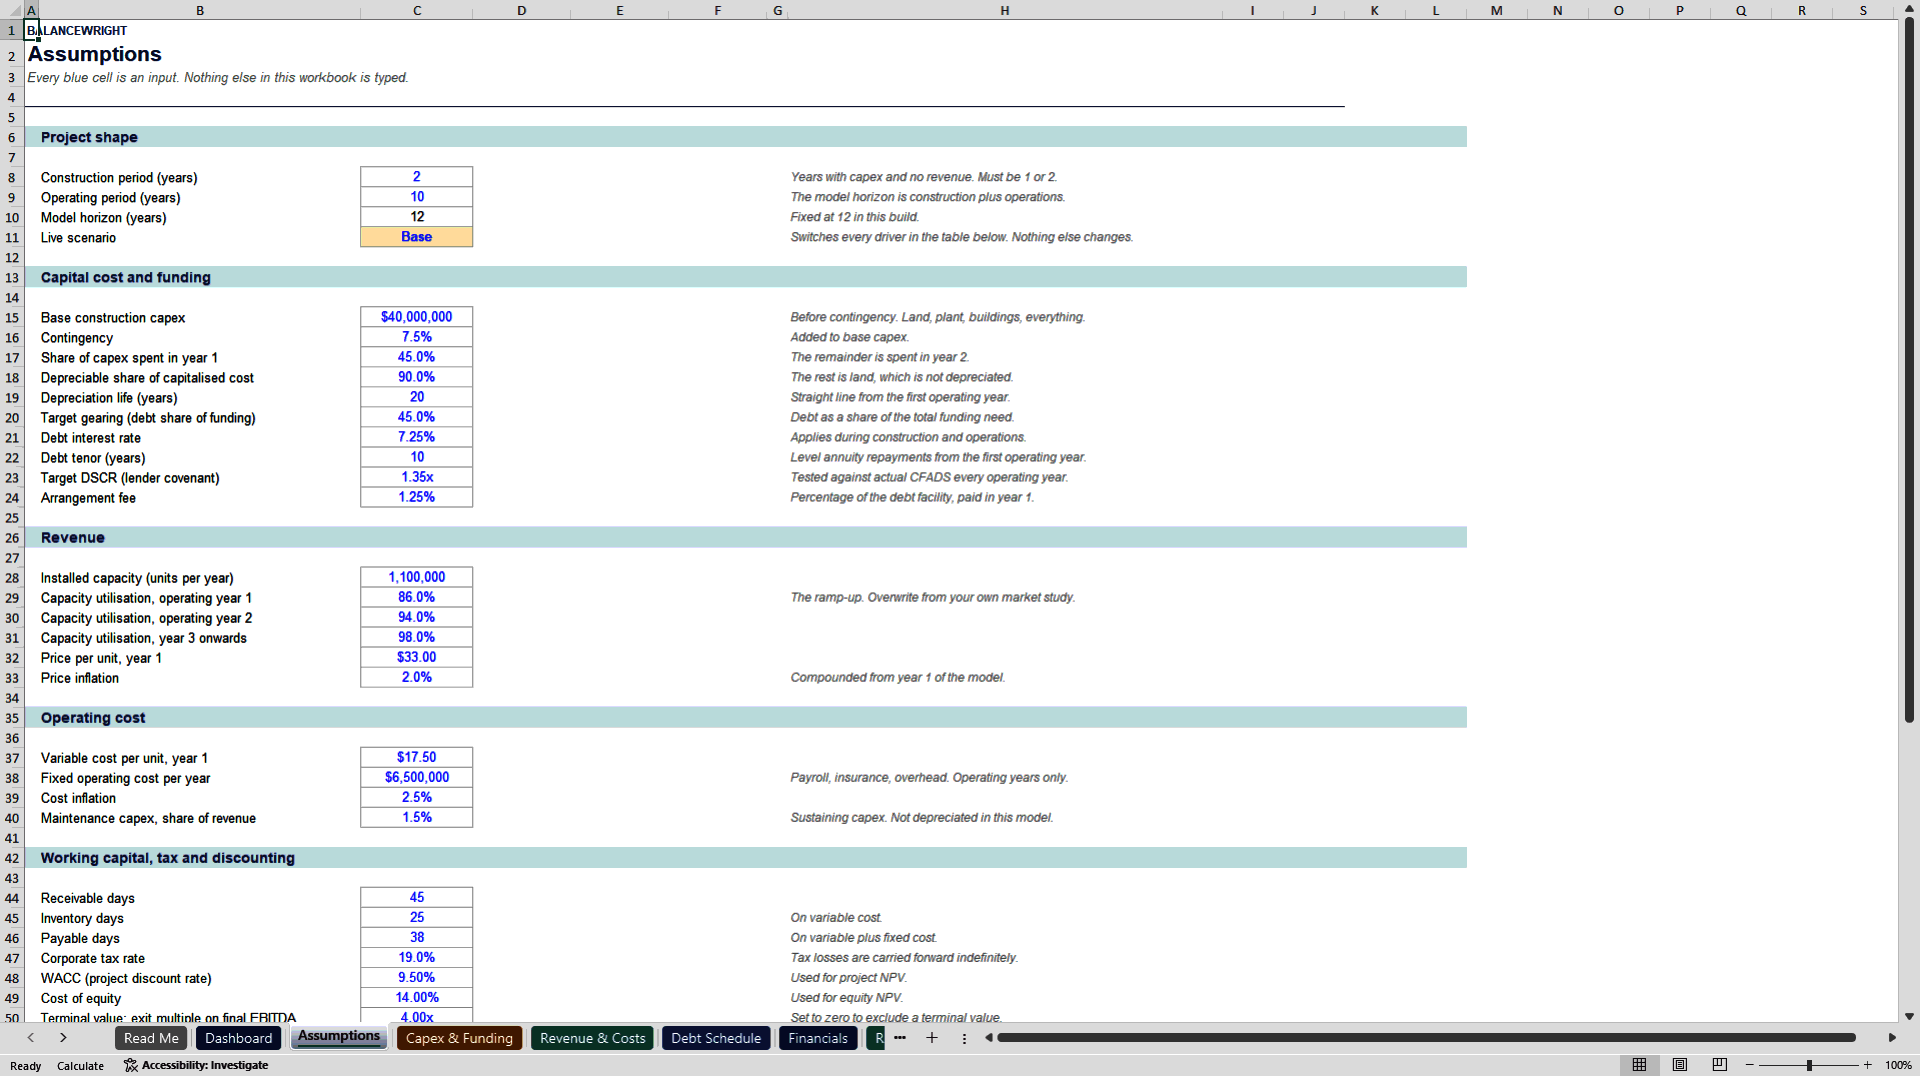
Ten tabs: Read Me, Dashboard, Assumptions, Capex & Funding, Revenue & Costs, Debt Schedule, Financials, Returns, Sensitivity, Checks. Twelve years, three scenarios from one cell, 1,419 live formulas. No macros, no add-ins, no external links, no password protection, no locked cells and no iterative calculation to switch on.
The Sensitivity tab runs three ladders – price, capital cost, operating cost – each re-deriving the whole project cash flow from scratch rather than scaling the row above it. In the worked example a ten percent fall in price takes the return below the cost of capital, and so does a twenty percent rise in operating cost. That is the honest headline of the study, and it is not visible anywhere on the dashboard.
A five-page PDF guide documents every convention and every limitation. Seventeen integrity checks sit on their own tab and must all read PASS.
This workbook models the arithmetic of your own project. It is not investment advice, and the worked example is invented.
Building this from scratch takes a competent financial modeller two to four days.
Got a question about the product? Email us at support@flevy.com or ask the author directly by using the "Ask the Author a Question" form. If you cannot view the preview above this document description, go here to view the large preview instead.
Source: Best Practices in Financial Modeling, Valuation Excel: Feasibility Study Financial Model: DSCR, NPV & IRR Excel (XLSX) Spreadsheet, Balancewright
ABOUT THE AUTHOR

Balancewright builds working financial models for subscription and recurring-revenue businesses -- cohort retention, revenue movement, unit economics, cash flow and scenario forecasting.
Every model is formula-driven end to end. No locked cells, no passwords, no macros and no external links, so any calculation can be inspected, adapted and audited. Each file ships with a visible
... [read more]
Ask the Author a Question
You must be logged in to contact the author.




























