
Subscription-Based B2C SaaS 10-Year Financial Model – Excel XLSX
Excel (XLSX)
BENEFITS OF THIS DOWNLOADABLE EXCEL DOCUMENT
- Provides a complete financial framework for modeling, funding, and scaling a B2C subscription SaaS business from launch to exit.
- Projects 10 years of fully integrated revenue, costs, and cash flows driven entirely by real SaaS operating mechanics.
- Delivers the investor-grade unit economics, MRR waterfall, and 3-statement model every Series A committee demands on day one.
SAAS EXCEL DESCRIPTION
Curated by McKinsey-trained Executives
💻 B2C SaaS Financial Model | 3-Statement 10-Year Forecast
Turn your subscription software platform into a fundable, scalable, investor-ready operation – modeled with institutional-grade precision.
Whether you're a SaaS founder pitching your consumer app to venture capital, a product-led growth operator crossing $1M in annual recurring revenue, a private equity firm evaluating a software acquisition, or a CFO preparing for a Series A raise – this fully integrated 3-Statement Financial Model gives you the exact financial infrastructure to plan, pitch, fund, and exit with complete confidence.
💡 What's Inside
This model covers every financial dimension of building and scaling a B2C SaaS platform – from your launch ramp through a 10-year path to stabilized operations, strategic refinancing, or full exit. Built on Financial Modeling World Cup best practices, it's fully dynamic, cross-linked across 19 tabs, and ready to customize for your specific pricing tiers, user acquisition funnel, and market positioning.
📥 Inputs
• 🎯 Multi-Channel Acquisition Funnel – Starting monthly visitors, organic and paid traffic growth rates, referral coefficients, app store installs, visitor-to-signup conversion, free-trial-to-paid conversion, and referral viral mechanics – every lever that drives your subscriber waterfall, fully adjustable from a single Assumptions tab
• 💳 Dual-Stream Revenue Engine – Separate modeling for Subscription Revenue (four pricing tiers × billing mix) and Add-On & Other Revenue (feature unlocks, in-app purchases, advertising CPM) – blended platform revenue auto-calculated with realistic ramp curves built in, plus Integration Fees and Analytics Product revenue stacked on top
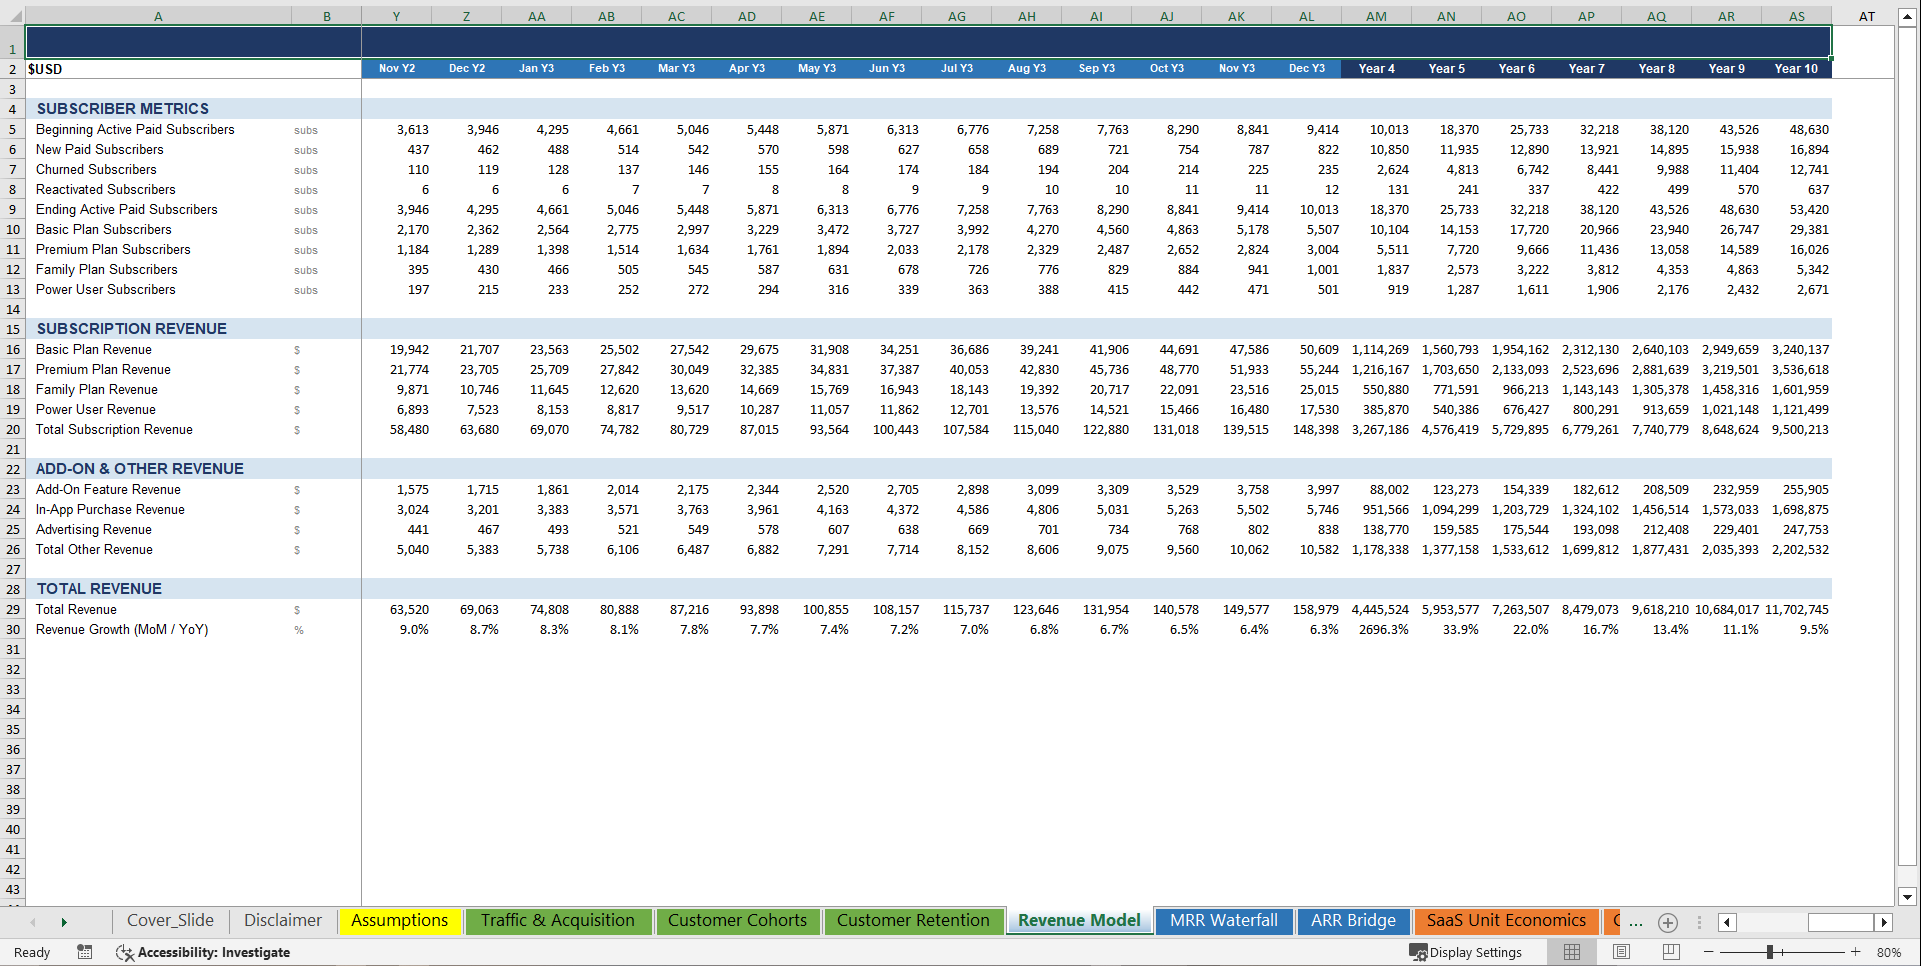
• 📦 5-Segment Revenue Stack – Basic, Premium, Family, and Power User subscription tiers driven by active subscriber counts and billing mix, late and add-on fees driven by user base and adoption rates, in-app purchase revenue driven by free-user monetization, advertising revenue driven by CPM and impression volume, and affiliate revenue driven by GMV-equivalent platform activity – every dollar modeled to its operational root cause
• 👥 4-Department Personnel Plan – Technology & Engineering, Product & Design, Sales & Marketing, and G&A – with Year 1 headcount by role, annual hire timeline, role-level salaries, annual raises, benefits load, and a department-by-department scaling plan across all 10 years
• 🏗️ Full CapEx & Depreciation Schedule – Capitalized software development (3-year amortization) and hardware and equipment (4-year depreciation) – plus annual CapEx growth, accumulated depreciation tracking, and Net PP&E for every year
• 📊 Cohort Retention & Churn Modeling – Monthly churn rate blending from launch-year levels down to mature steady-state, reactivation mechanics, upgrade and downgrade flows, cohort retention curves across 12 months, and annual equivalent churn – all flowing directly into your MRR Waterfall and subscriber stock reconciliation
• 🔍 Sensitivity & Scenario Analysis – Stress-test your model instantly: a 5×5 Churn Rate vs. Subscription Price matrix showing Year 3 revenue across 25 combinations, plus a Marketing Spend vs. Trial Conversion revenue scenario table – so you always know your downside floor and your upside ceiling
📤 Outputs
• 📈 10-Year 3-Statement Financial Model – Fully integrated Income Statement, Balance Sheet, and Cash Flow Statement, cross-linked and auto-balancing across all 10 years
• 💳 5-Stream Revenue Breakdown – Annual projections for Subscription Revenue, Add-On Feature Revenue, In-App Purchases, Advertising Revenue, and Affiliate & Partner Revenue – with year-over-year growth, operational driver transparency, and full revenue mix visibility
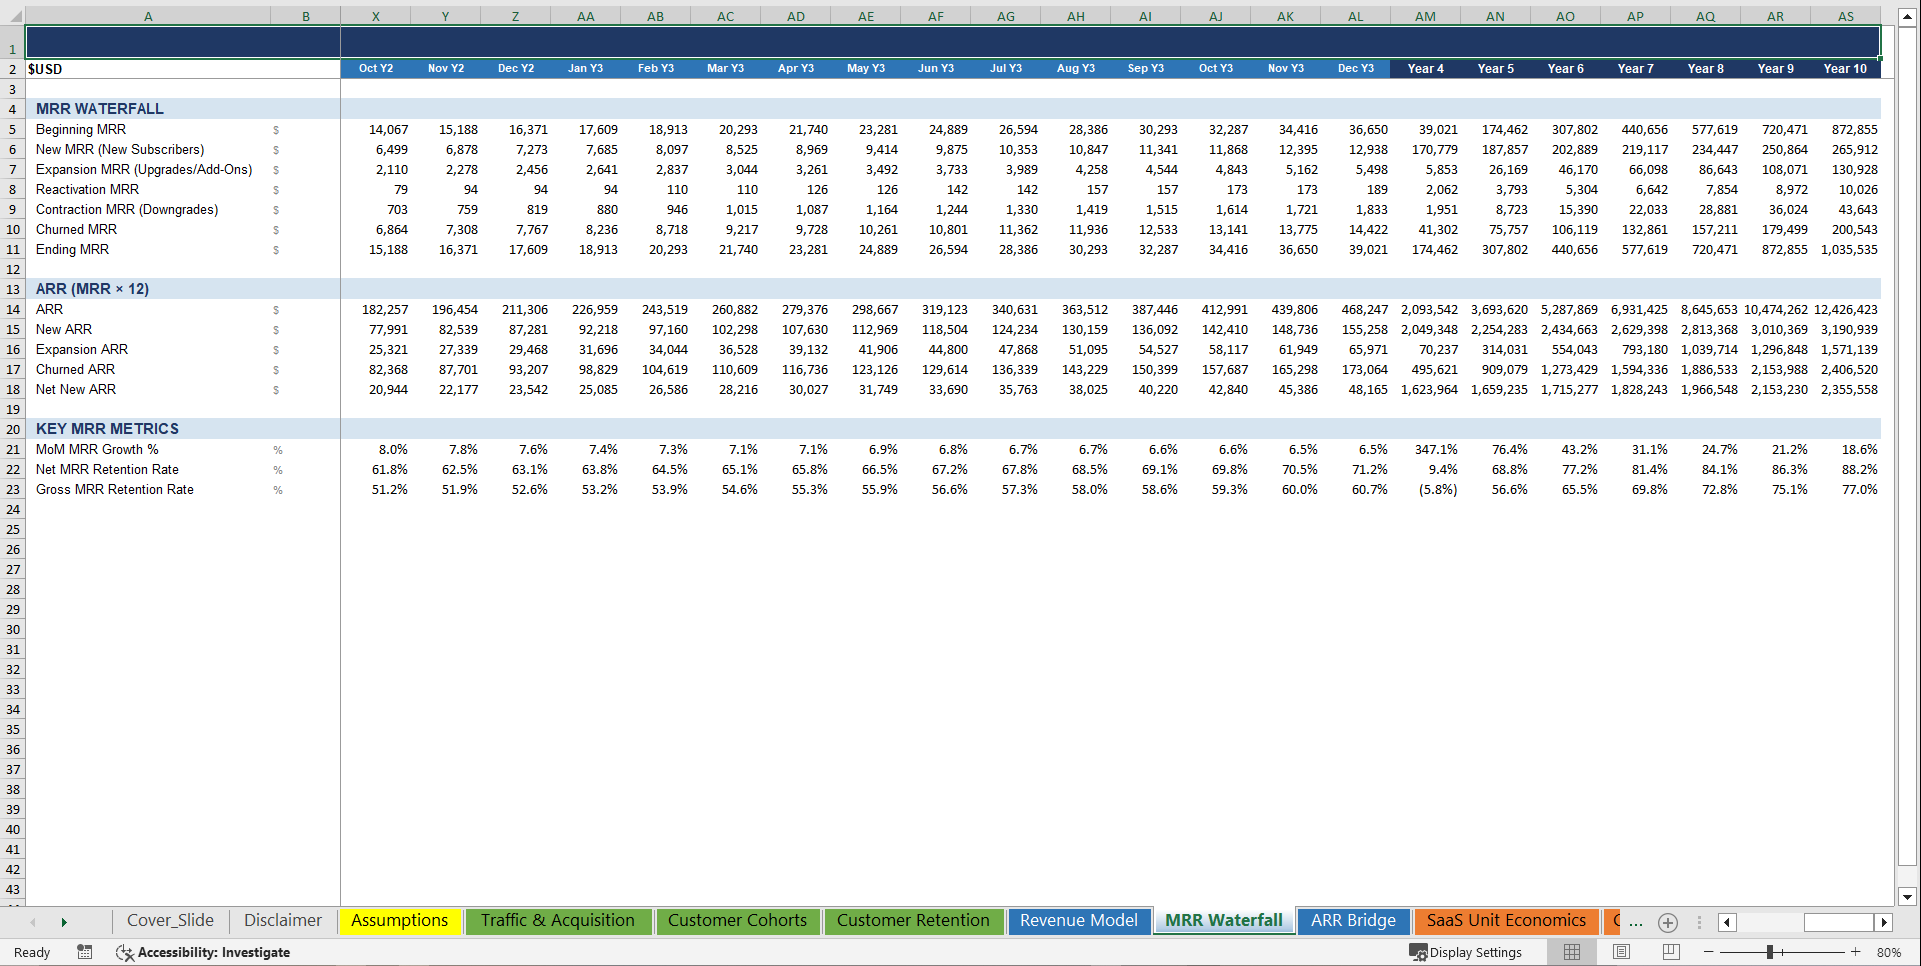
• 📊 MRR & ARR Waterfall – Beginning MRR, New MRR, Expansion MRR, Reactivation MRR, Contraction MRR, and Churned MRR fully reconciled to Ending MRR every single period – the exact waterfall every SaaS investor interrogates on page one of their due diligence checklist
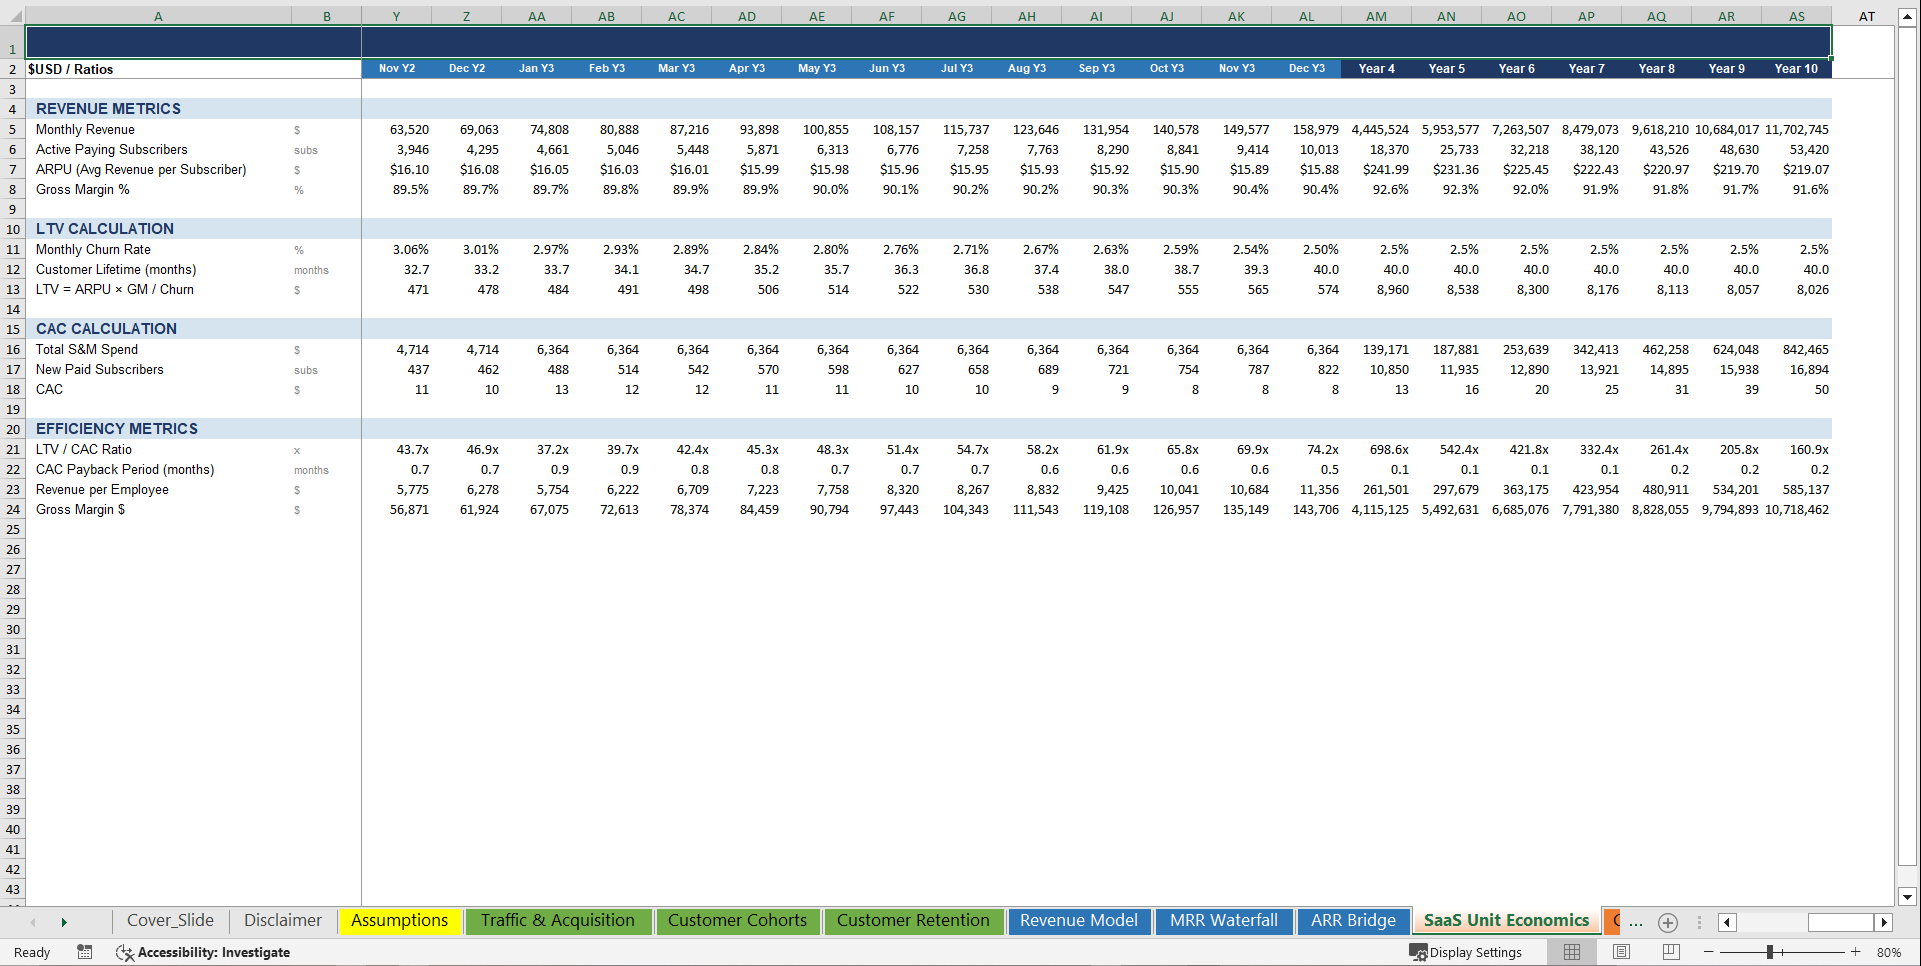
• 🔁 SaaS Unit Economics Engine – LTV calculated from ARPU × Gross Margin ÷ Churn Rate, CAC calculated from total Sales & Marketing spend ÷ new paid subscribers, LTV/CAC ratio, CAC payback period in months, and revenue per employee – all driver-calculated and updating live as you adjust any assumption
• 💼 Personnel Cost Schedule – Department-by-department headcount scaling with salary × benefits × annual raise compounding, total FTE count by year, and total personnel cost fully flowing into the Income Statement as a discrete operating expense line
• 🏛️ CapEx & Depreciation Schedule – Total CapEx per year with asset-class breakdown, Year 1 initial investment, ongoing platform CapEx, total annual depreciation by asset class, accumulated depreciation, gross PP&E, and Net PP&E end-of-period for all 10 years
• 🔄 Working Capital Schedule – Accounts Receivable, Prepaid Expenses, Accounts Payable, Accrued Expenses, and Deferred Revenue – with Net Working Capital and annual change in NWC fully linked into the Cash Flow Statement
• 🔍 Dual Sensitivity Analysis – Churn Rate × Subscription Price revenue matrix and Marketing Spend × Trial Conversion subscriber matrix – 50 instant scenario data points, color-coded for at-a-glance risk assessment
• 📊 Executive Dashboard – 5 dynamic working charts covering Revenue vs. EBITDA vs. Net Income, Subscriber Growth, ARR Trend, Gross and EBITDA Margin trends, and LTV vs. CAC – plus 10 KPI summary tiles covering every metric operators and investors ask about
🏆 Why This Model Stands Out
✅ Investor and lender-ready – structured and formatted to answer the exact questions venture capital partners, Series A committees, and strategic acquirers ask on day one: What is stabilized EBITDA? What is the net revenue retention rate? When does the platform cash-flow positive? What is the LTV/CAC ratio at scale?
✅ B2C SaaS platform realistic – built around how consumer subscription businesses actually generate and lose revenue: merchant base ramping gradually from launch, MRR building as subscriber and referral networks compound, churn modeled with a realistic maturation curve from early-stage to steady-state, comps and promotional costs modeled as a percentage of revenue, and a 20-role hiring plan that reflects how product-led growth platforms actually scale – not generic lending assumptions recycled into a SaaS template
✅ Color-coded for clarity – blue inputs, black formulas, green cross-sheet links, yellow flagged assumptions – industry-standard financial modeling conventions throughout, so any investor, operator, or acquirer can open it and immediately understand the logic
✅ Fully unlocked – no protected sheets, no black-box formulas, no hidden logic. Every assumption is visible. Every formula is auditable. Own it, customize it, and present it to any SaaS investor, consumer growth underwriter, or acquisition buyer with complete confidence
📋 Model Structure – 19 Sheets
• Executive Dashboard – 5 live charts + 10-card KPI summary across all key revenue, margin, subscriber growth, and cash metrics
• Assumptions – Every input centralized in one place: traffic and acquisition drivers, conversion funnel rates, subscription pricing, churn and upgrade mechanics, personnel costs, CapEx, and funding rounds – all blue-coded for instant editing
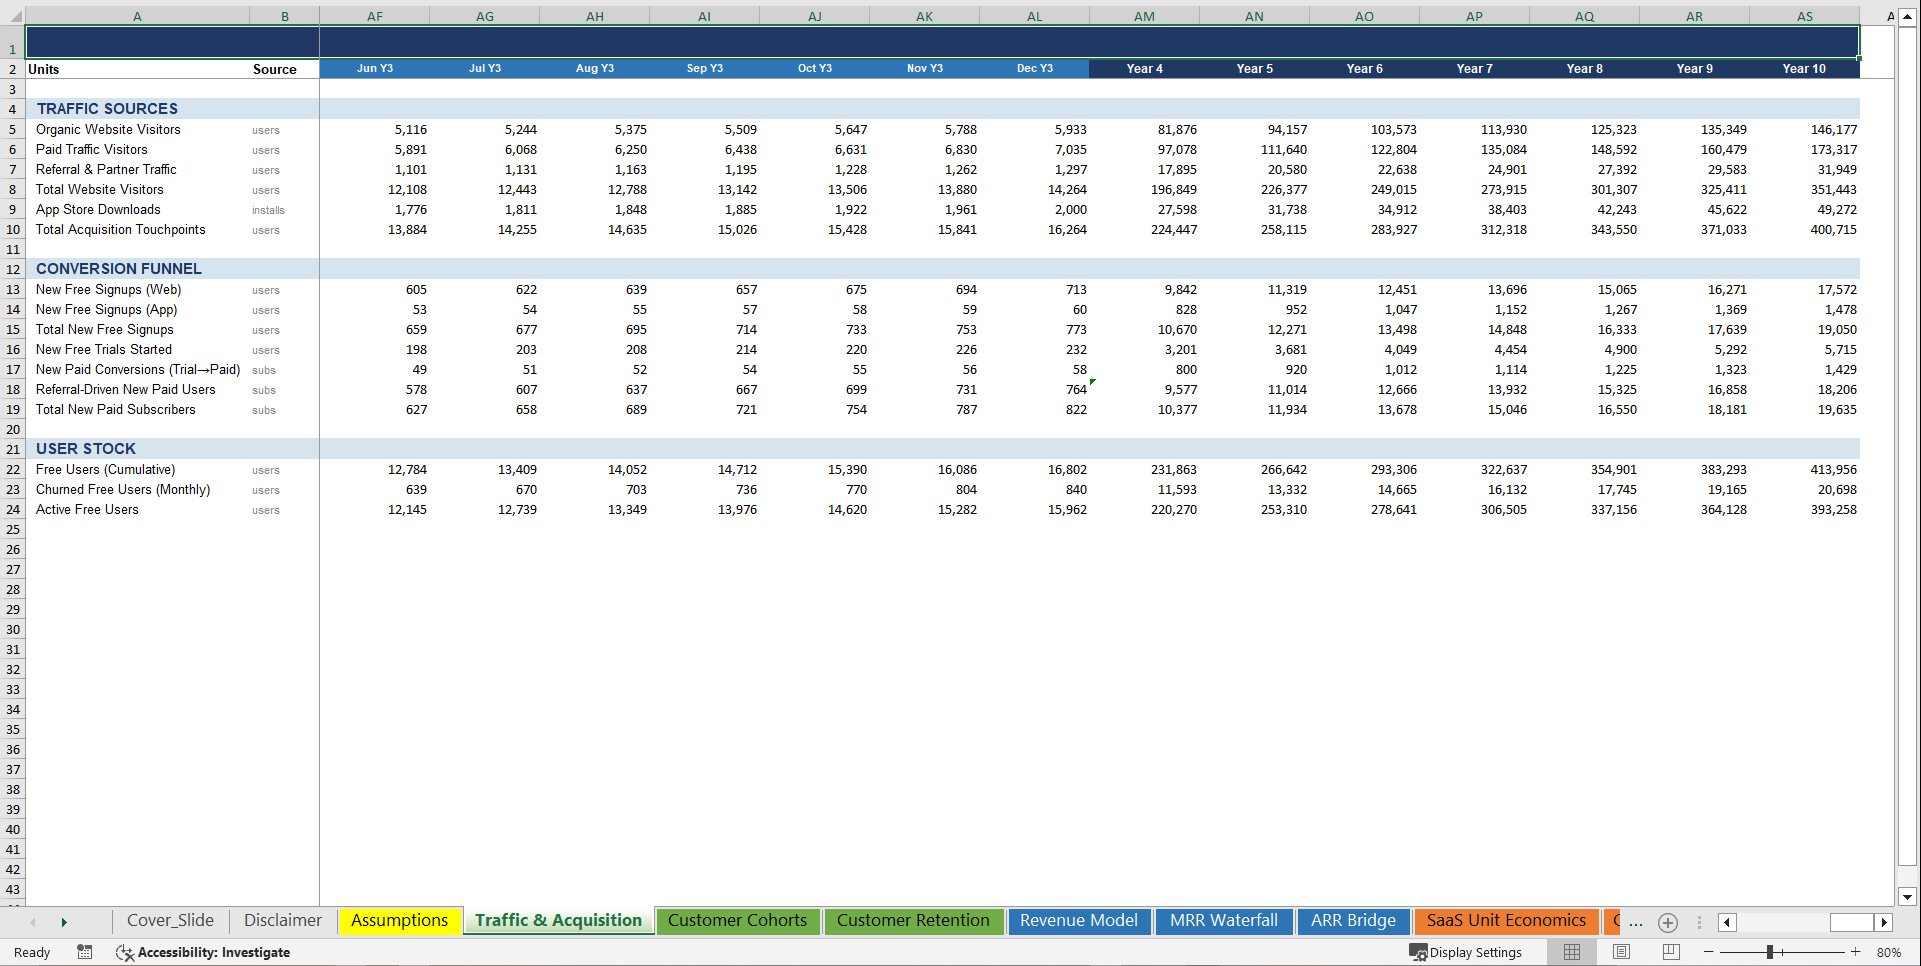
• Traffic & Acquisition Model – Active visitor and install counts built from organic growth, paid spend, referral mechanics, and app store discovery – fully formula-driven from Assumptions, with new paid subscriber conversions flowing directly into the Revenue Model
• Customer Cohorts – Cohort retention table tracking 12 months of post-acquisition behavior across 6 launch cohorts – the operational foundation for every churn and LTV calculation in the model
• Customer Retention Model – Monthly and annual churn rates, net and gross MRR retention, reactivation flows, and active subscriber reconciliation – fully integrated across all periods
• Revenue Model – All 5 revenue streams fully formula-driven from operational assumptions, with subscription tiers, add-ons, in-app purchases, advertising, and affiliate revenue all building up to Total Revenue
• MRR Waterfall – New, Expansion, Reactivation, Contraction, and Churned MRR reconciled to Ending MRR every period, with ARR and net MRR retention rate fully calculated
• ARR Bridge – Annual New ARR, Expansion ARR, Churned ARR, and Net New ARR – the exact bridge every SaaS investor maps to their growth quality scorecard
• SaaS Unit Economics – LTV, CAC, LTV/CAC ratio, CAC payback period, and revenue per employee – all driver-calculated and updating live
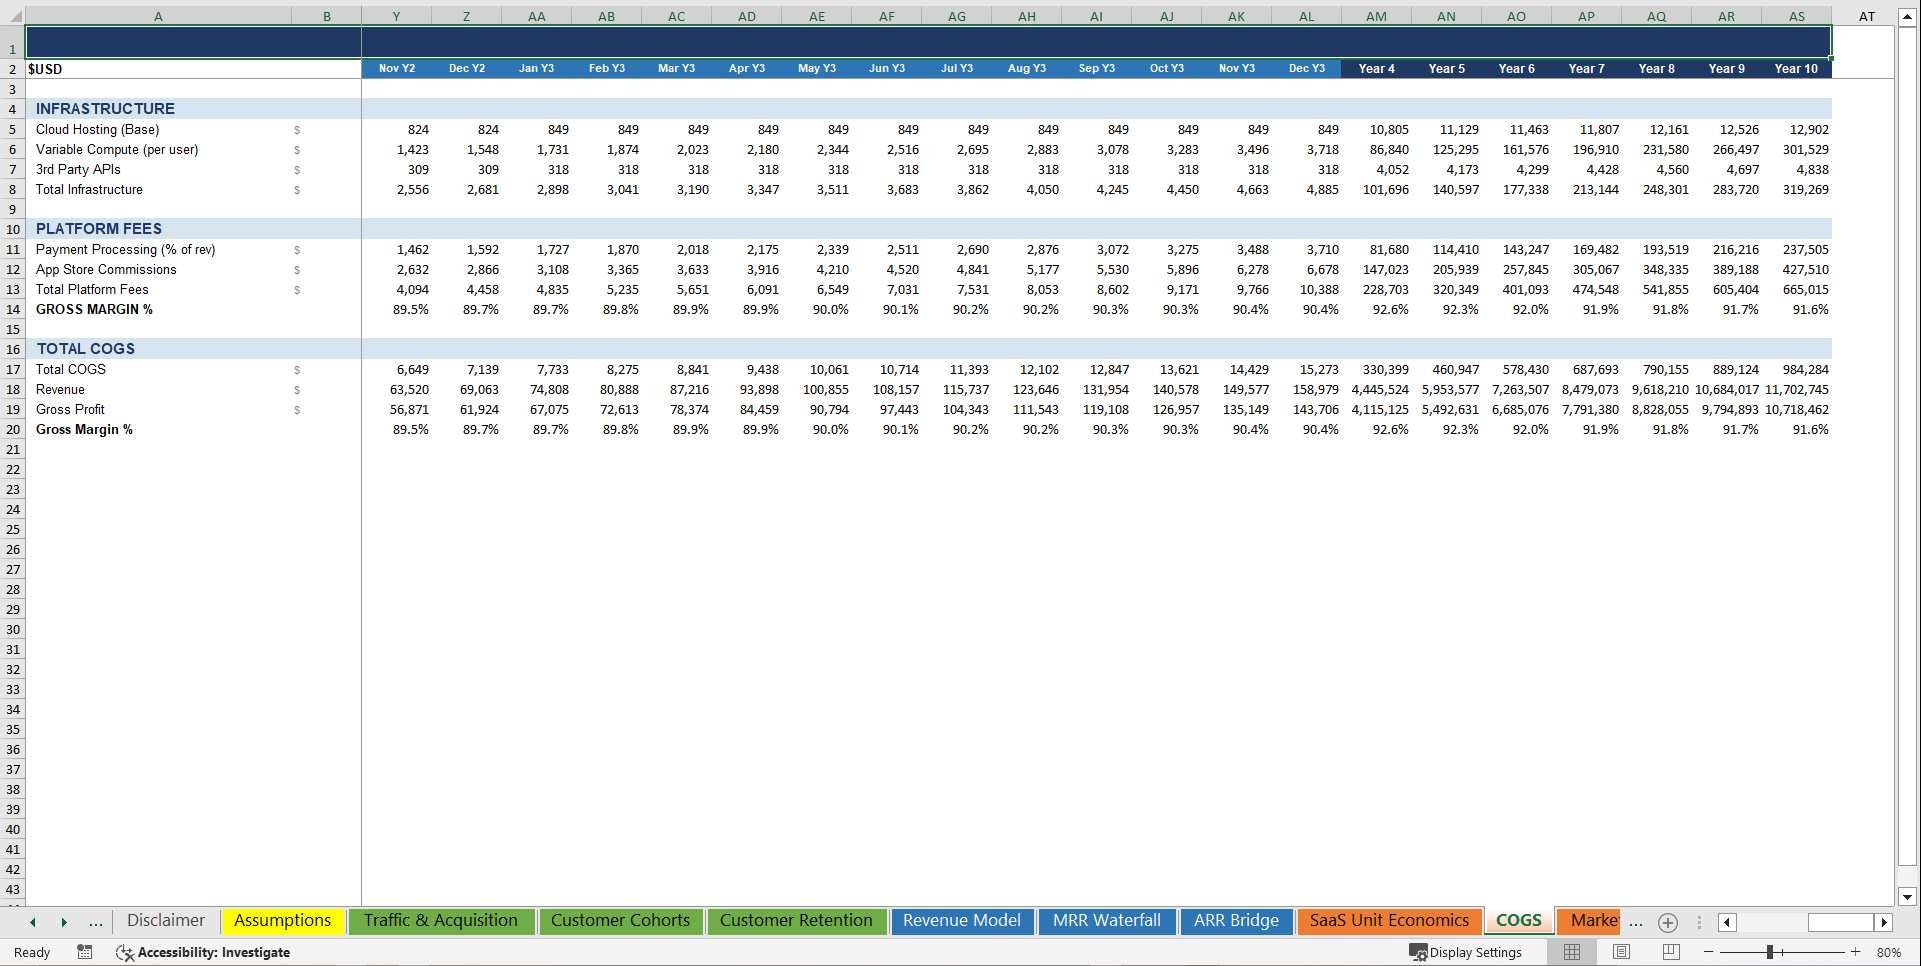
• COGS – Per-segment direct costs: cloud hosting, variable compute, payment processing fees, and app store commissions – with Gross Profit and Gross Margin output
• Marketing Spend Model – Paid search, social media, influencer, and affiliate budgets with annual growth rates, fully flowing into both the Income Statement and the CAC calculation
• Personnel Plan – All 20 roles across 4 departments with hiring timeline, salary × benefits × raise compounding, total FTE count, and total personnel cost across all 10 years
• CapEx Schedule – Software and equipment initial CapEx with straight-line depreciation by asset class, annual platform CapEx, accumulated depreciation, and Net PP&E by year
• Working Capital – AR, prepaid expenses, AP, accrued expenses, and deferred revenue with Net Working Capital and annual NWC change fully linked into the Cash Flow Statement
• Income Statement – Revenue → Gross Profit → EBITDA → EBIT → Pre-Tax Income → Net Income, with 5 revenue sub-lines, full operating expense detail, D&A, interest expense, and tax provision – with Gross Margin %, EBITDA Margin %, and Net Margin % for every year
• Balance Sheet – Current assets (Cash, AR, Prepaid), non-current assets (Net PP&E), current and non-current liabilities (AP, Accrued Expenses, Deferred Revenue, Debt), and Equity (Paid-in Capital + Retained Earnings) – with an auto-balancing check formula confirming Assets = Liabilities + Equity for every year
• Cash Flow Statement – Indirect method: Net Income → D&A add-back → Change in Working Capital → CapEx investing outflows → equity raises – with Beginning and Ending Cash fully linked to the Balance Sheet
• SaaS Metrics – 10-year KPI summary: Revenue, MRR, ARR, Active Subscribers, ARPU, Gross Margin, EBITDA, CAC, LTV, LTV/CAC, CAC Payback, Revenue per Employee, and Cash Balance – the complete metrics package any SaaS board or investor committee will ask for
• Sensitivity Analysis – Churn Rate × Subscription Price revenue matrix and Marketing Spend × Trial Conversion subscriber matrix – 50 instant scenario data points, color-coded for at-a-glance risk assessment
*"Most SaaS founders know their product inside out. The ones who close Series A rounds, attract growth equity, and build category-defining software businesses also know their numbers inside out. This model is how you close that gap – in an afternoon, not a quarter."*
Key Words:
Strategy & Transformation, Growth Strategy, Strategic Planning, Strategy Frameworks, Innovation Management, Pricing Strategy, Core Competencies, Strategy Development, Business Transformation, Marketing Plan Development, Product Strategy, Breakout Strategy, Competitive Advantage, Mission, Vision, Values, Strategy Deployment & Execution, Innovation, Vision Statement, Core Competencies Analysis, Corporate Strategy, Product Launch Strategy, BMI, Blue Ocean Strategy, Breakthrough Strategy, Business Model Innovation, Business Strategy Example, Corporate Transformation, Critical Success Factors, Customer Segmentation, Customer Value Proposition, Distinctive Capabilities, Enterprise Performance Management, KPI, Key Performance Indicators, Market Analysis, Market Entry Example, Market Entry Plan, Market Intelligence, Market Research, Market Segmentation, Market Sizing, Marketing, Michael Porter's Value Chain, Organizational Transformation, Performance Management, Performance Measurement, Platform Strategy, Product Go-to-Market Strategy, Reorganization, Restructuring, SWOT, SWOT Analysis, Service 4.0, Service Strategy, Service Transformation, Strategic Analysis, Strategic Plan Example, Strategy Deployment, Strategy Execution, Strategy Frameworks Compilation, Strategy Methodologies, Strategy Report Example, Value Chain, Value Chain Analysis, Value Innovation, Value Proposition, Vision Statement, Corporate Strategy, Business Development, Business plan pdf, business plan, PDF, Business Plan DOC, Business Plan Template, PPT, Market strategy playbook, strategic market planning, competitive analysis tools, market segmentation frameworks, growth strategy templates, product positioning strategy, market execution toolkit, strategic alignment playbook, KPI and OKR frameworks, business growth strategy guide, cross-functional strategy templates, market risk management, market strategy PowerPoint doc, guide, ebook, e-book ,McKinsey Change Playbook, Organizational change management toolkit, Change management frameworks 2025, Influence model for change, Change leadership strategies, Behavioral change in organizations, Change management PowerPoint templates, Transformational leadership in change, supply chain KPIs, supply chain KPI toolkit, supply chain PowerPoint template, logistics KPIs, procurement KPIs, inventory management KPIs, supply chain performance metrics, manufacturing KPIs, supply chain dashboard, supply chain strategy KPIs, reverse logistics KPIs, sustainability KPIs in supply chain, financial supply chain KPIs, warehouse KPIs, digital supply chain KPIs, 1200 KPIs, supply chain scorecard, KPI examples, supply chain templates, Corporate Finance SOPs, Finance SOP Excel Template, CFO Toolkit, Finance Department Procedures, Financial Planning SOPs, Treasury SOPs, Accounts Payable SOPs, Accounts Receivable SOPs, General Ledger SOPs, Accounting Policies Template, Internal Controls SOPs, Finance Process Standardization, Finance Operating Procedures, Finance Department Excel Template, FP&A Process Documentation, Corporate Finance Template, Finance SOP Toolkit, CFO Process Templates, Accounting SOP Package, Tax Compliance SOPs, Financial Risk Management Procedures.
NOTE: Our digital products are sold on an "as is" basis, making returns and refunds unavailable post-download. Please preview and inquire before purchasing. Please contact us before purchasing if you have any questions! This policy aligns with the standard Flevy Terms of Usage.
Got a question about the product? Email us at support@flevy.com or ask the author directly by using the "Ask the Author a Question" form. If you cannot view the preview above this document description, go here to view the large preview instead.
Source: Best Practices in SaaS, Integrated Financial Model Excel: Subscription-Based B2C SaaS 10-Year Financial Model Excel (XLSX) Spreadsheet, SB Consulting
ABOUT THE AUTHOR
SB Consulting is dedicated to empowering businesses to communicate their ideas with impact. This consulting firm specializes in teaching organizations how to create effective corporate and management presentations. With training from top-tier global consulting firms, including McKinsey, BCG, and Porsche Consulting, extensive expertise in presentation design and ... [read more]
Ask the Author a Question
You must be logged in to contact the author.
