
 Click main image to view in full screen. Unlock all 9 preview images:
Startup Financial Model: SaaS Metrics and DCF Valuation Dashboard – Excel XLSX
Excel (XLSX) + Excel (XLSX)


BENEFITS OF THIS DOWNLOADABLE EXCEL DOCUMENT
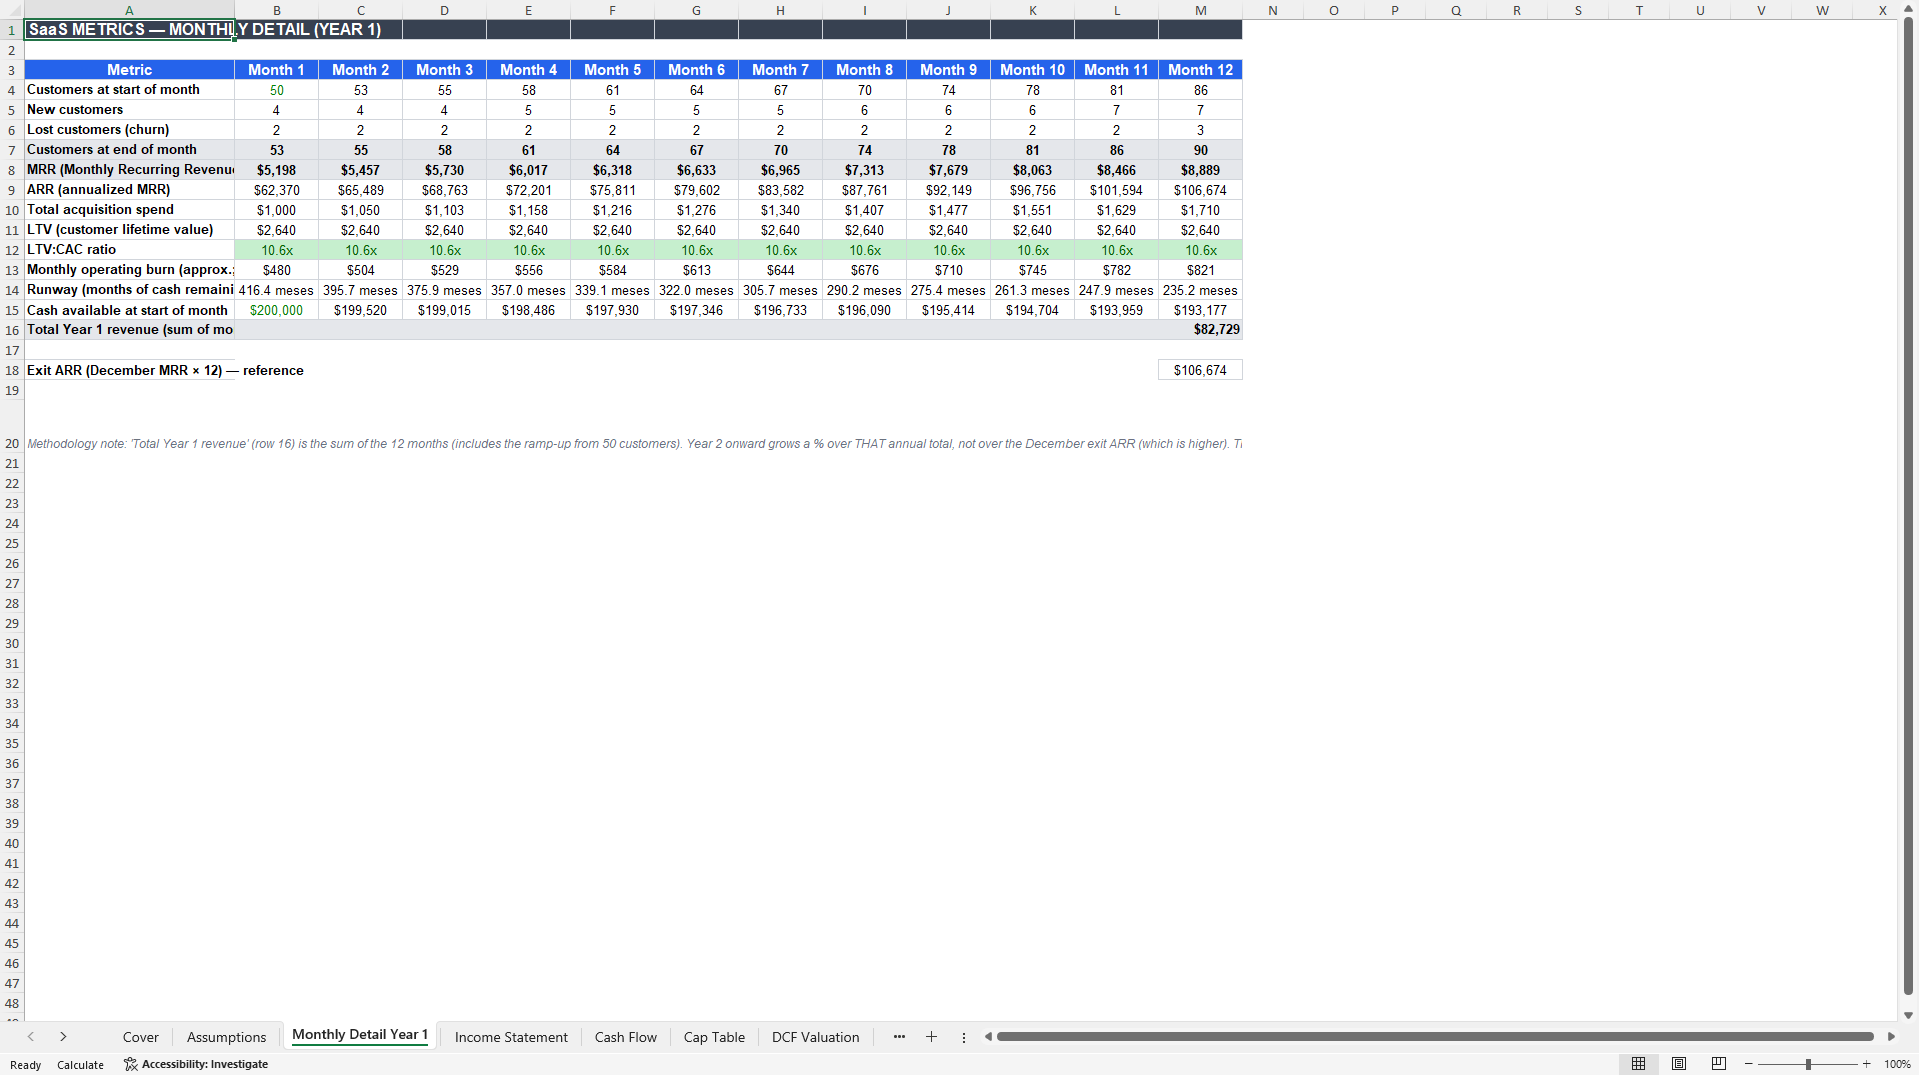
- Builds MRR, ARR, CAC, LTV, burn rate, and runway automatically from Year 1 monthly inputs.
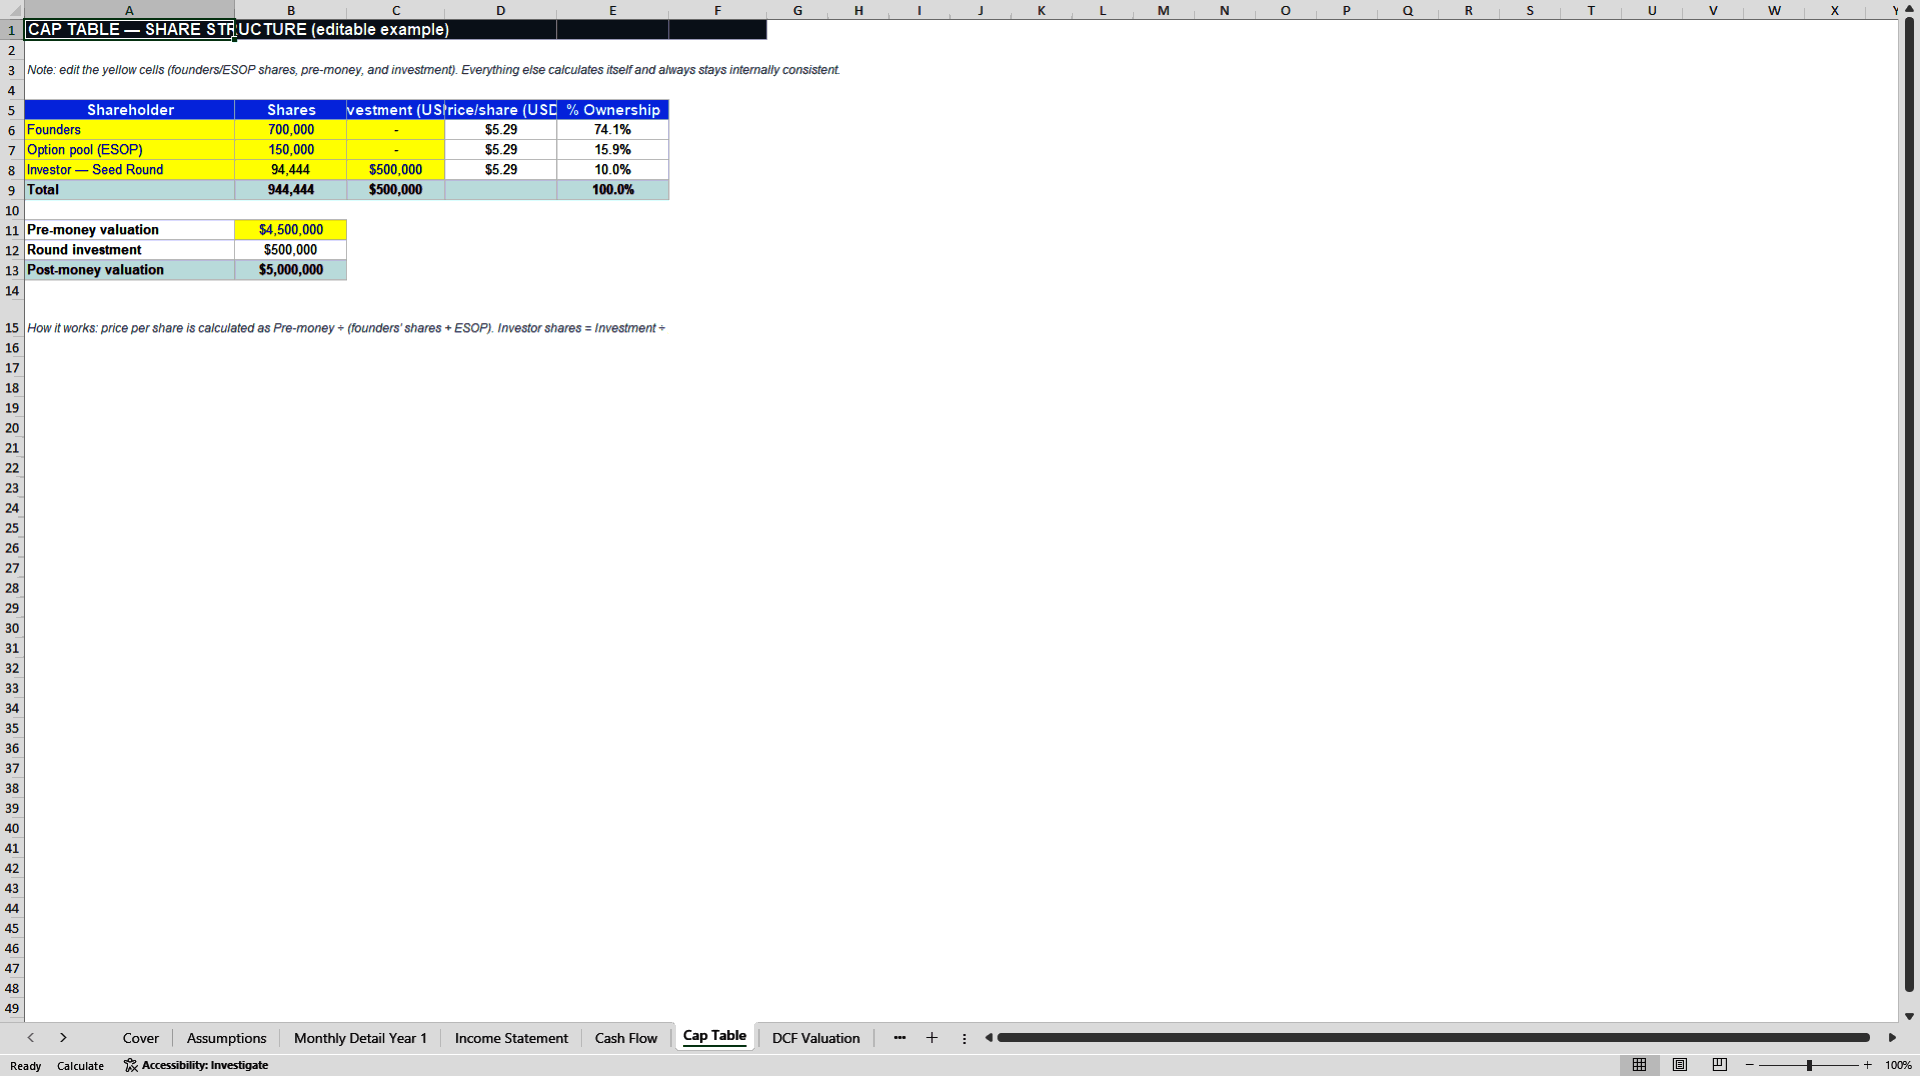
- Uses a self-consistent cap table where price per share and dilution recalculate from pre-money valuation and investment amount.
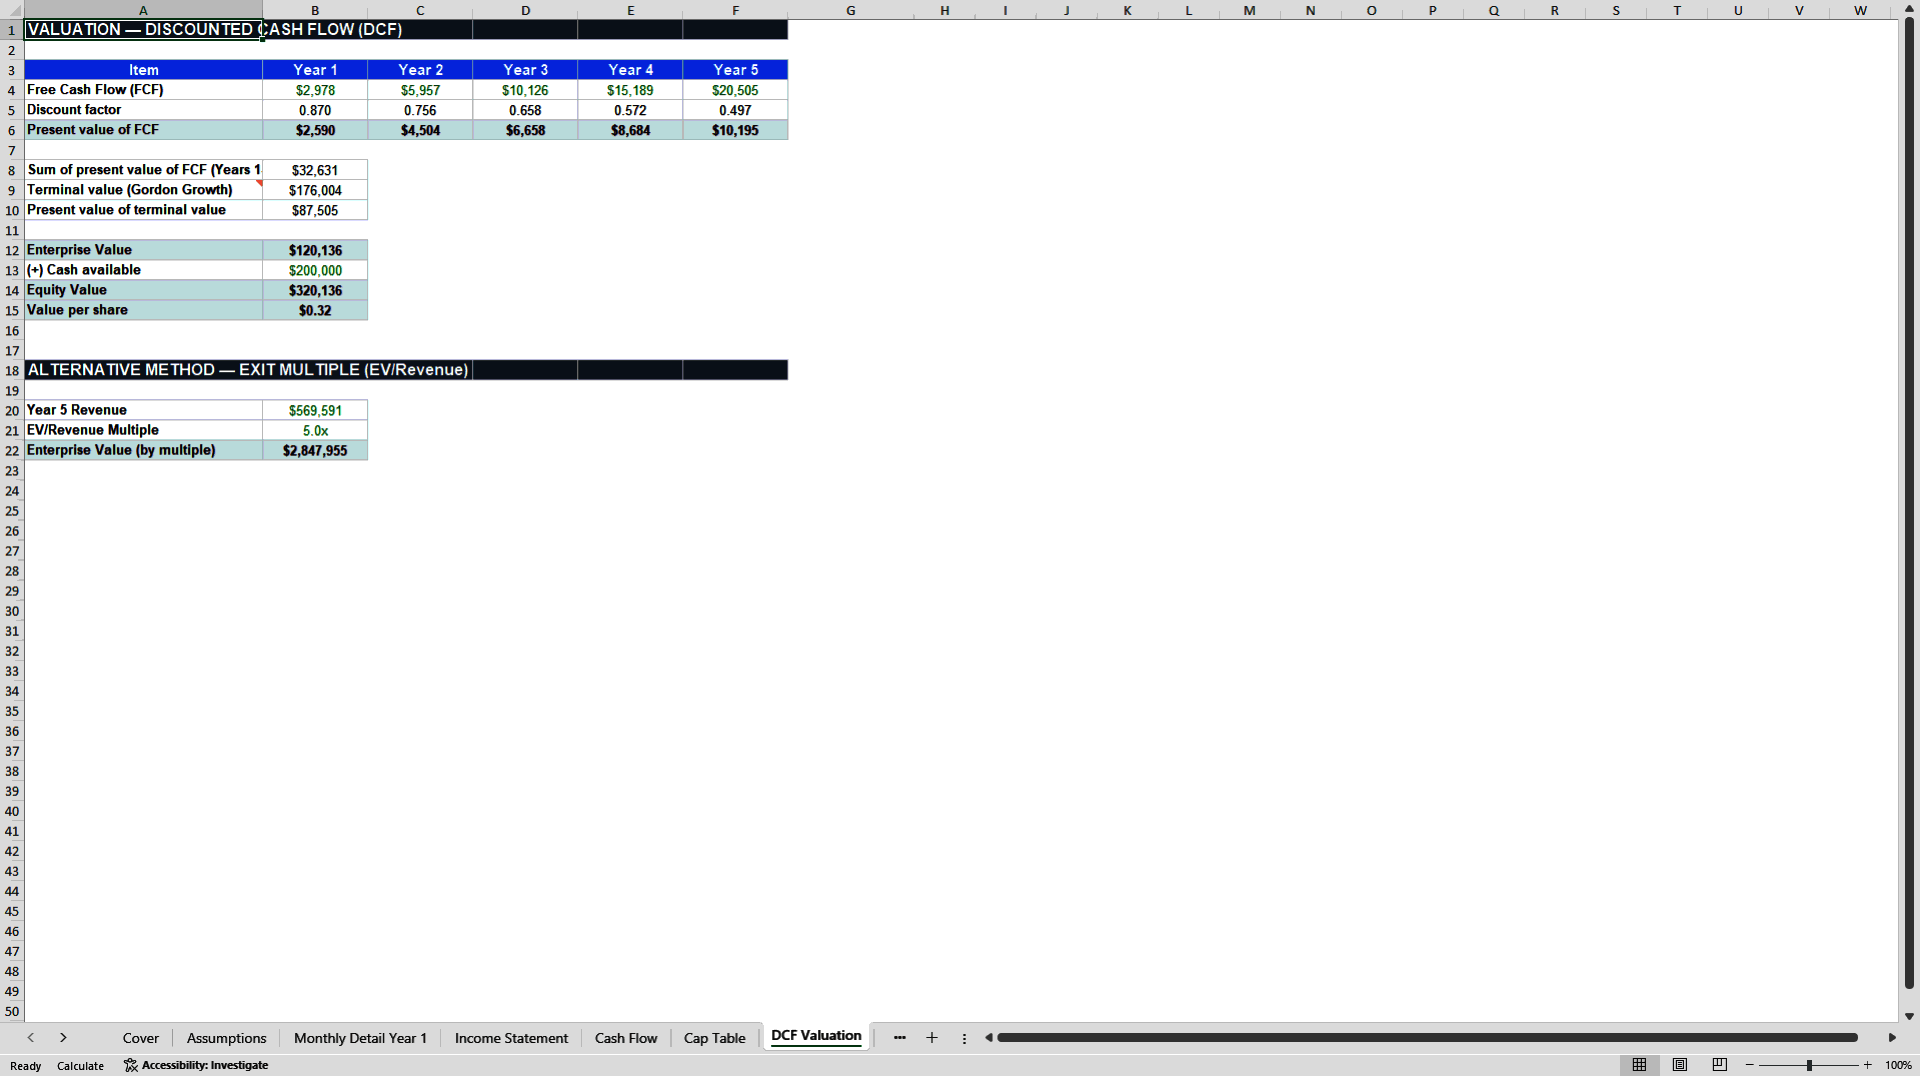
- Values the company with two independent methods -- discounted cash flow and exit multiple -- plus a built-in sensitivity table.
FINANCIAL MODELING EXCEL DESCRIPTION
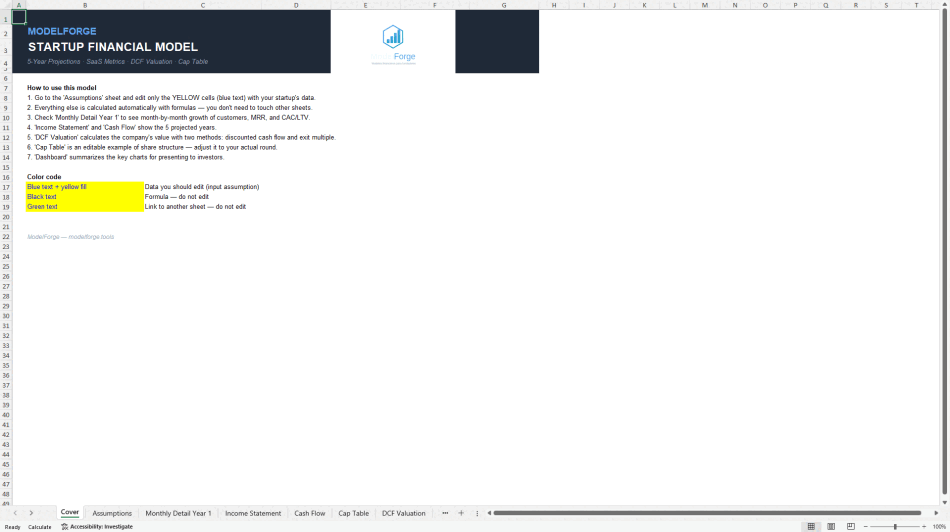
Founders raising capital are routinely asked for a financial model before the first serious investor conversation happens – yet most early-stage companies either have no model at all, or one built ad hoc that breaks the moment an assumption changes. This template replicates the structure venture investors and financial analysts expect to see, built entirely from linked formulas so the full five-year picture updates automatically as inputs change.
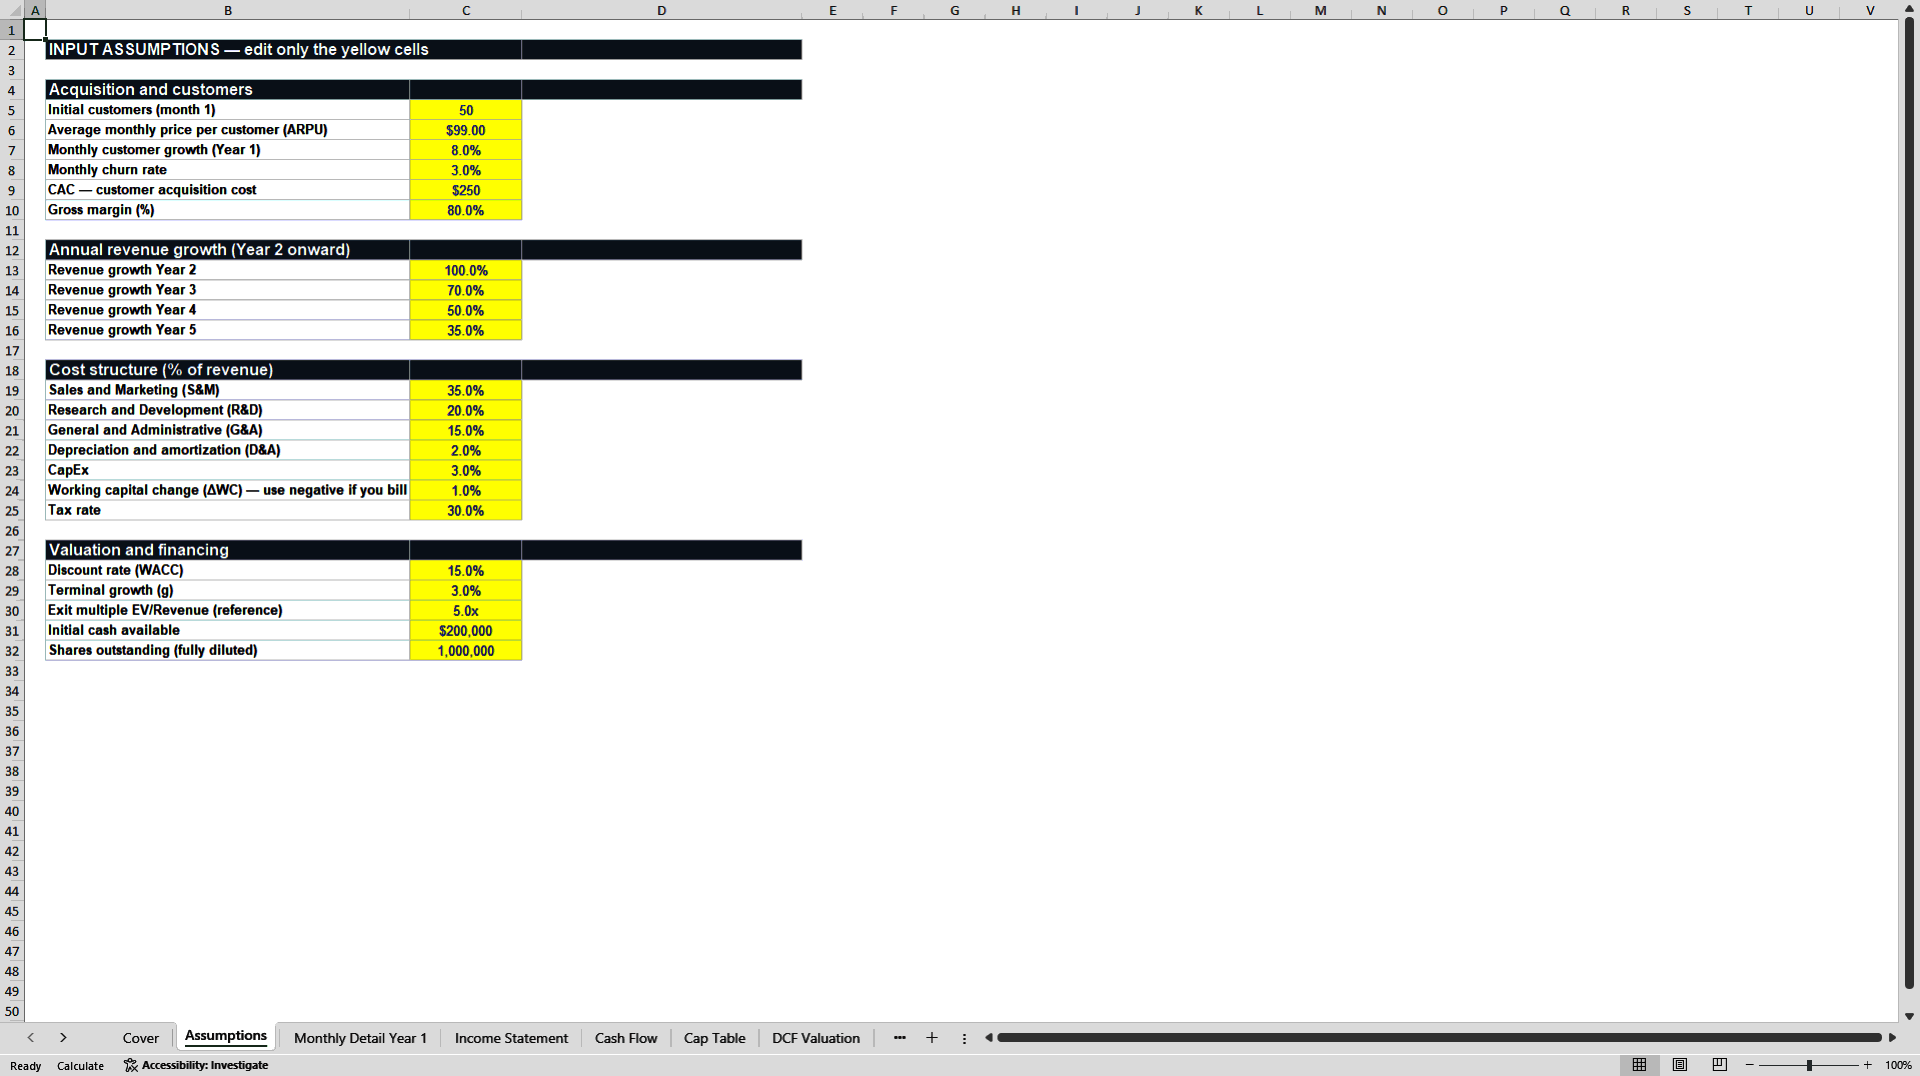
The model opens with an Assumptions worksheet consolidating every input: initial customers, pricing, monthly growth and churn, customer acquisition cost, gross margin, cost structure, and valuation parameters. A dedicated Monthly Detail worksheet builds Year 1 bottom-up, calculating MRR, ARR, CAC, LTV, the LTV:CAC ratio, monthly operating burn, and cash runway – the core SaaS metrics investors screen for before reading anything else.
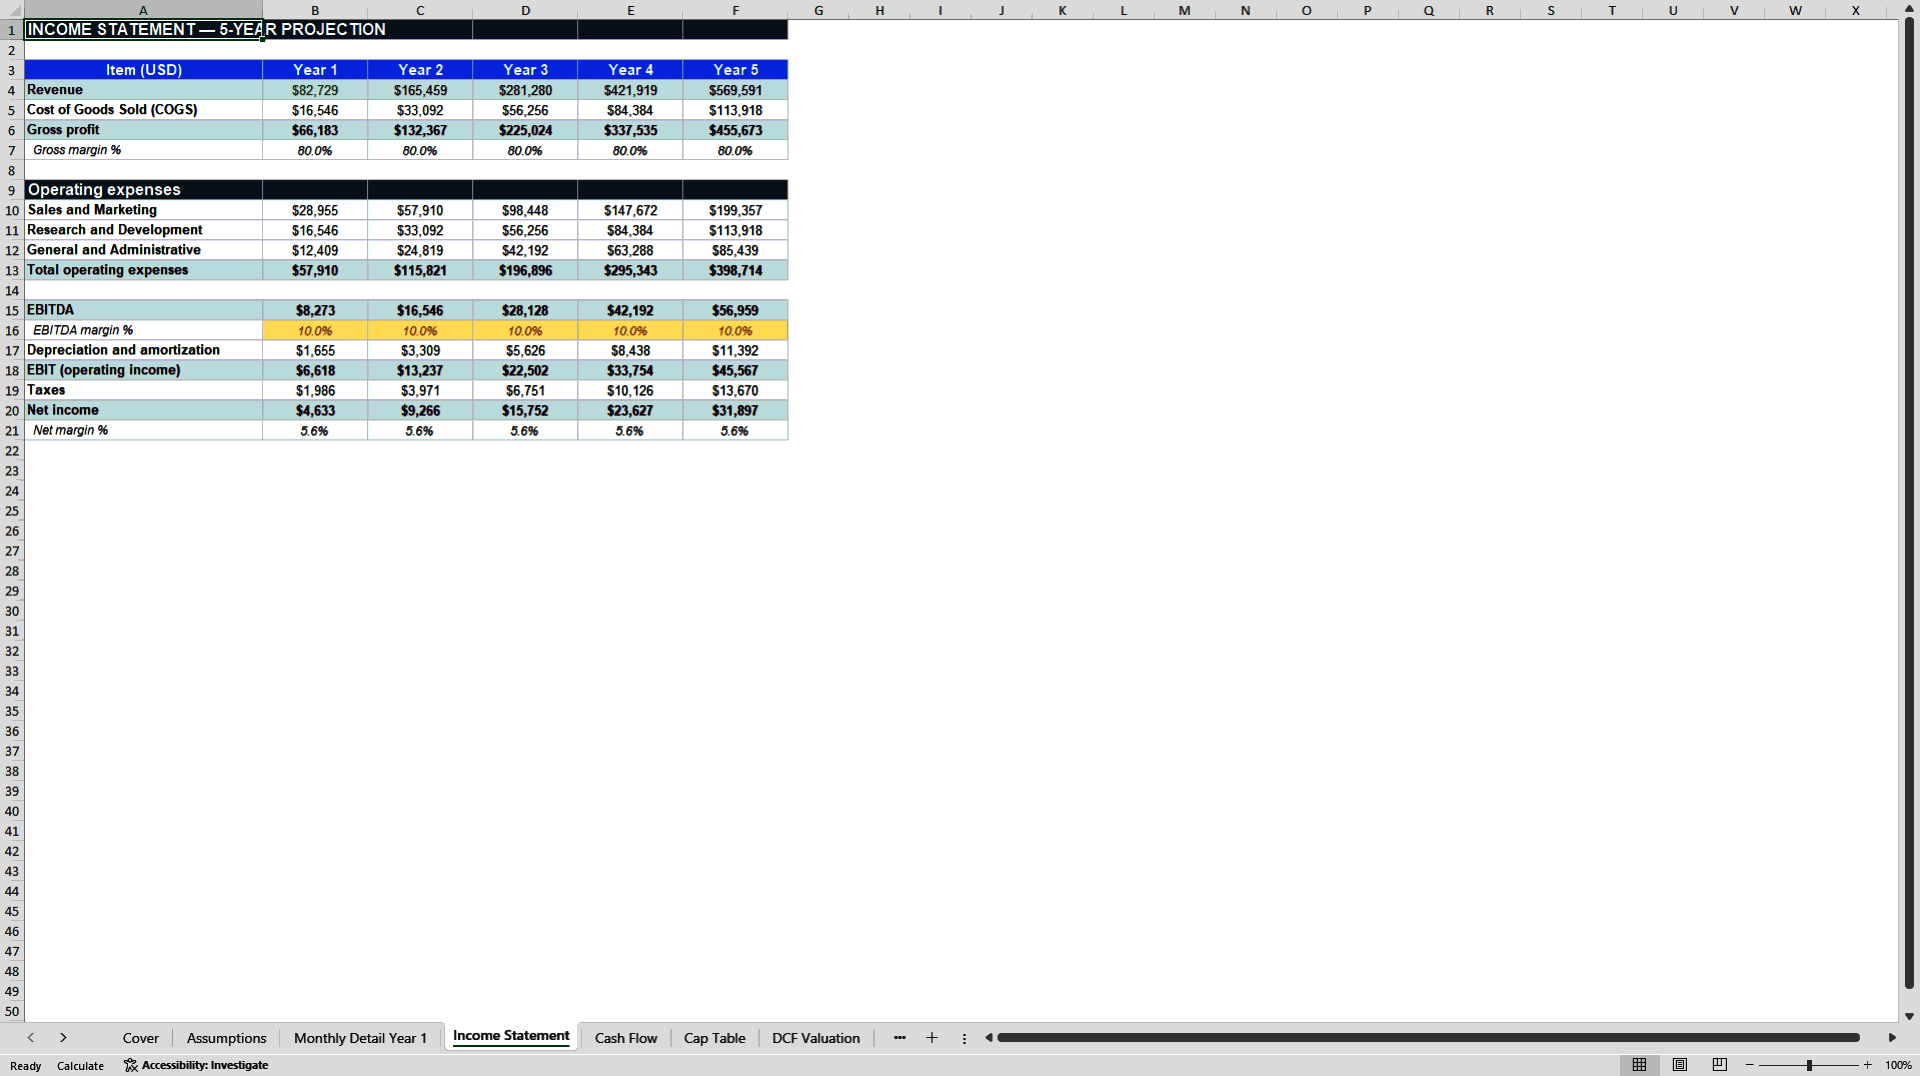
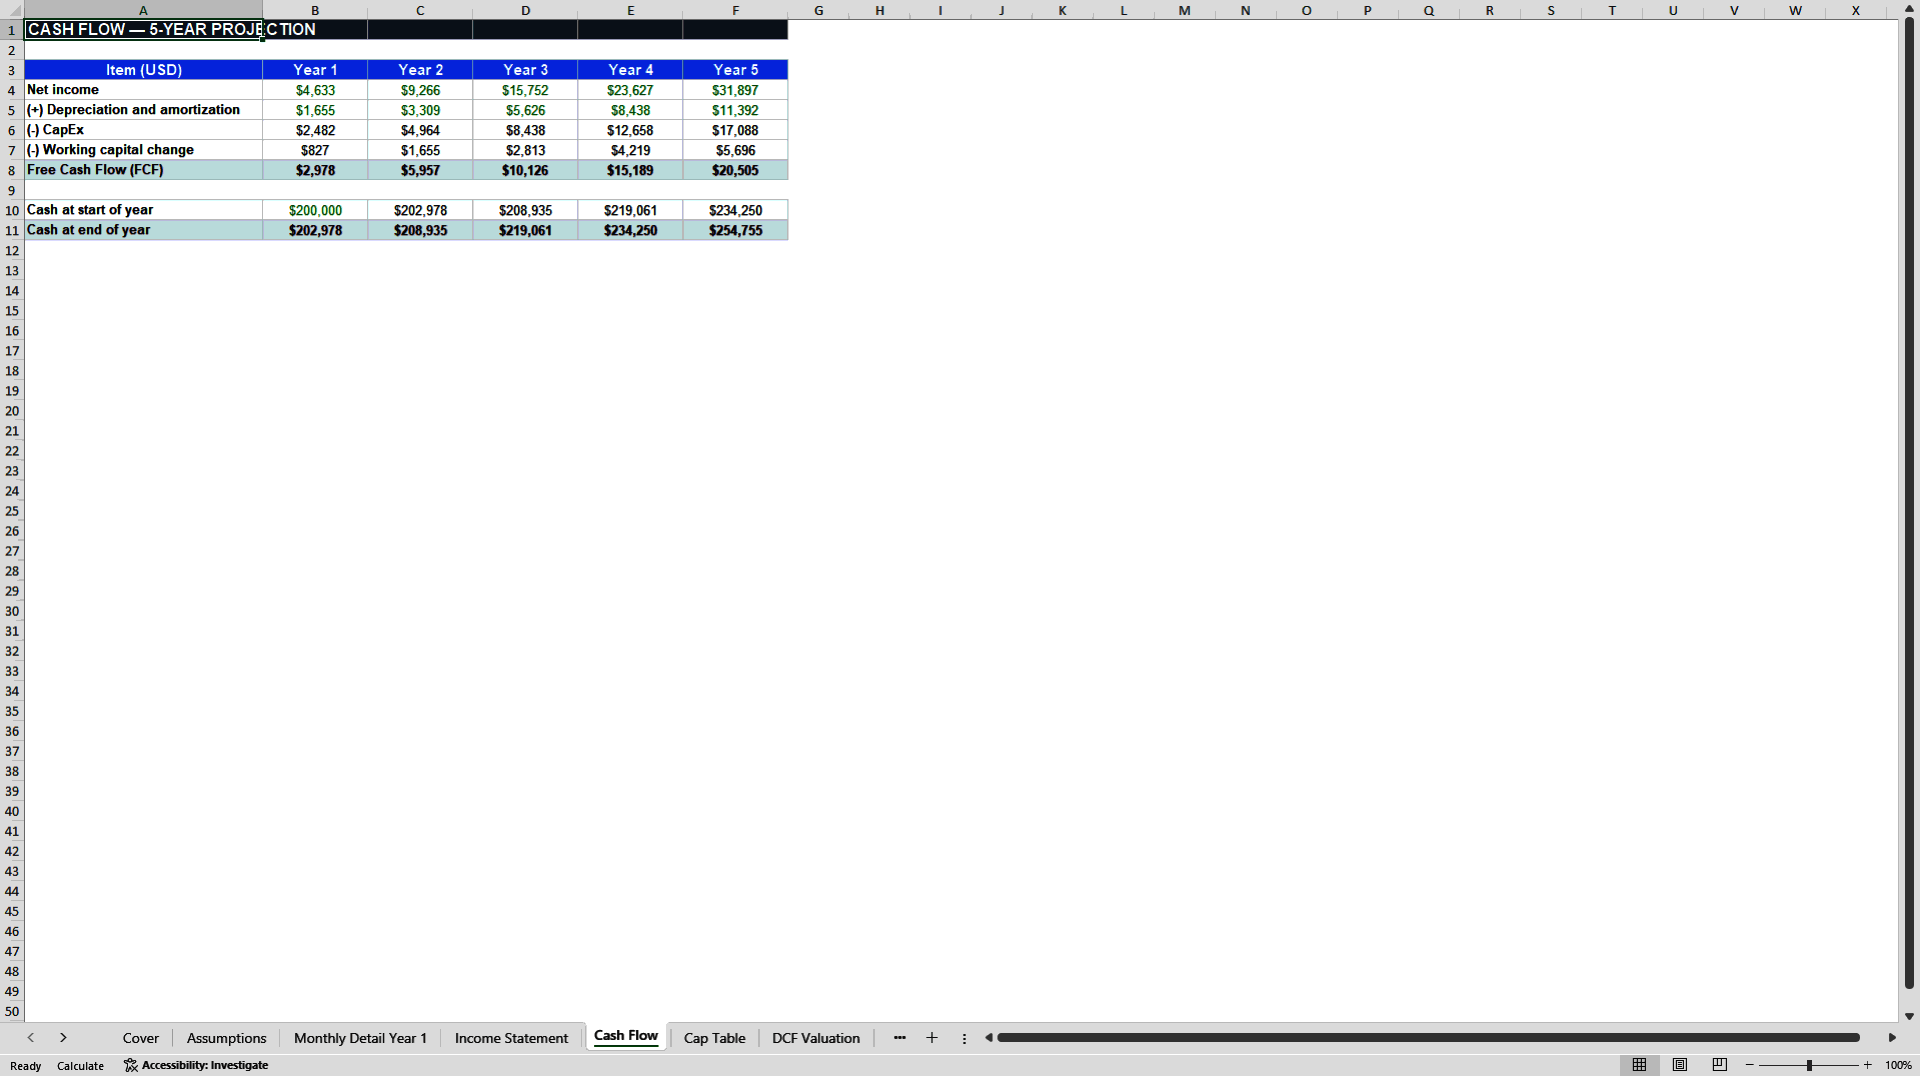
From there, the Income Statement and Cash Flow worksheets project five full years, growing off the Year 1 base at investor-supplied annual rates. The Cap Table worksheet is built to be internally self-consistent: price per share, investor ownership, and dilution are all derived from the pre-money valuation and investment amount, rather than entered manually as static numbers – eliminating the reconciliation errors common in manually-built cap tables.
The Valuation worksheet applies two independent methods side by side: a discounted cash flow analysis with a Gordon Growth terminal value, and a comparable exit multiple based on revenue, so the founder is not relying on a single valuation approach. A dedicated Sensitivity worksheet then stress-tests the resulting equity value across a five-by-five grid of discount rate (WACC) and terminal growth assumptions, immediately showing how exposed the valuation is to those two inputs.
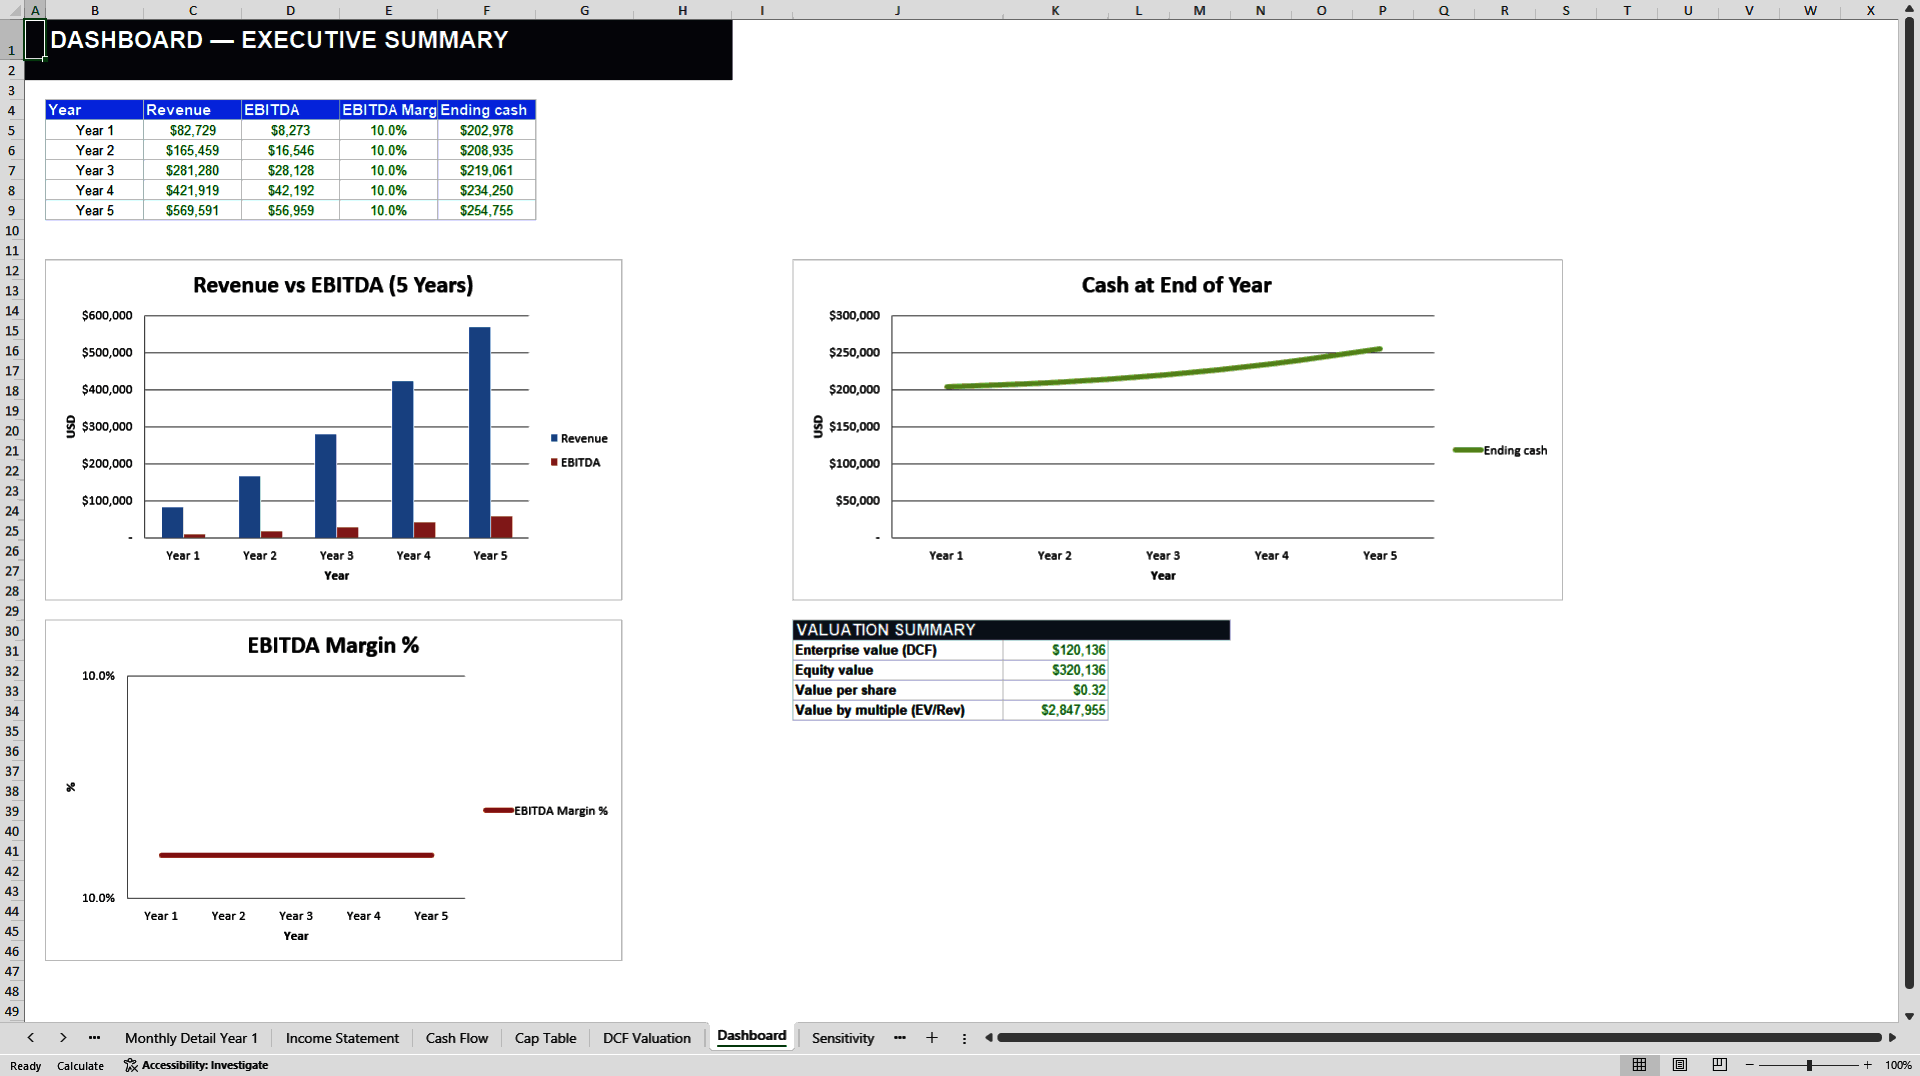
An Executive Dashboard summarizes the full projection – revenue, EBITDA, margin trends, and valuation – in a format suitable for a board update or investor deck appendix.
All formula cells are protected against accidental edits, while input cells remain fully editable and color-coded. The workbook is provided in both English and Spanish, is compatible with Excel 2016 and later as well as Google Sheets, and contains no macros, external links, or embedded data of any kind.
Got a question about the product? Email us at support@flevy.com or ask the author directly by using the "Ask the Author a Question" form. If you cannot view the preview above this document description, go here to view the large preview instead.
Source: Best Practices in Financial Modeling, SaaS Excel: Startup Financial Model: SaaS Metrics and DCF Valuation Excel (XLSX) Spreadsheet, g62881025e97




























