

 Click main image to view in full screen.
SaaS Financial Model, 36 Months – Excel XLSX
Excel (XLSX)


BENEFITS OF THIS DOWNLOADABLE EXCEL DOCUMENT
- Builds MRR from new, expansion, contraction and churn month by month for three years.
- Reports CAC, LTV, payback, burn and runway from the same inputs.
- Shows the break-even month and the cash low point before you raise.
FINANCIAL MODELING EXCEL DESCRIPTION
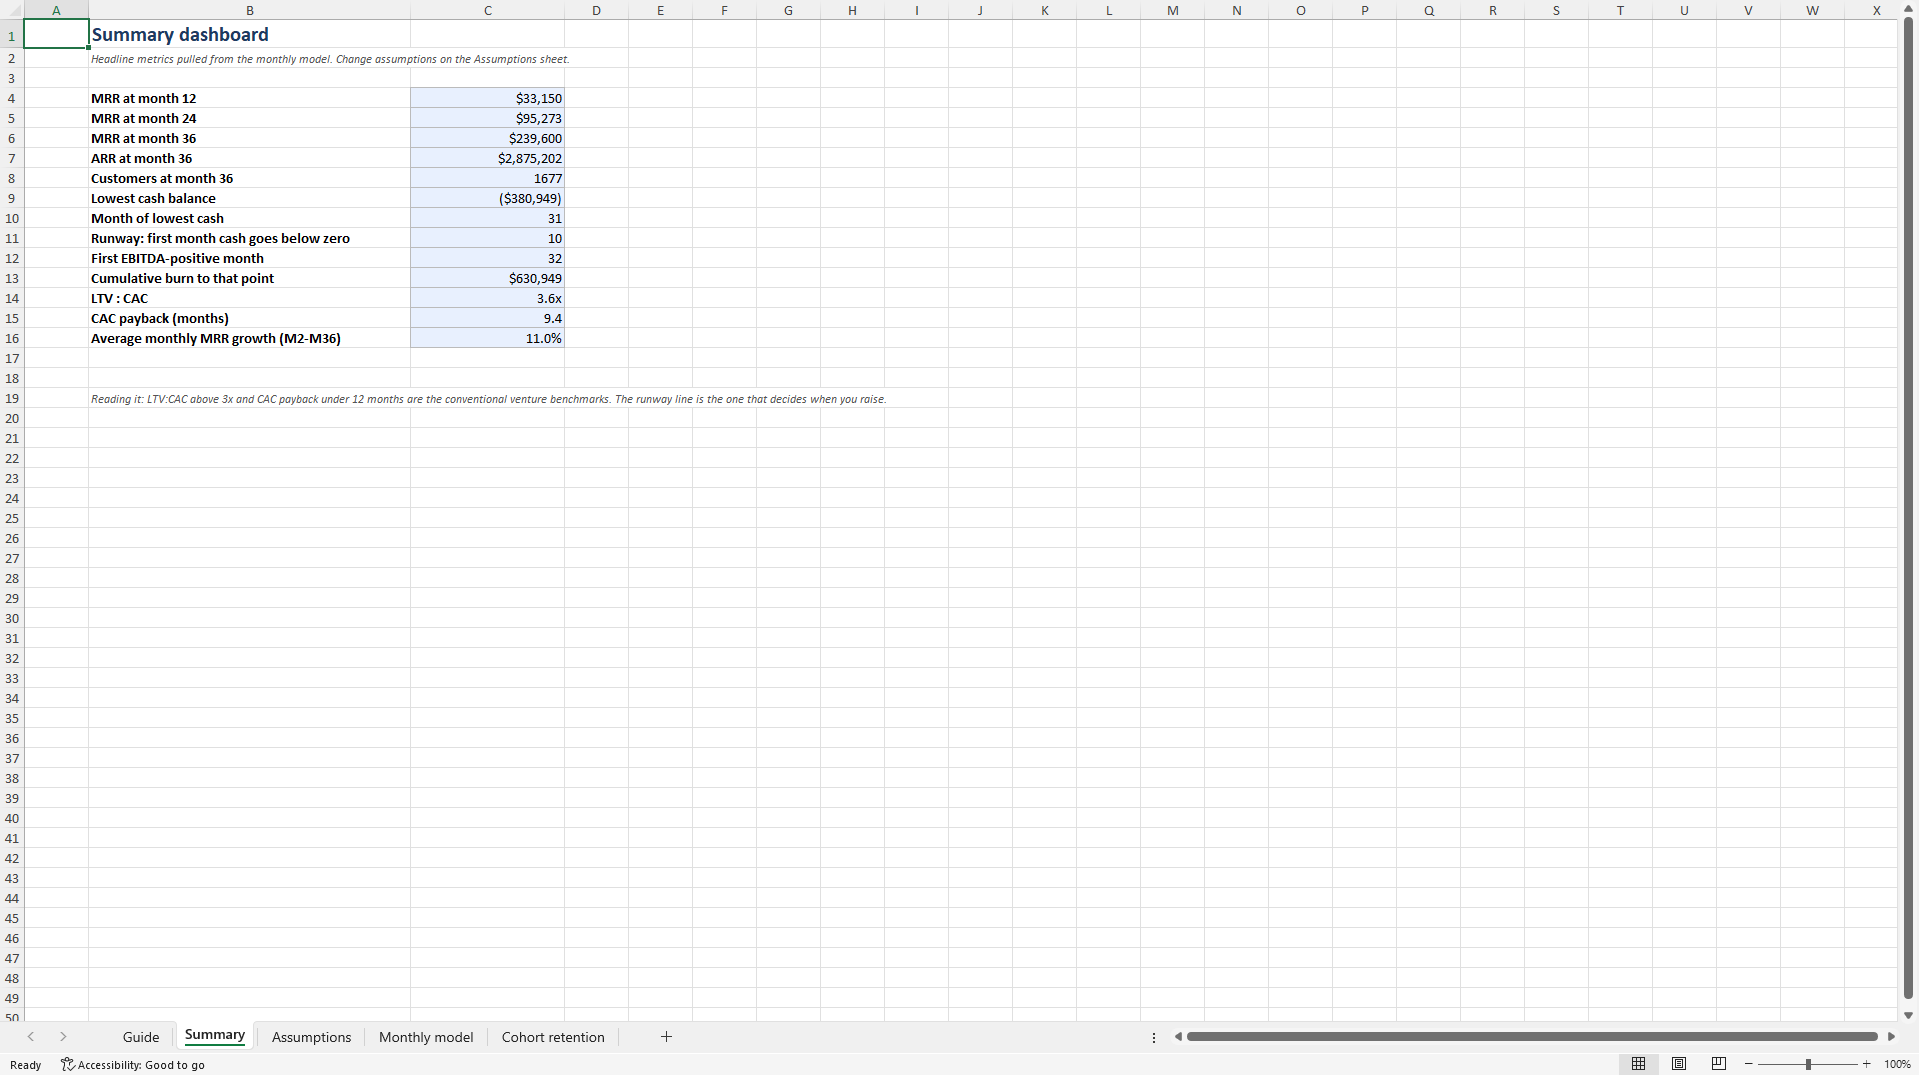
Thirty-six months, one assumption sheet, and a summary that answers the questions a seed investor actually asks: MRR at 12, 24 and 36 months, runway, the month EBITDA turns positive, cumulative burn to get there, LTV:CAC and CAC payback.
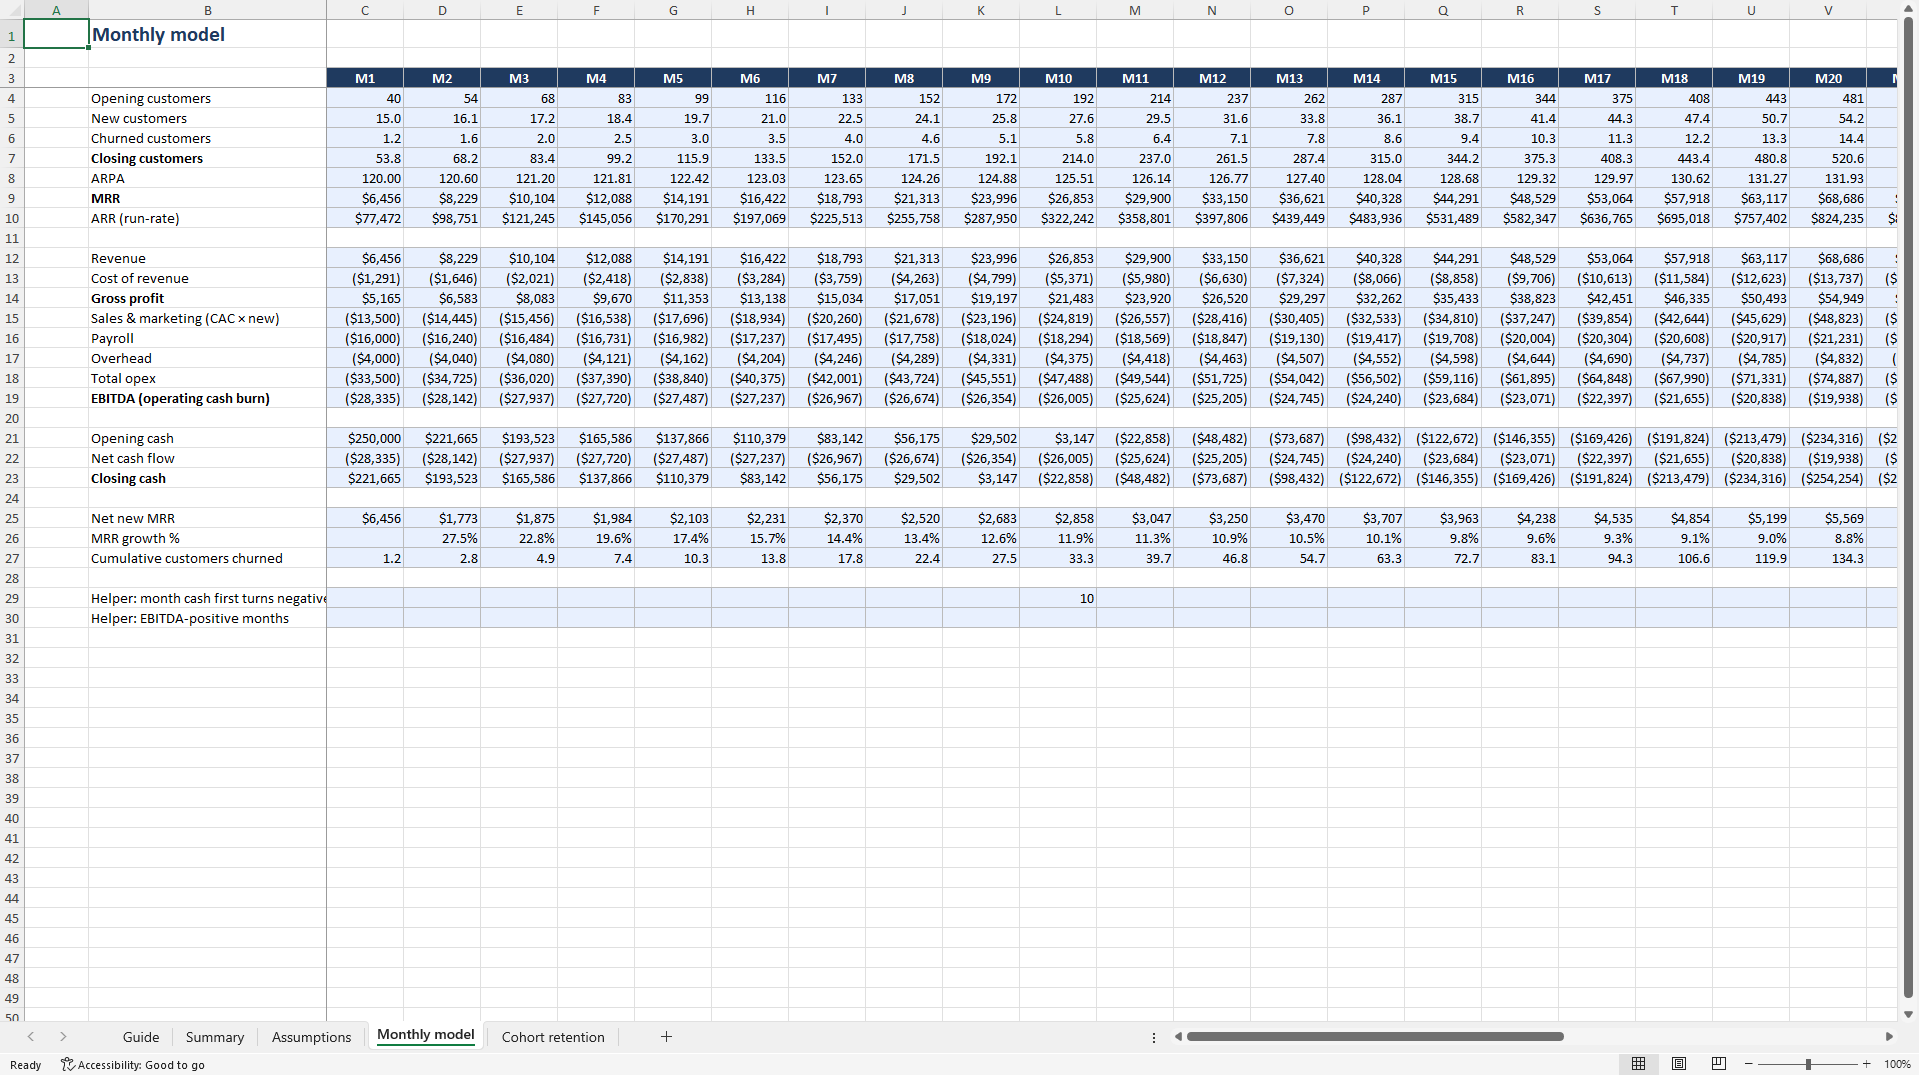
Customer build: opening, new, churned, closing, with growth in new adds.
MRR from customers times ARPA, with ARPA expansion.
Cash from gross profit less sales and marketing (CAC times new customers), payroll and overhead, each with its own growth rate.
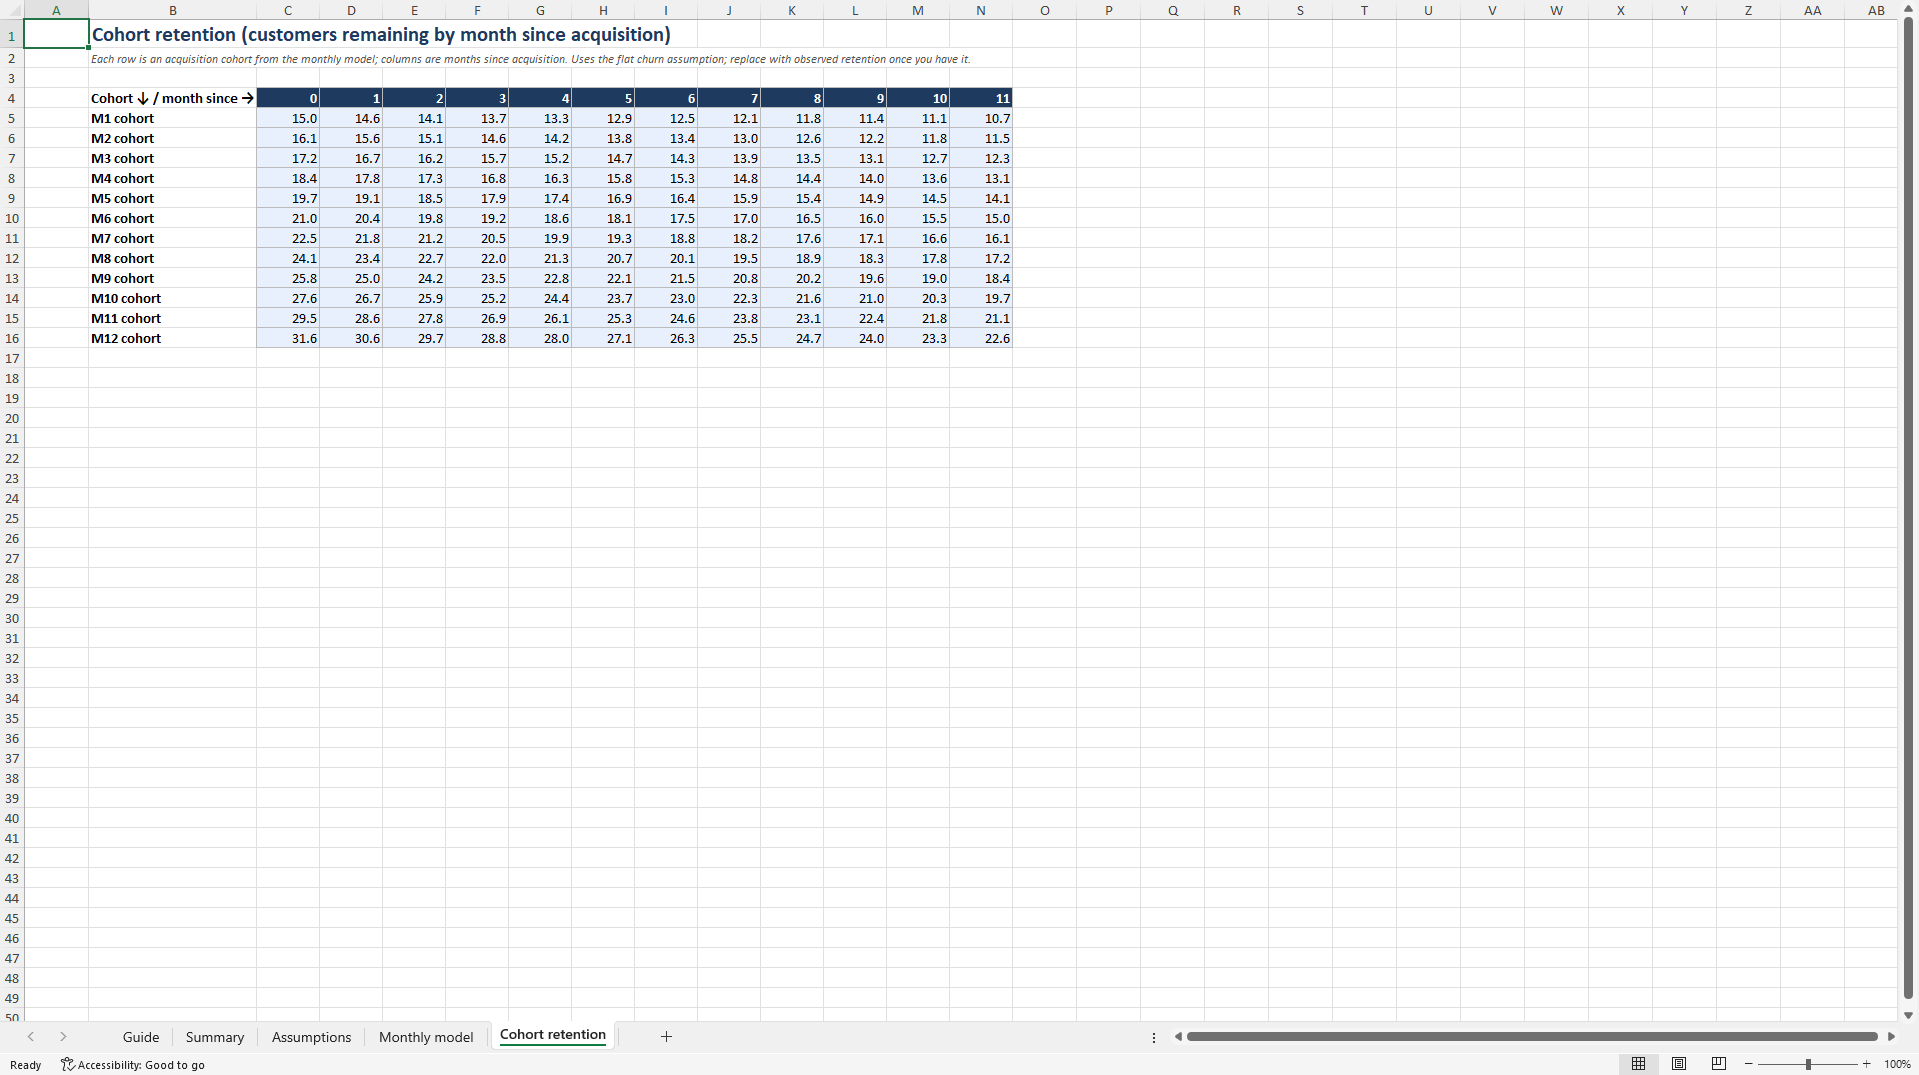
Cohort retention sheet shows what your churn assumption implies for each monthly cohort; paste real data over it when you have it.
Runway and breakeven computed with explicit helper rows, not fragile array tricks, so they work in Excel and Google Sheets alike.
The default assumptions show a company that needs to raise: runway ten months, breakeven at month 32. That is the honest use of a model like this. No macros, no locked cells.
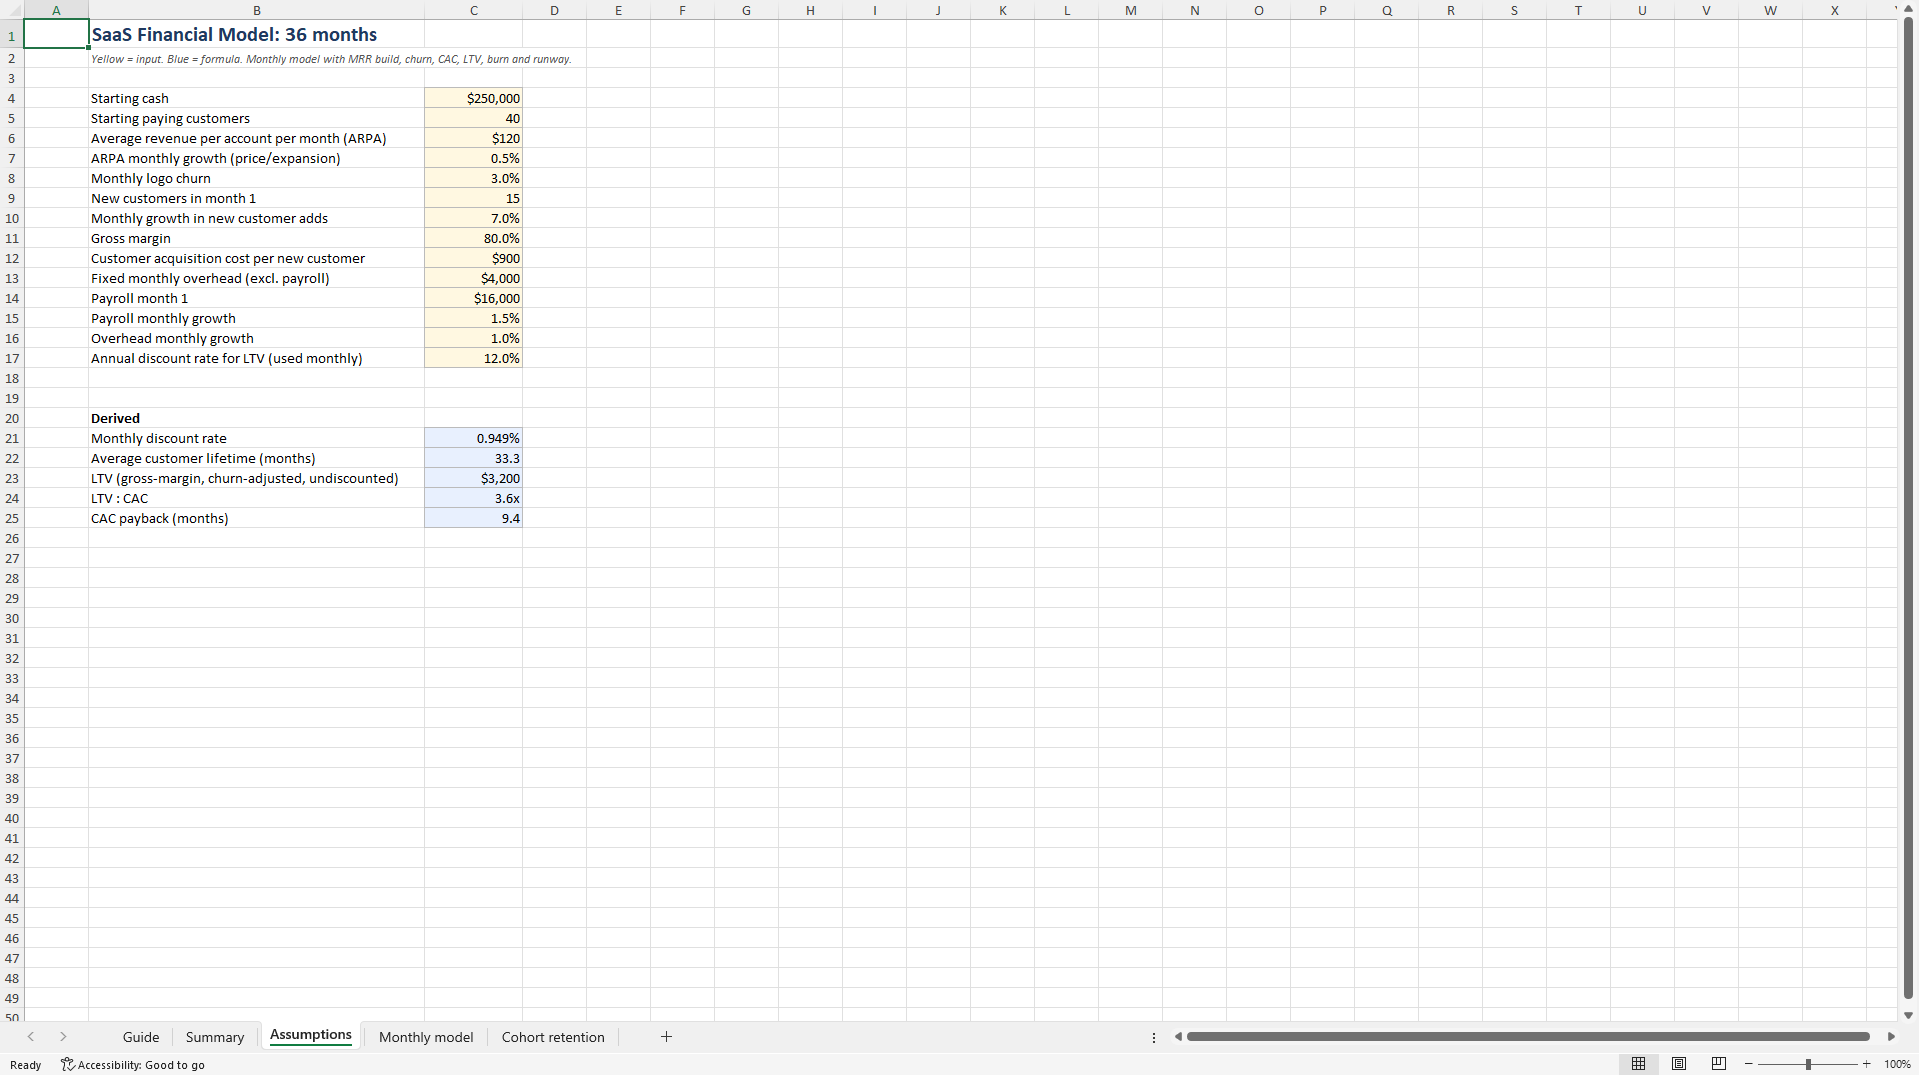
Who it is for: founders preparing a seed or Series A deck, and finance hires building the first proper model. The monthly build runs 36 months from a handful of yellow inputs (new customers, ARPA and expansion, churn, CAC, payroll and overhead) and produces MRR, gross profit, burn, cash and runway, LTV:CAC and CAC payback, with the breakeven month found automatically. A cohort retention view shows how churn compounds. Every number is a live formula you can trace back to its input, so an investor can audit the logic in the sheet itself.
How to work with it. Open the workbook in Excel or Google Sheets. Yellow cells are inputs, blue cells are formulas. Start with the Guide sheet, which walks through the sheets in the order they are meant to be used, then replace the example values with your own data. Every figure traces through live formulas to the inputs and to the cited source, so an auditor, lender or client can follow the working.
Use it if: You run or advise a subscription business and need a 36-month plan from a handful of inputs.
Not suited if: You need a usage-based or hardware revenue model; the build is subscription-based.
Contents: 1 Excel workbook (.xlsx), sheets: Guide, Summary, Assumptions, Monthly model, Cohort retention. No macros, no locked cells, no hidden sheets. Built and verified by Bindler.
Got a question about the product? Email us at support@flevy.com or ask the author directly by using the "Ask the Author a Question" form. If you cannot view the preview above this document description, go here to view the large preview instead.
Source: Best Practices in Financial Modeling, SaaS Excel: SaaS Financial Model, 36 Months Excel (XLSX) Spreadsheet, Bindler
ABOUT THE AUTHOR

Bindler builds Excel workbooks that turn a regulation or a financing structure into live formulas: CSRD double materiality, GHG Protocol inventory, EU Taxonomy, SFDR PAI, PCAF, green bond reporting, IFRS S2, ESRS E1 transition plans, CBAM, the EU AI Act, UAE Corporate Tax, and project finance models for solar, onshore wind and battery storage.
Every workbook is built from the primary text
... [read more]
Ask the Author a Question
You must be logged in to contact the author.




























