
Professional Services Firm 10-Year Advanced Financial Model – Excel XLSX
Excel (XLSX)
BENEFITS OF THIS DOWNLOADABLE EXCEL DOCUMENT
- Provides a fully integrated 10-year financial framework purpose-built for consulting firms, advisory practices, legal services, accounting groups, and outsourcing businesses of any size.
- Delivers institutional-grade 3-statement modeling with a 4-stream revenue engine, role-based billing rate structure, and billable utilization mechanics built around how professional services firms actually generate and protect revenue.
- Equips founders, CFOs, private equity investors, and M&A advisors with the exact financial infrastructure needed to plan, fund, scale, and exit a professional services business with complete analytical confidence.
INTEGRATED FINANCIAL MODEL EXCEL DESCRIPTION
Curated by McKinsey-trained Executives
🚀 Professional Services Firm Financial Model | Institutional-Grade Integrated 3-Statement 10-Year Forecast
Transform your professional services business into a fundable, investable, pitch-ready enterprise – modeled with the institutional-grade precision used by the world's leading consulting firms, advisory practices, legal firms, accounting groups, and outsourcing businesses.
Whether you're a consulting firm founder raising growth capital, a private equity firm evaluating a professional services acquisition, a CFO stress-testing headcount burn and billable utilization, an investment banker running an advisory sector M&A process, or a corporate finance team benchmarking EBITDA margins against industry comps – this fully integrated 3-Statement Financial Model gives you the exact financial infrastructure to plan, pitch, fund, scale, and exit with complete confidence.
💡 What's Inside
This model covers every financial dimension of building and scaling a professional services business – from your founding metrics through a 10-year path to revenue maturity, contract backlog depth, or full exit. Built on Financial Modeling World Cup best practices, it's fully dynamic, cross-linked across 19 tabs, and ready to customize for your specific billing structure, service line mix, utilization targets, and personnel cost profile.
📥 Inputs
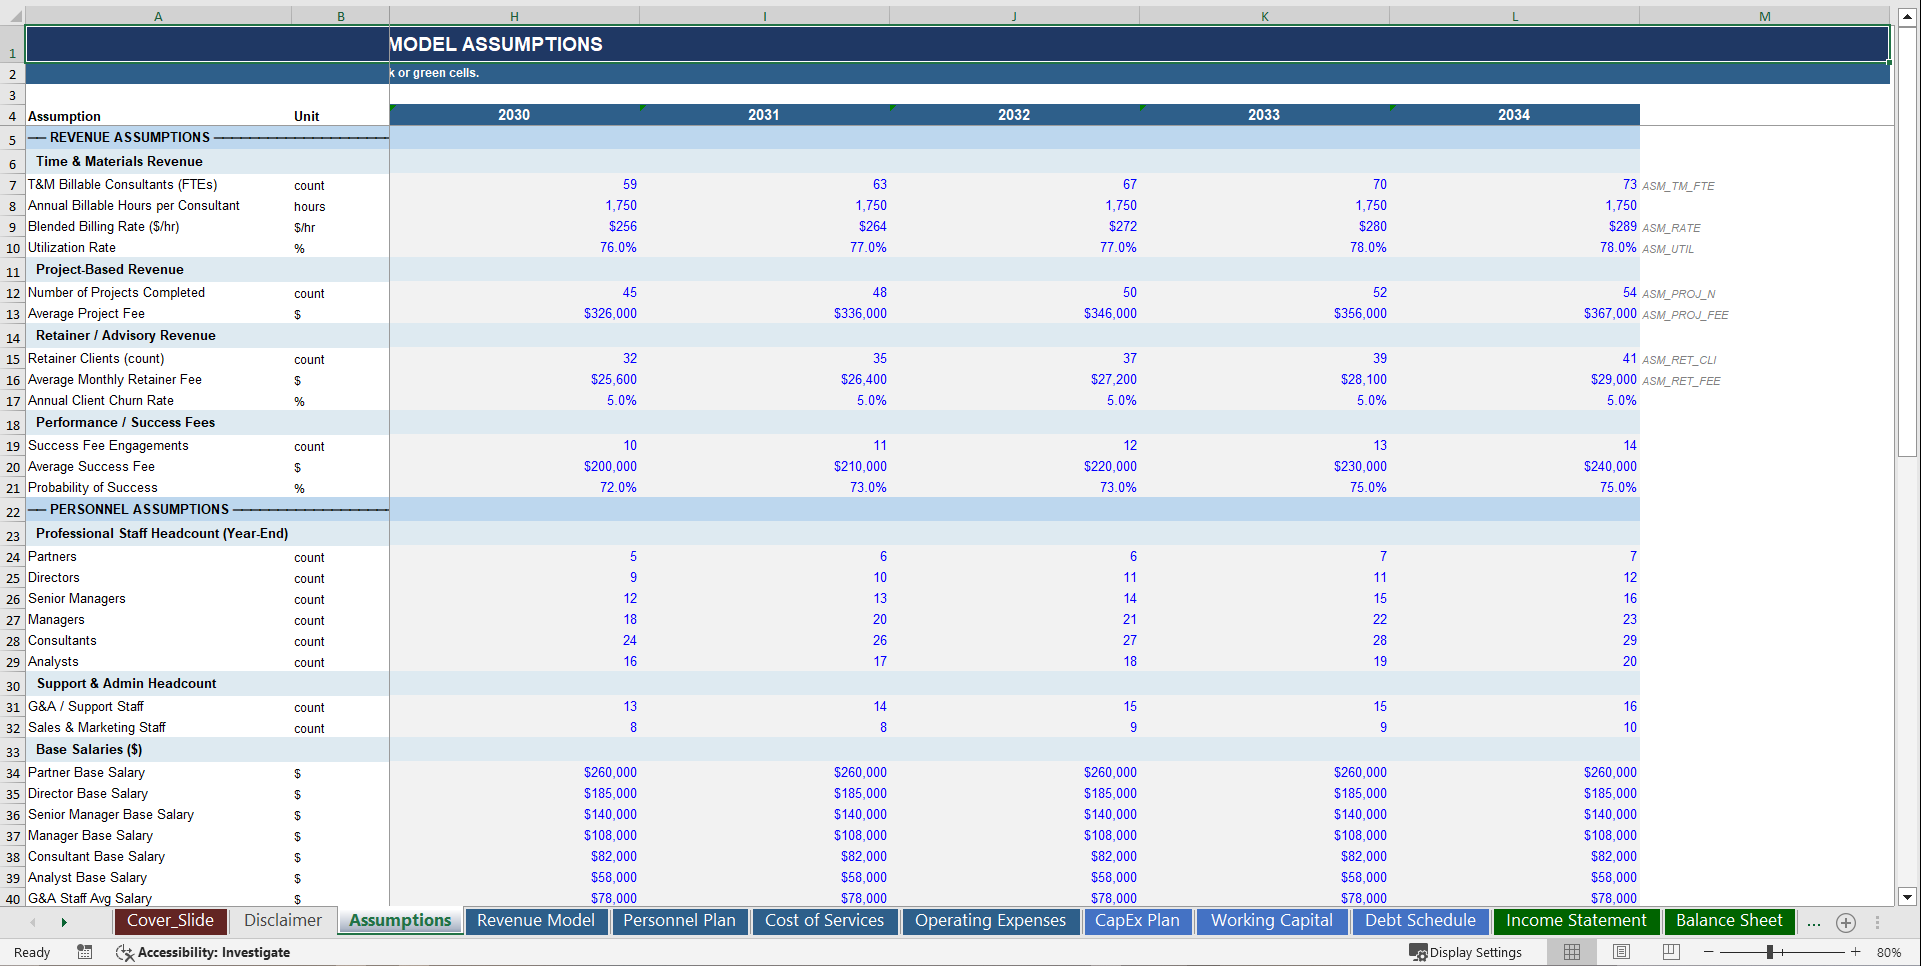
• 🎯 4-Stream Revenue Engine – Separate modeling for Time & Materials Revenue (billable consultants × hours × blended billing rate × utilization), Project-Based Revenue (projects completed × average project fee), Retainer & Advisory Revenue (client count × monthly retainer × 12 × retention rate), and Performance & Success Fees (engagements × probability of success × fee size) – each with individual base-year inputs, annual growth rates, and gross margin assumptions – plus a fully independent pricing model with role-based billing rates by seniority level – every revenue dollar traced to its operational root cause, fully adjustable from a single Assumptions tab
• 📊 Role-Based Billing Rate & Utilization Model – Billing rates modeled individually by seniority tier (Partner, Director, Senior Manager, Manager, Consultant, Analyst) with blended rate compounding annually – utilization rate tracked as a standalone lever – billable hours per consultant configurable – effective hourly revenue realised computed separately from headline rate – revenue per billable FTE and revenue per employee calculated for every period across all 10 years
• 👥 Sales Pipeline & Client Conversion Engine – Retainer client count roll-forward with gross new client additions, annual churn rate applied per period, and net client growth modeled separately from project pipeline – success fee probability-weighted revenue layered on top – recurring revenue percentage and retainer revenue as a share of total revenue tracked as stability metrics – the exact client retention intelligence every PE buyer, strategic acquirer, and recurring revenue lender interrogates on page one of their diligence checklist
• 🔩 5-Component Cost of Services Engine – Billable Staff Compensation (formula-driven from the Personnel Plan with an 87% billable allocation split) – Subcontractor & Contractor Costs – Project Delivery Expenses – Travel & Entertainment – each with individual revenue-proportional scaling and inflation sensitivity – plus gross margin analysis including labour cost as a percentage of revenue and cost per billable consultant – every cost component individually modeled and reconciled back to Gross Profit
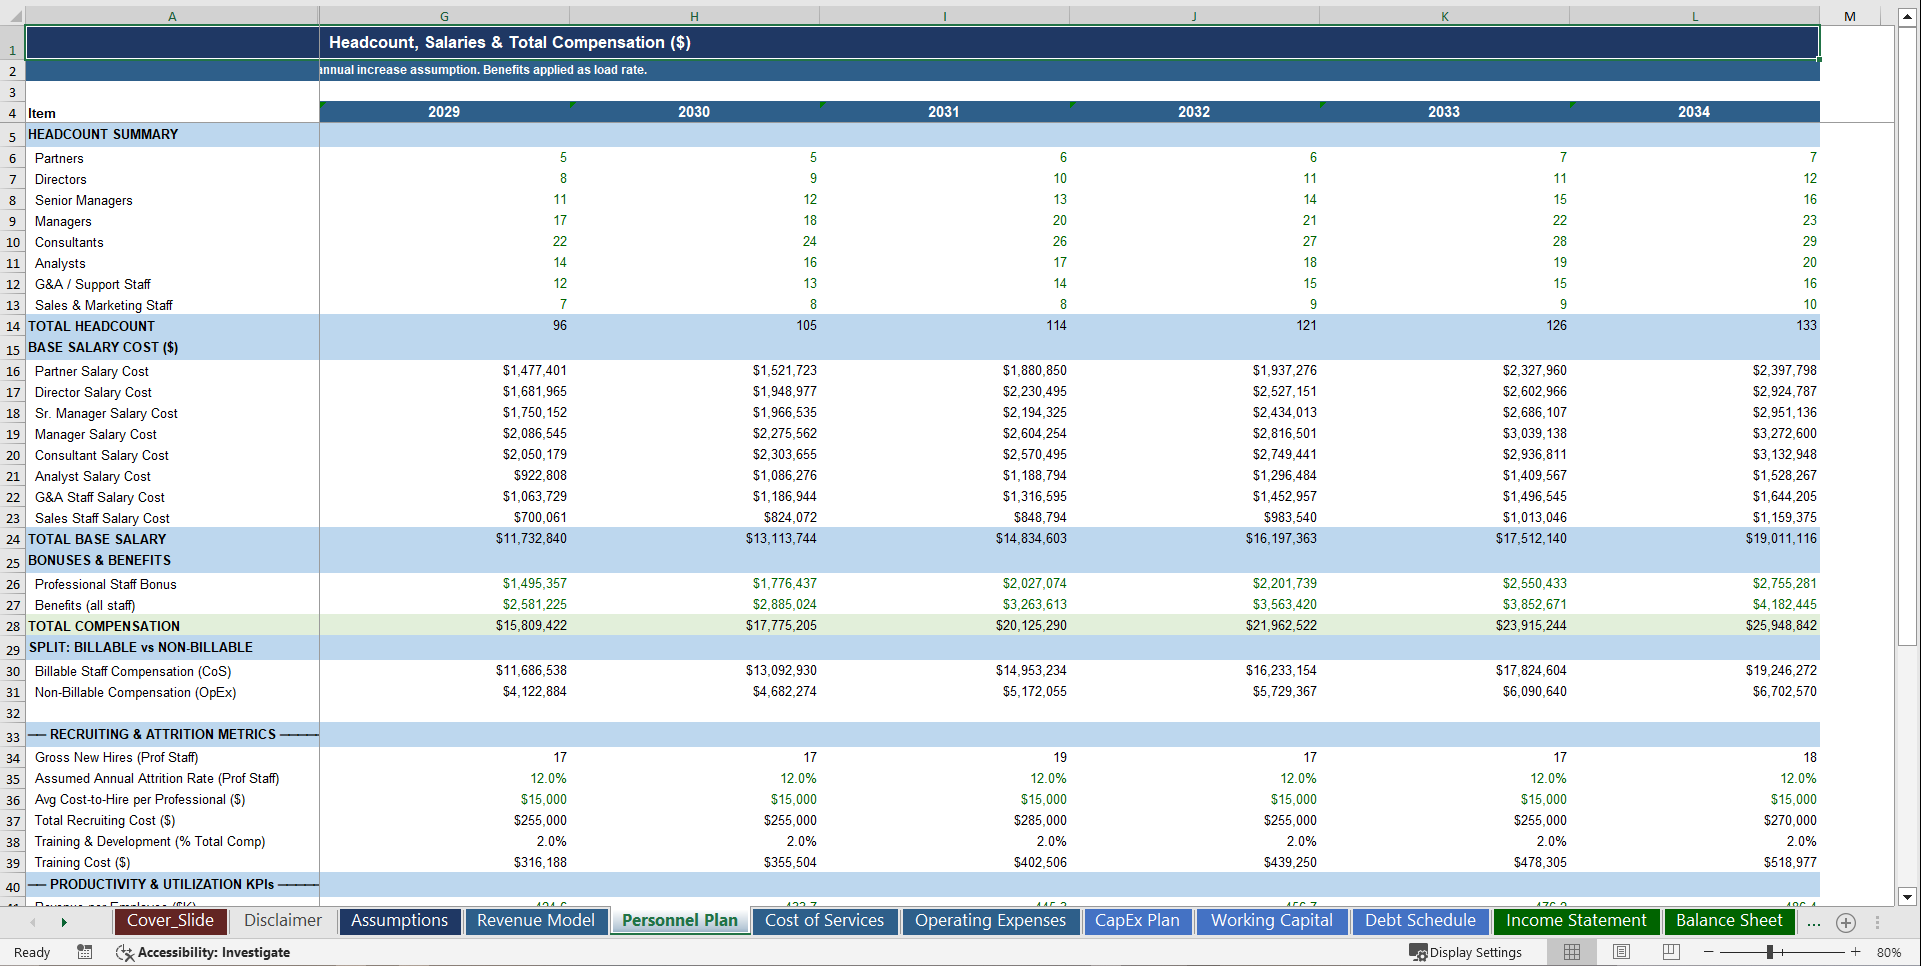
• 👤 Personnel Plan with Full Compensation Stack – Consulting, Support, and Sales departments each with individual Year 1 headcount, annual growth targets, and role-level base salaries (Partner through Analyst) – compounding annually at a configurable salary increase rate – plus Benefits & Health Insurance loaded at a configurable benefits rate, Bonus & Incentive Pay as a percentage of base, annual attrition rate, gross new hires, and recruiting cost per hire – total compensation, total headcount, revenue per employee, compensation as a percentage of revenue, and average cost per employee tracked across all 10 years
• 🔬 Recruiting, Attrition & Productivity Analytics – Gross new hires computed from net headcount growth plus attrition-driven backfill – recruiting cost per hire referenced from Assumptions – training & development cost as a percentage of total compensation – revenue per billable FTE, revenue per employee, and compensation as a percentage of revenue tracked annually – the exact workforce productivity metrics that institutional investors and PE acquirers benchmark against professional services sector comps
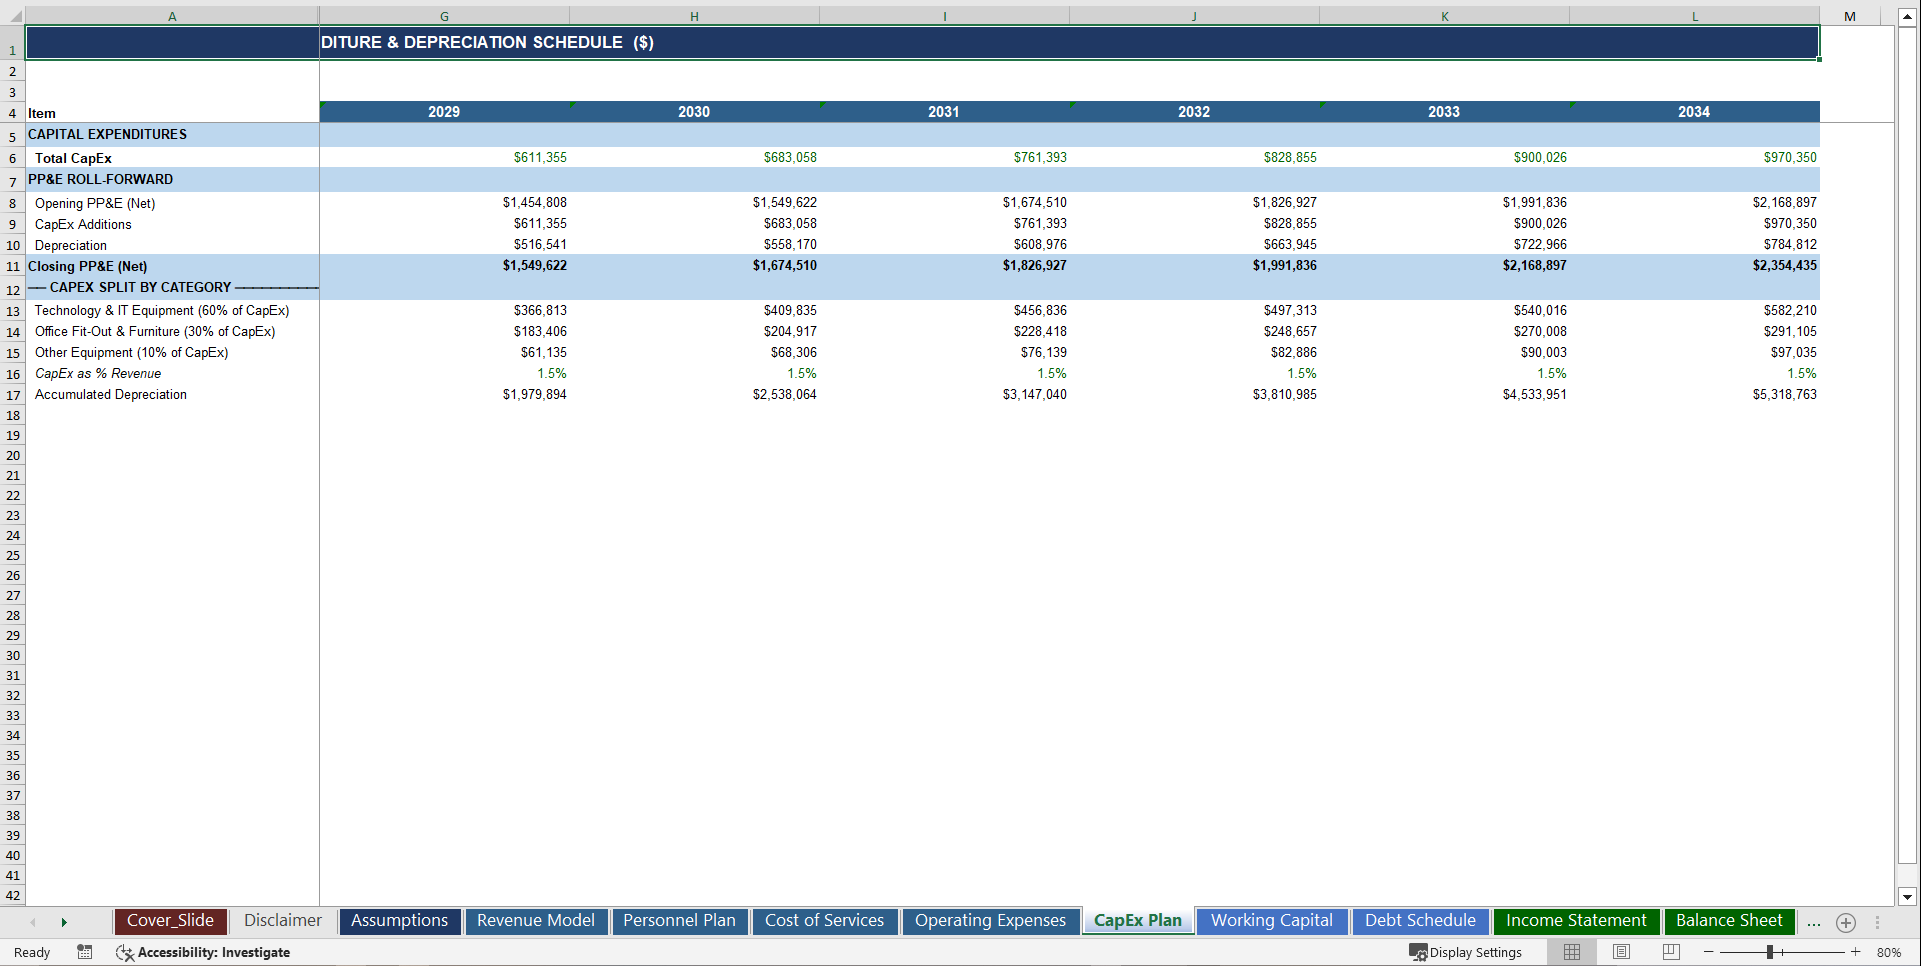
• 🏗️ 3-Category CapEx with Sub-Line Detail – Technology & IT Equipment (60% of total CapEx), Office Fit-Out & Furniture (30%), and Other Equipment (10%) – with a full PP&E roll-forward tracking opening net book value, annual CapEx additions, depreciation charge, and closing net PP&E – CapEx as a percentage of revenue computed for every year – straight-line depreciation on a blended asset life configurable from the Assumptions tab
• 🏦 Debt & Financing Structure – Term Loan modeled with configurable opening balance, annual scheduled repayment, and interest rate – interest expense flowing directly into the Income Statement – closing debt balance feeding the Balance Sheet – net debt computed as debt minus cash – leverage ratios including Net Debt / EBITDA, Debt-to-Equity, and Debt Service Coverage Ratio calculated for every period of the forecast
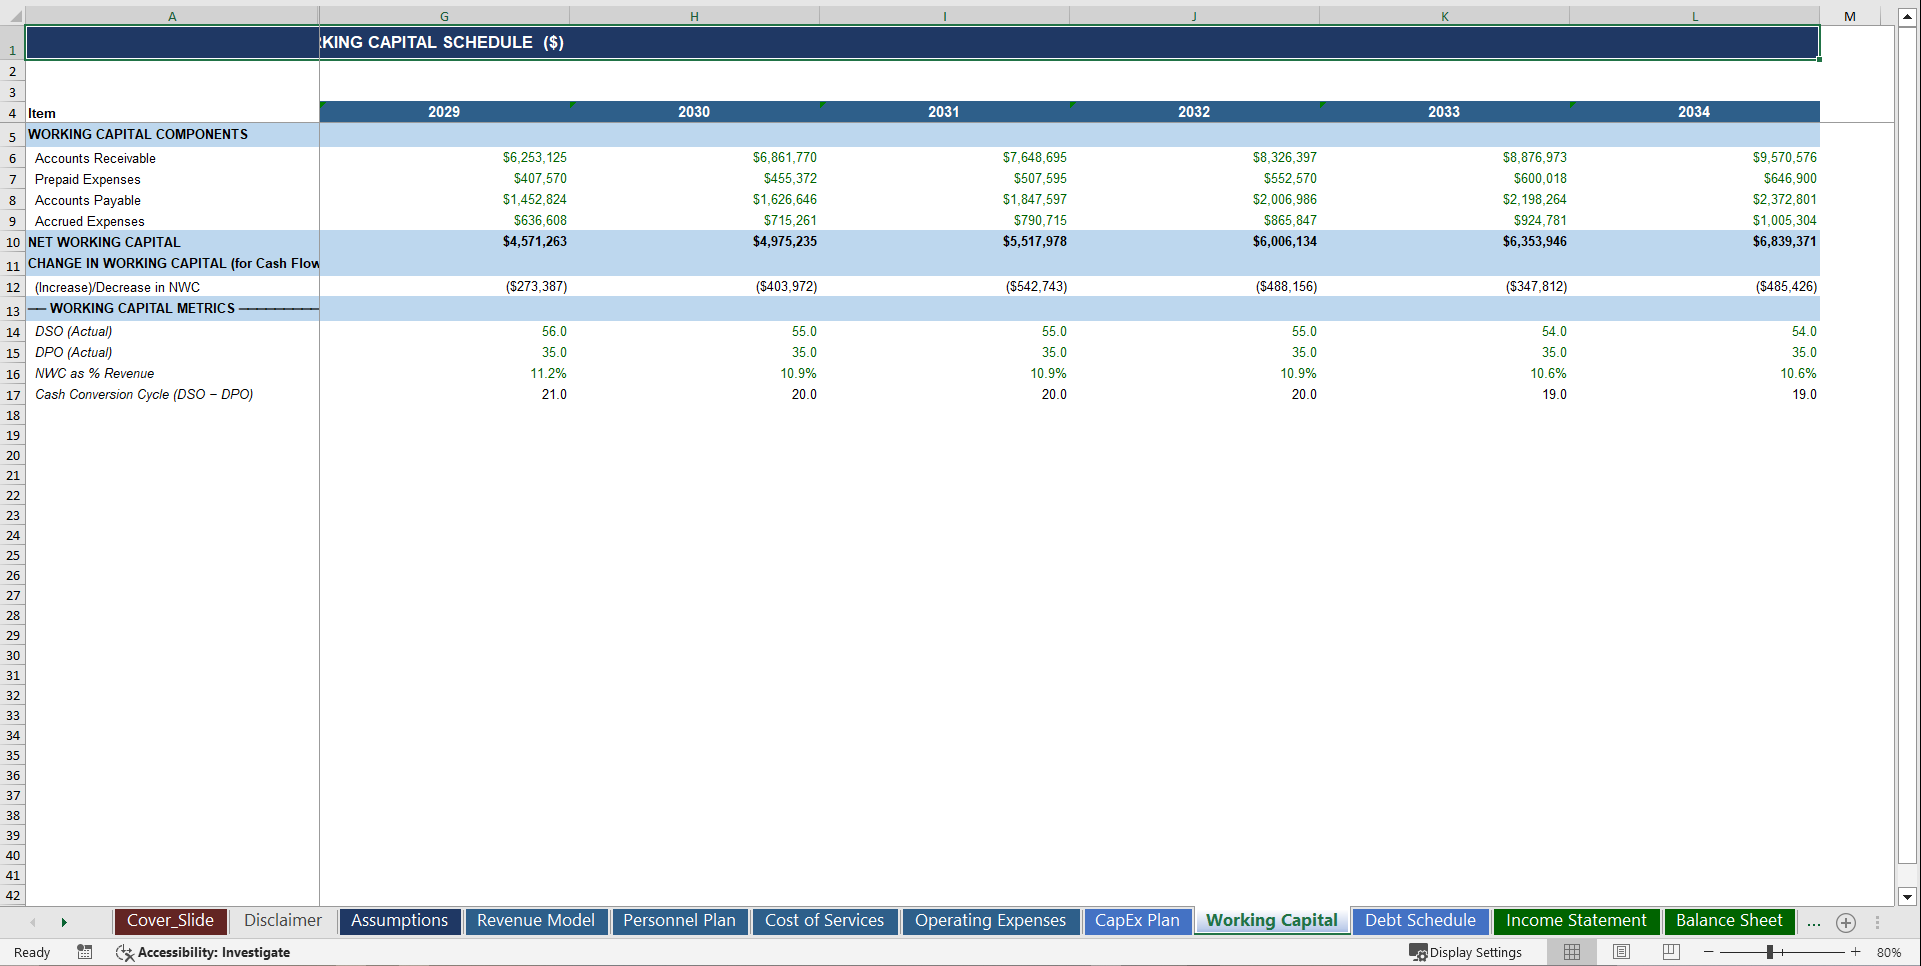
• 📦 Working Capital & Billing Model – Accounts Receivable sized by configurable Days Sales Outstanding – Accounts Payable sized by configurable Days Payable Outstanding – Accrued Expenses sized as a percentage of operating expenses – Prepaid Expenses as a percentage of revenue – Net Working Capital and Change in NWC fully linked into the Cash Flow Statement – DSO actual, DPO actual, NWC as a percentage of revenue, and Cash Conversion Cycle tracked as efficiency metrics
• 📊 3-Table Sensitivity & Scenario Engine – Year 5 EBITDA sensitivity matrix across Utilization Rate vs. Billing Rate Change (25 scenario intersections, heat-map color-coded) – 5-Year Cumulative Revenue matrix across Headcount Growth vs. Billing Rate (25 scenario intersections) – a full 10-year scenario comparison table across Base Case / High Growth / Hiring Slowdown / Utilization Decline / Economic Downturn / Rapid Client Expansion – giving you instant scenario answers across 3 independent risk dimensions without touching a single formula
📤 Outputs
• 📈 10-Year Fully Integrated 3-Statement Financial Model – Income Statement, Balance Sheet, and Cash Flow Statement fully cross-linked and auto-balancing across all 10 annual periods – every line item formula-driven, zero hardcoded numbers outside the Assumptions tab – Balance Sheet confirmed balanced with a live ✓ BALANCED / ✗ CHECK indicator for every year
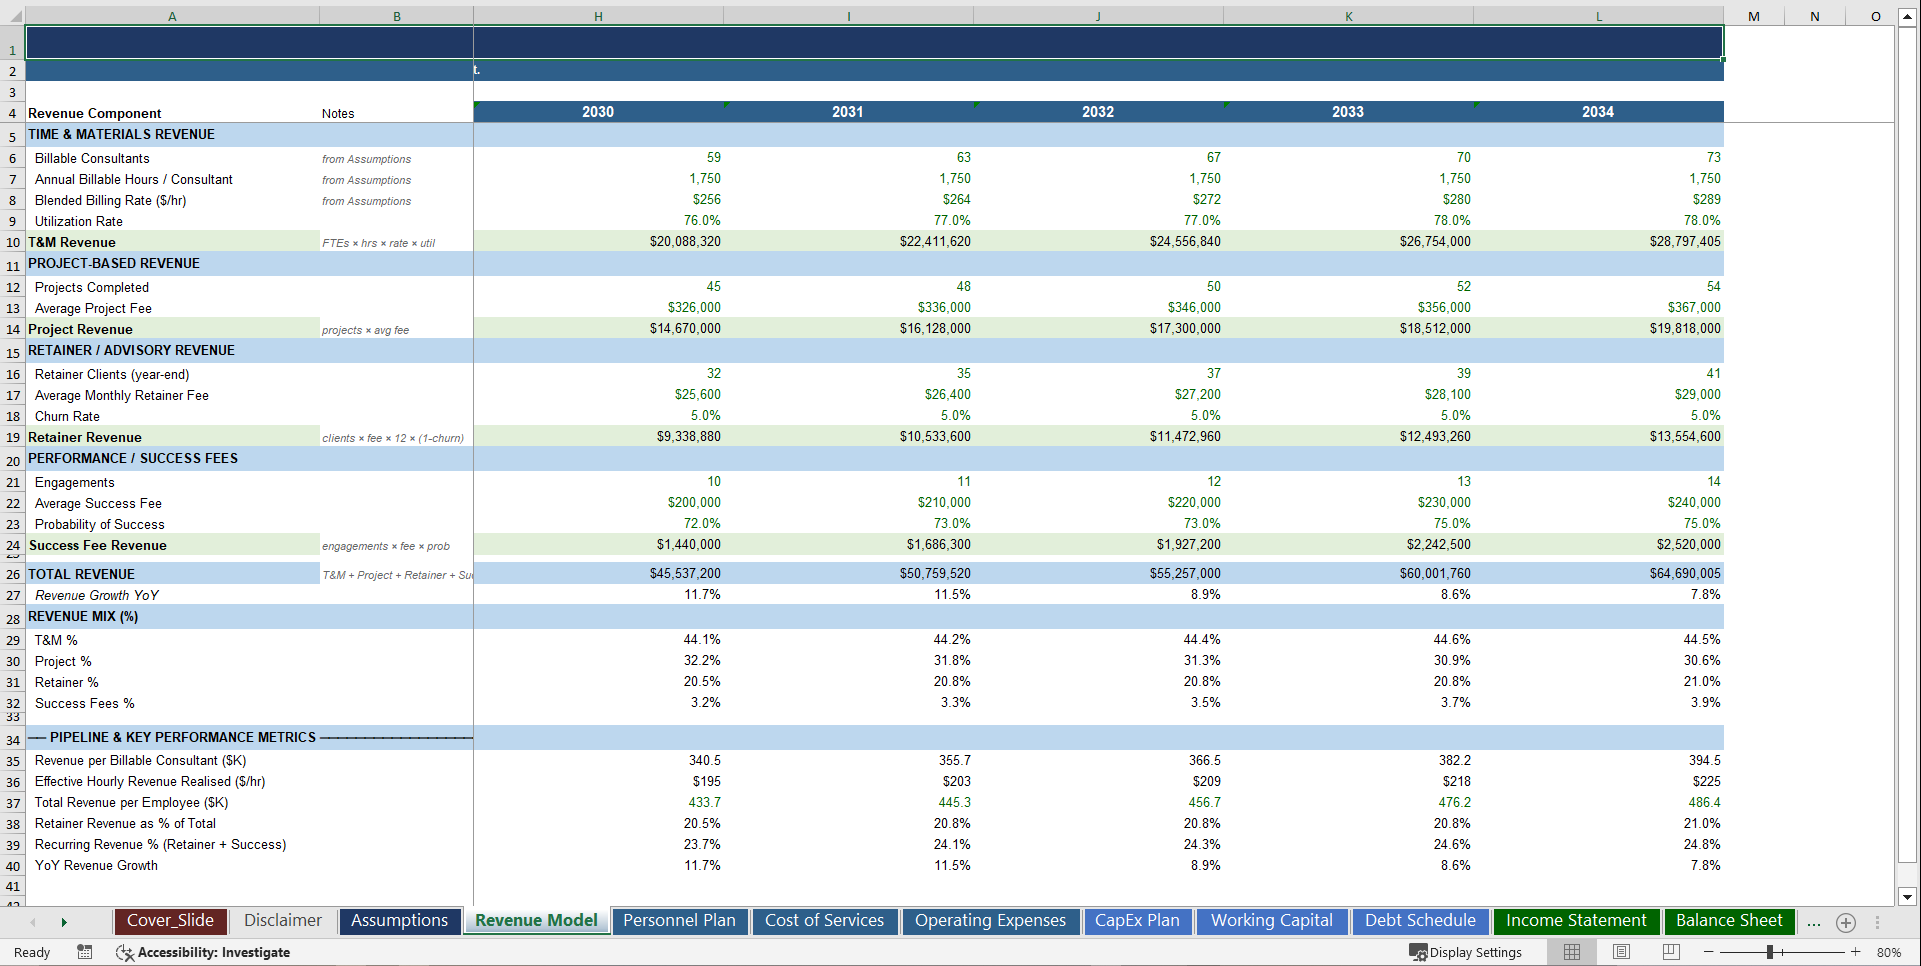
• 🎯 4-Stream Revenue Waterfall with Sub-Line Transparency – Annual projections for T&M Revenue, Project Revenue, Retainer Revenue, and Success Fees – with year-over-year growth rates, revenue mix percentages, recurring revenue percentage, revenue per billable consultant, effective hourly rate realised, and total revenue per employee computed for every year of the 10-year forecast
• 📋 Billable Utilization & Rate Intelligence – Blended billing rate, utilization rate, billable hours per consultant, and effective hourly revenue realised tracked annually – utilization as a primary profitability lever fully isolated from headcount growth – the exact operational metrics every consulting firm CFO, PE operating partner, and strategic acquirer uses to benchmark delivery efficiency
• 🔩 Cost of Services Waterfall – Billable staff compensation, subcontractor costs, project delivery expenses, and travel – total Cost of Services reconciled back to Gross Profit with blended Gross Margin % for every period – gross margin analysis including labour cost percentage and cost per billable consultant computed as efficiency metrics
• 🔬 Personnel Cost Schedule – 8 role categories with individual headcount and salary inputs, full compensation stack with benefits, bonuses, and recruiting costs compounding annually – total headcount by year, total compensation cost, revenue per employee, compensation as percentage of revenue – fully flowing into the Income Statement as a transparent, auditable operating and cost-of-services expense
• 🏭 Professional Services Unit Economics – Revenue per billable consultant, revenue per employee, effective billing rate, utilization rate, compensation-to-revenue ratio, gross new hires, attrition-driven backfill, recruiting cost – consulting sector gross margin and EBITDA margin benchmarks built into the model structure – so every efficiency gain in your delivery engine is visible, defensible, and benchmarkable against professional services sector comps
• 💼 CapEx & PP&E Schedule – 3-category CapEx each with sub-line percentage split, total CapEx and CapEx as a percentage of revenue for every year, opening PP&E, annual additions, depreciation charge, closing net PP&E, and accumulated depreciation – D&A flowing directly into the Income Statement and Cash Flow Statement with zero manual reconciliation
• 📦 Working Capital Schedules – Accounts Receivable, Prepaid Expenses, Accounts Payable, Accrued Expenses, Net Working Capital, and Change in NWC fully linked to the Cash Flow Statement – DSO actual, DPO actual, NWC as a percentage of revenue, and Cash Conversion Cycle computed annually – Current Ratio, Quick Ratio, Debt-to-Equity, Net Debt, Net Debt / EBITDA, Return on Equity, and Return on Assets tracked as balance sheet health metrics
• 🔄 Cash Flow Statement – Full Indirect Method – Net Income, D&A add-back, individual working capital movement lines, CapEx, debt repayment – Free Cash Flow, FCF Margin %, FCF Conversion Ratio, Cash as a percentage of Revenue, and Days Cash on Hand calculated and tracked for every period – Closing Cash confirmed to reconcile to Balance Sheet cash for every year
• 📐 Executive Dashboard with 5 Live Charts & 8 KPI Cards – Revenue by Service Line stacked bar chart, EBITDA & Net Income trend line, Total Headcount growth bar chart, Utilization % and EBITDA Margin trend line, and Cash Balance line chart – plus KPI cards covering Year 1 Revenue, EBITDA, Gross Margin %, EBITDA Margin %, Total Headcount, Utilization Rate, Revenue per Employee, and Closing Cash – all auto-updating from a single Assumptions tab
🏆 Why This Model Stands Out
✅ Fully integrated – every sheet talks to every other sheet. Change one assumption and 1,975+ formulas update instantly across all 19 tabs
✅ Investor and lender-ready – structured and formatted to answer the exact questions PE acquirers, strategic buyers, growth equity firms, and senior debt providers ask on day one of a professional services diligence process: What is billable utilization? What is revenue per employee? What is gross margin by service line? What is the compensation-to-revenue ratio? When does free cash flow turn meaningfully positive? What does the model look like under a utilization stress scenario?
✅ Professional services industry realistic – built around how advisory, consulting, legal, and outsourcing businesses actually generate and protect revenue: T&M revenue compounding through billable headcount additions and rate escalation offset by utilization risk, gross margin expanding as the senior-to-junior mix optimises, retainer revenue building as client relationships deepen, project revenue diversifying the revenue base beyond recurring – not generic assumptions recycled into a services template
✅ Institutional color-coding throughout – blue inputs, black formulas, green cross-sheet links – Financial Modeling World Cup color conventions used throughout, so any investor, lender, operator, or acquirer can open it and immediately understand the logic, trace every number to its source, and audit every formula without a guide
✅ Fully dynamic and scalable – all 70+ assumptions centralized on a single Assumptions tab. Adjust billing rates, utilization targets, headcount plan, churn rates, salary escalation, CapEx intensity, DSO, and tax rate from one place and watch 19 tabs reprice instantly – built for the CFO who needs to run 10 scenarios before a Monday board meeting
✅ Fully unlocked – no protected sheets, no black-box formulas, no hidden logic. Every assumption is visible. Every formula is auditable. Own it, customize it, present it to any PE firm, strategic acquirer, growth equity investor, or debt refinancing committee with complete confidence
📋 Model Structure – 19 Sheets
• Executive Dashboard – 5 live charts + 8 KPI summary cards covering all key revenue, margin, headcount, utilization, and cash metrics, auto-updating from a single Assumptions tab
• Assumptions – Every input centralized: 70+ individually configurable drivers covering all 4 revenue streams, billing rates by role, utilization targets, headcount plan, salary escalation, churn rates, cost percentages, 3-category CapEx, working capital days, debt terms, tax rate, and 6-scenario toggles – all blue-coded for instant editing
• Revenue Model – All 4 revenue streams with full sub-line detail formula-driven from operational assumptions, blended margin by stream, revenue mix %, recurring revenue %, YoY growth, revenue per employee, and effective billing rate – building up to Total Revenue for every annual period
• Personnel Plan – 8 role categories with individual headcount and salary inputs, full compensation stack with benefits and bonuses compounding annually, recruiting cost and attrition modeling, productivity metrics including revenue per employee and comp-to-revenue ratio – fully flowing into Cost of Services and Operating Expenses
• Cost of Services – Billable staff compensation, subcontractor costs, project delivery expenses, travel – total Cost of Services reconciled back to Gross Profit with gross margin analysis and labour cost percentage metrics
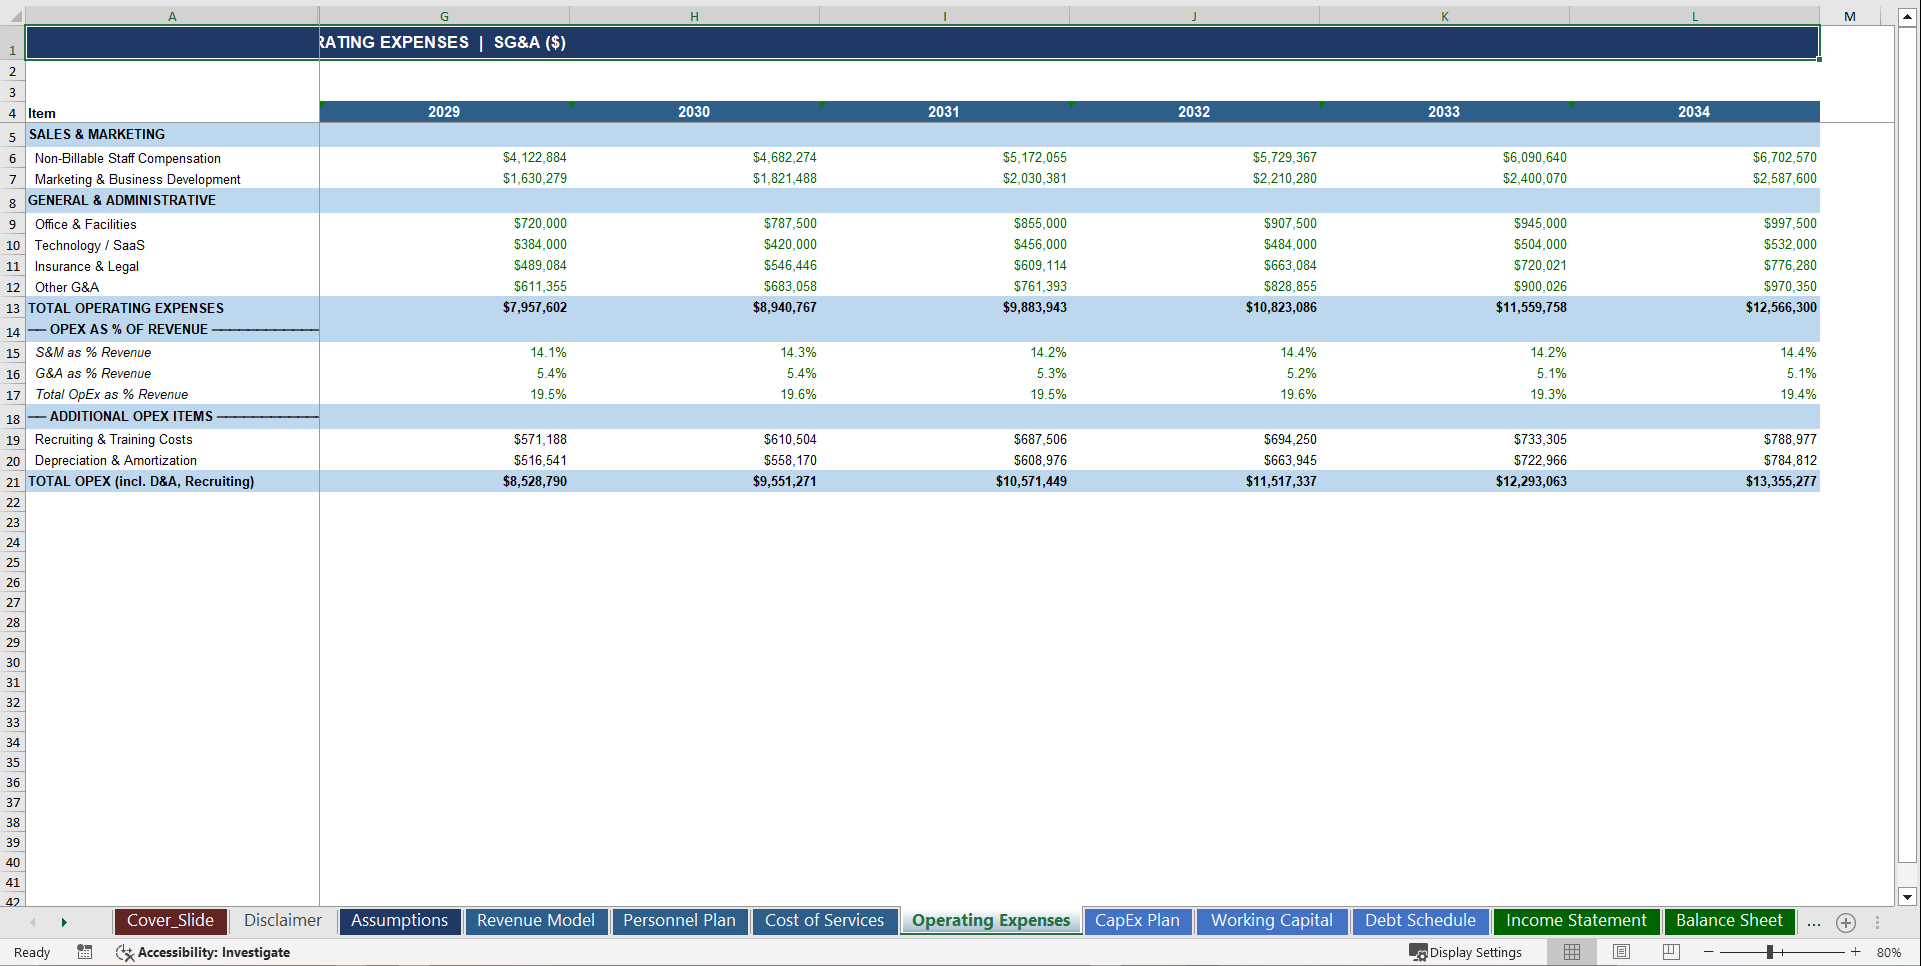
• Operating Expenses – Full SG&A breakdown including non-billable staff compensation, marketing & business development, office & facilities, technology & SaaS, insurance & legal, and other G&A – with OpEx as a percentage of revenue and total OpEx including D&A and recruiting
• CapEx Plan – 3-category CapEx with sub-line percentage splits, full PP&E roll-forward, depreciation schedule, accumulated depreciation, and CapEx as a percentage of revenue
• Working Capital – DSO-driven receivables, DPO-driven payables, accrued expenses, NWC, Change in NWC, and Cash Conversion Cycle fully linked to the Cash Flow Statement
• Debt Schedule – Term loan with opening balance, repayment schedule, interest expense, closing balance, and leverage ratios including Net Debt / EBITDA and Debt Service Coverage
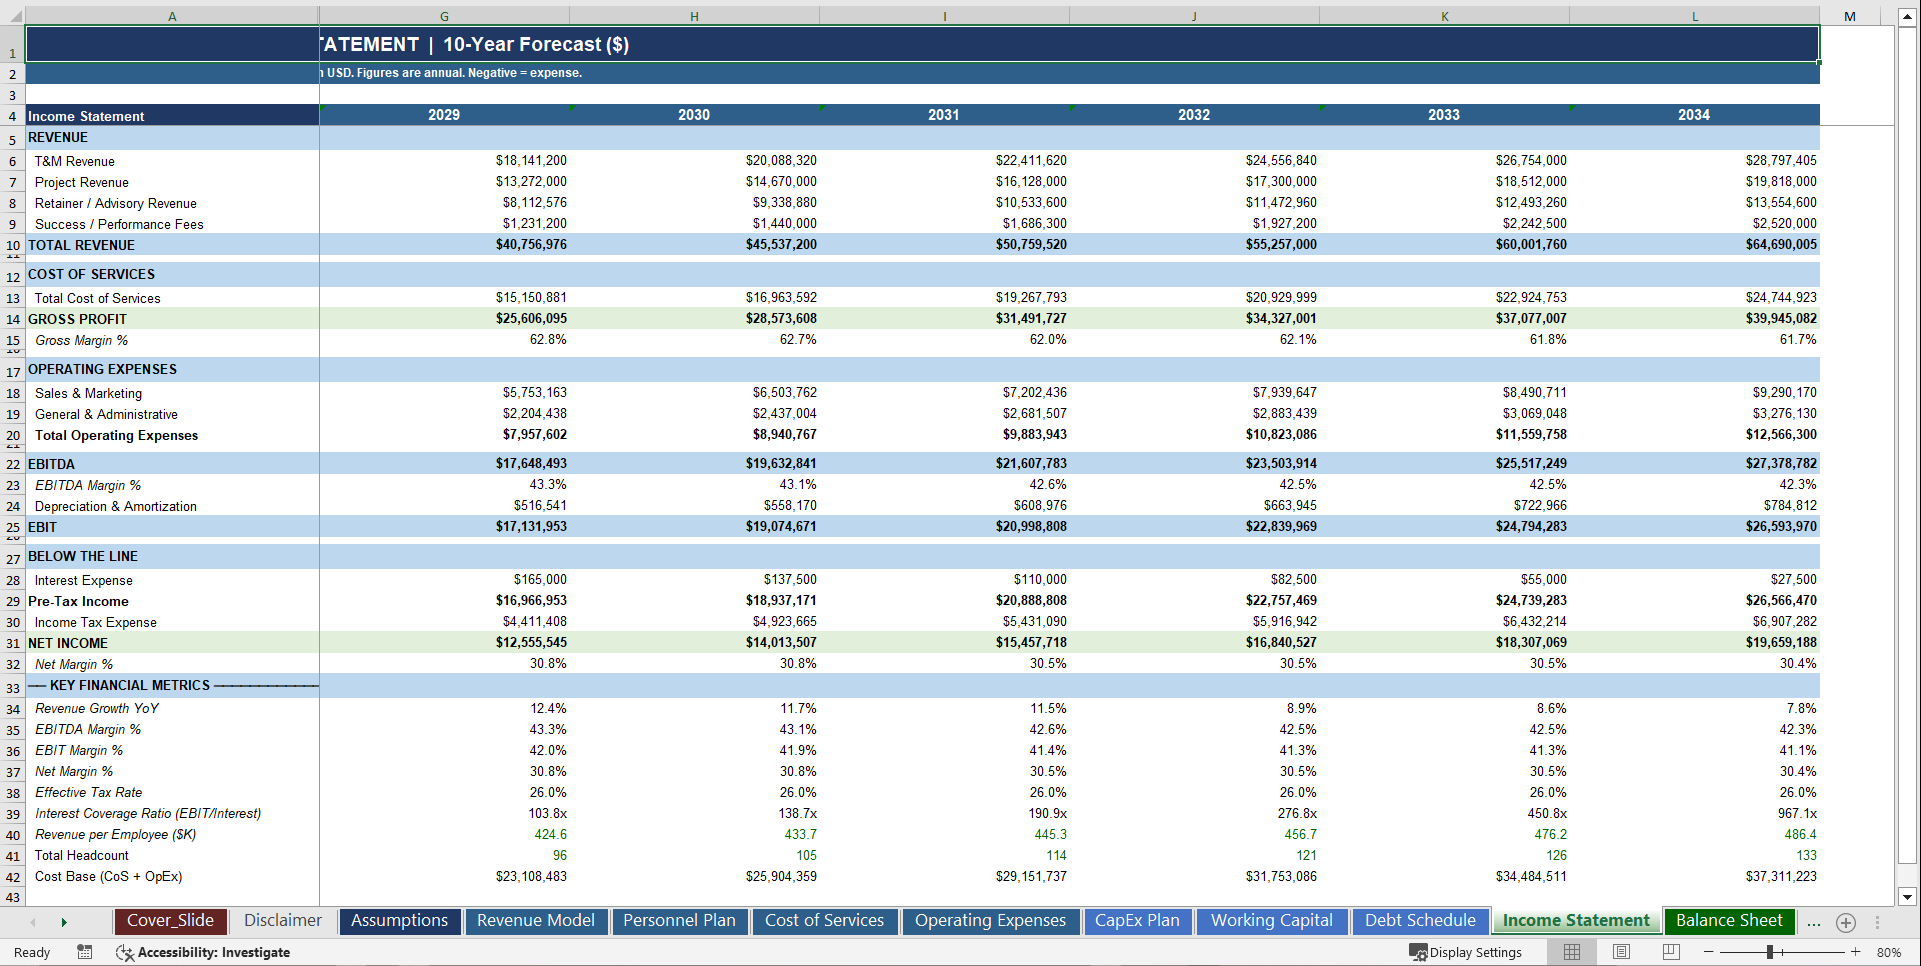
• Income Statement – Revenue through Net Income with 4-stream revenue, Cost of Services, Gross Profit, full SG&A, EBITDA, EBIT, interest, taxes, and all key margin percentages for every period
• Balance Sheet – Full asset, liability, and equity stack with auto-balancing ✓ BALANCED check + 7 analytical ratios including Current Ratio, Quick Ratio, ROE, ROA, Net Debt, Net Debt / EBITDA, and Debt-to-Equity – confirming financial integrity across all 10 annual periods
• Cash Flow Statement – Full indirect method with individual working capital movements, CapEx, FCF, FCF Margin %, FCF Conversion Ratio, Days Cash on Hand, and closing cash reconciled to the Balance Sheet
• Sensitivity Analysis – 3 independent stress-test tables across EBITDA, Revenue, and scenario comparison – 60+ instant scenario data points color-coded for at-a-glance risk assessment
Key Words:
Strategy & Transformation, Growth Strategy, Strategic Planning, Strategy Frameworks, Innovation Management, Pricing Strategy, Core Competencies, Strategy Development, Business Transformation, Marketing Plan Development, Product Strategy, Breakout Strategy, Competitive Advantage, Mission, Vision, Values, Strategy Deployment & Execution, Innovation, Vision Statement, Core Competencies Analysis, Corporate Strategy, Product Launch Strategy, BMI, Blue Ocean Strategy, Breakthrough Strategy, Business Model Innovation, Business Strategy Example, Corporate Transformation, Critical Success Factors, Customer Segmentation, Customer Value Proposition, Distinctive Capabilities, Enterprise Performance Management, KPI, Key Performance Indicators, Market Analysis, Market Entry Example, Market Entry Plan, Market Intelligence, Market Research, Market Segmentation, Market Sizing, Marketing, Michael Porter's Value Chain, Organizational Transformation, Performance Management, Performance Measurement, Platform Strategy, Product Go-to-Market Strategy, Reorganization, Restructuring, SWOT, SWOT Analysis, Service 4.0, Service Strategy, Service Transformation, Strategic Analysis, Strategic Plan Example, Strategy Deployment, Strategy Execution, Strategy Frameworks Compilation, Strategy Methodologies, Strategy Report Example, Value Chain, Value Chain Analysis, Value Innovation, Value Proposition, Vision Statement, Corporate Strategy, Business Development, Business plan pdf, business plan, PDF, Business Plan DOC, Business Plan Template, PPT, Market strategy playbook, strategic market planning, competitive analysis tools, market segmentation frameworks, growth strategy templates, product positioning strategy, market execution toolkit, strategic alignment playbook, KPI and OKR frameworks, business growth strategy guide, cross-functional strategy templates, market risk management, market strategy PowerPoint doc, guide, ebook, e-book ,McKinsey Change Playbook, Organizational change management toolkit, Change management frameworks 2025, Influence model for change, Change leadership strategies, Behavioral change in organizations, Change management PowerPoint templates, Transformational leadership in change, supply chain KPIs, supply chain KPI toolkit, supply chain PowerPoint template, logistics KPIs, procurement KPIs, inventory management KPIs, supply chain performance metrics, manufacturing KPIs, supply chain dashboard, supply chain strategy KPIs, reverse logistics KPIs, sustainability KPIs in supply chain, financial supply chain KPIs, warehouse KPIs, digital supply chain KPIs, 1200 KPIs, supply chain scorecard, KPI examples, supply chain templates, Corporate Finance SOPs, Finance SOP Excel Template, CFO Toolkit, Finance Department Procedures, Financial Planning SOPs, Treasury SOPs, Accounts Payable SOPs, Accounts Receivable SOPs, General Ledger SOPs, Accounting Policies Template, Internal Controls SOPs, Finance Process Standardization, Finance Operating Procedures, Finance Department Excel Template, FP&A Process Documentation, Corporate Finance Template, Finance SOP Toolkit, CFO Process Templates, Accounting SOP Package, Tax Compliance SOPs, Financial Risk Management Procedures.
NOTE: Our digital products are sold on an "as is" basis, making returns and refunds unavailable post-download. Please preview and inquire before purchasing. Please contact us before purchasing if you have any questions! This policy aligns with the standard Flevy Terms of Usage.
Got a question about the product? Email us at support@flevy.com or ask the author directly by using the "Ask the Author a Question" form. If you cannot view the preview above this document description, go here to view the large preview instead.
Source: Best Practices in Integrated Financial Model Excel: Professional Services Firm 10-Year Advanced Financial Model Excel (XLSX) Spreadsheet, SB Consulting
ABOUT THE AUTHOR
SB Consulting is dedicated to empowering businesses to communicate their ideas with impact. This consulting firm specializes in teaching organizations how to create effective corporate and management presentations. With training from top-tier global consulting firms, including McKinsey, BCG, and Porsche Consulting, extensive expertise in presentation design and ... [read more]
Ask the Author a Question
You must be logged in to contact the author.
