

 Click main image to view in full screen.
Solar PV Project Finance Suite (5 Models + 6 Manuals) – Excel XLSX
Excel (XLSX) + Zip archive file (ZIP)


BENEFITS OF THIS DOWNLOADABLE EXCEL DOCUMENT
- Takes a utility-scale solar project from a long list of candidate sites all the way to a documented investment committee decision, through one connected chain of five Excel instruments.
- Sizes and sculpts senior debt on P90 energy while pricing equity on P50, so the plant is never accidentally financed on a median year.
- Includes 69 numbered checks and sealed paste-values handoffs, so any number can be traced back to a sourced input in minutes.
SOLAR ENERGY EXCEL DESCRIPTION
A utility-scale solar plant is a twenty-five-year bet on a resource nobody controls, financed by lenders who will only lend against the bad year. Deciding whether to build one is not a single calculation; it is a sequence of five questions that must be answered in order, by different specialists, without any of them quietly overwriting the others. This suite is that sequence, built as five connected Excel instruments and documented in more than one hundred pages of manuals.
WHAT THE FIVE INSTRUMENTS DO
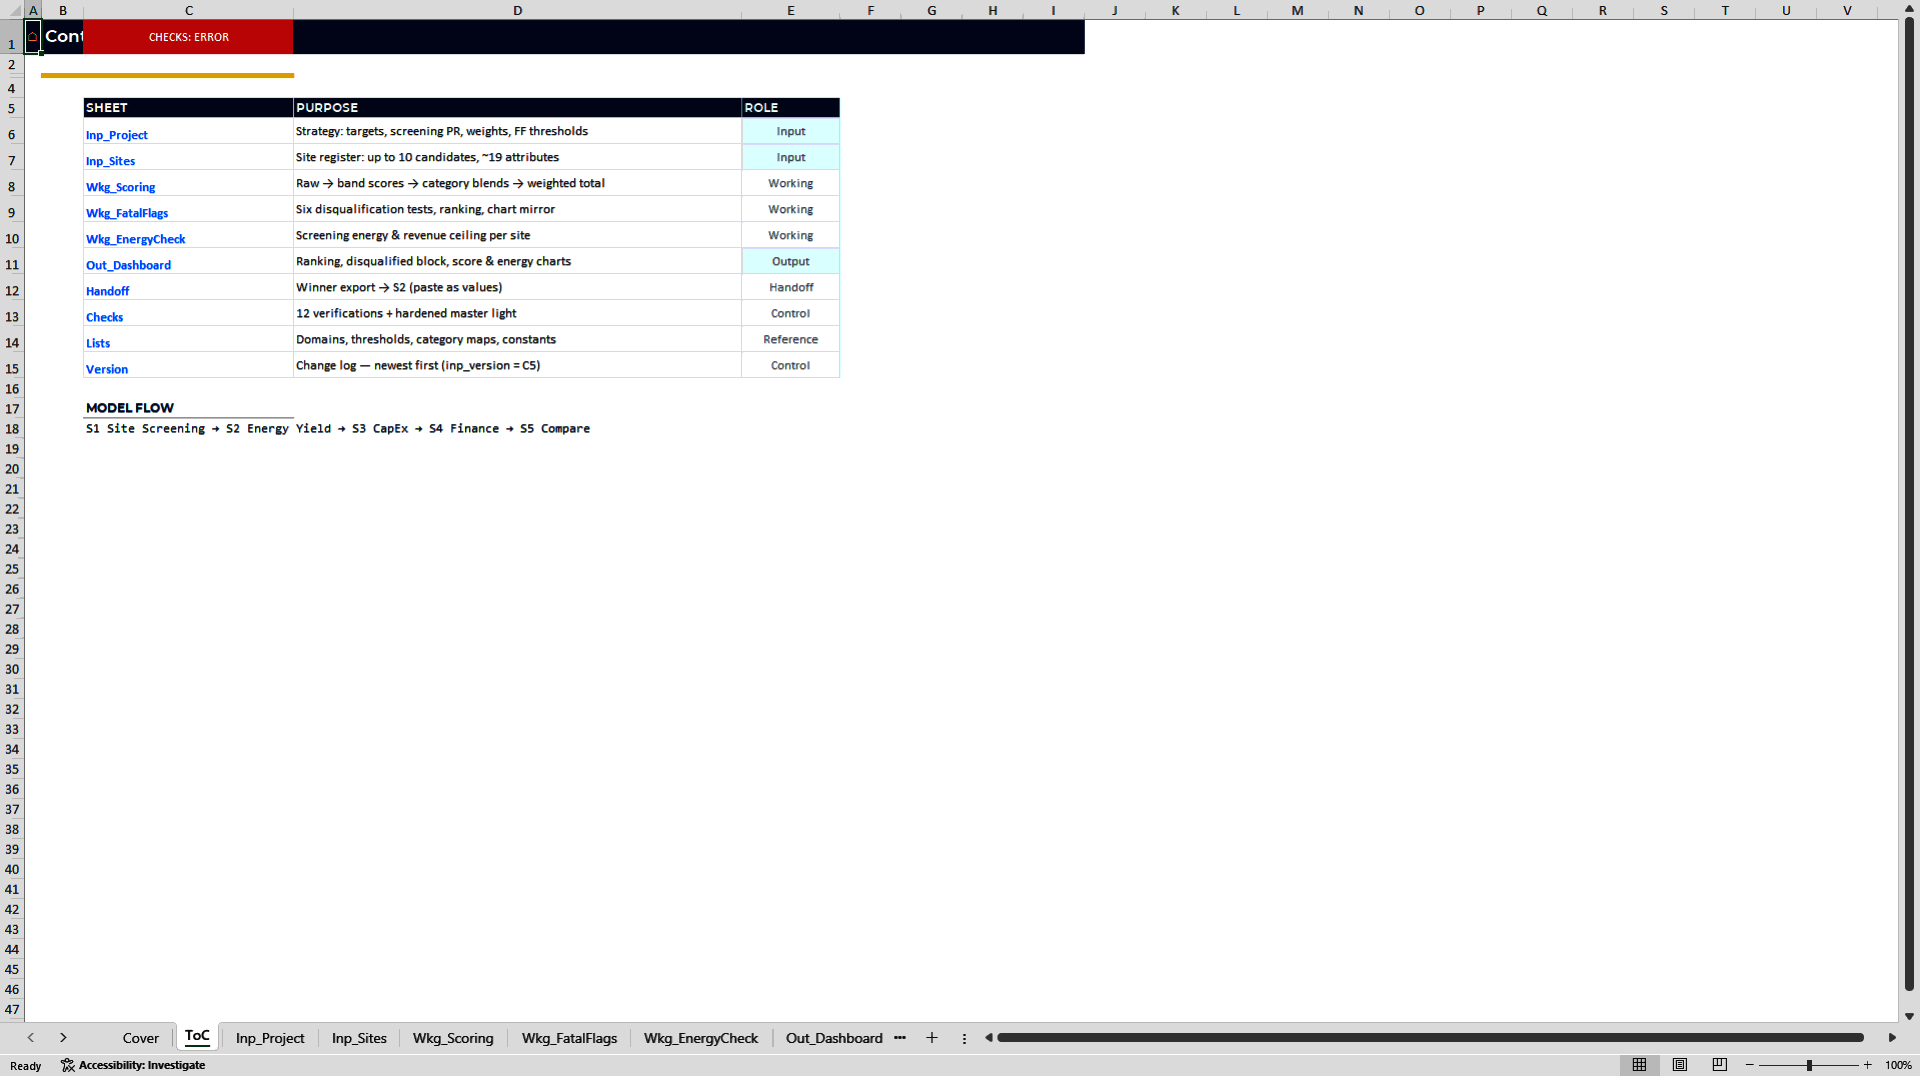
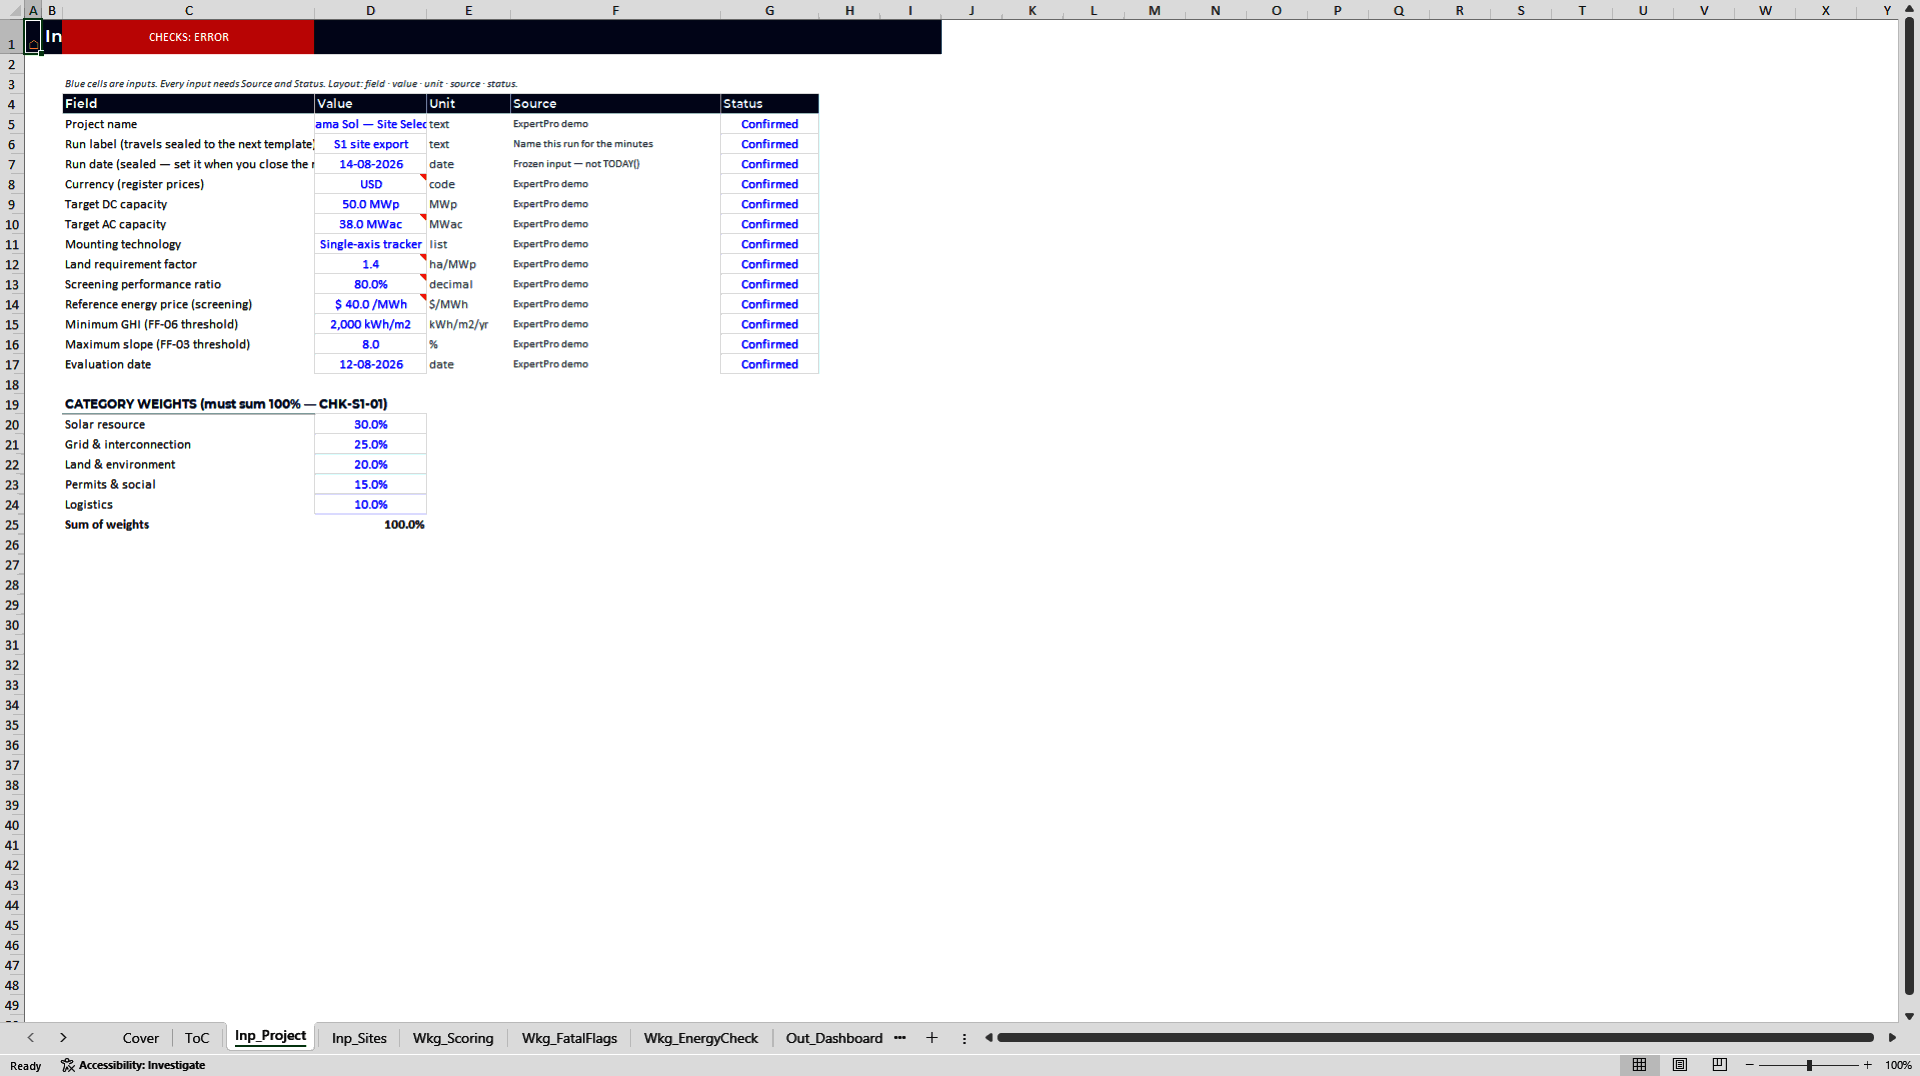
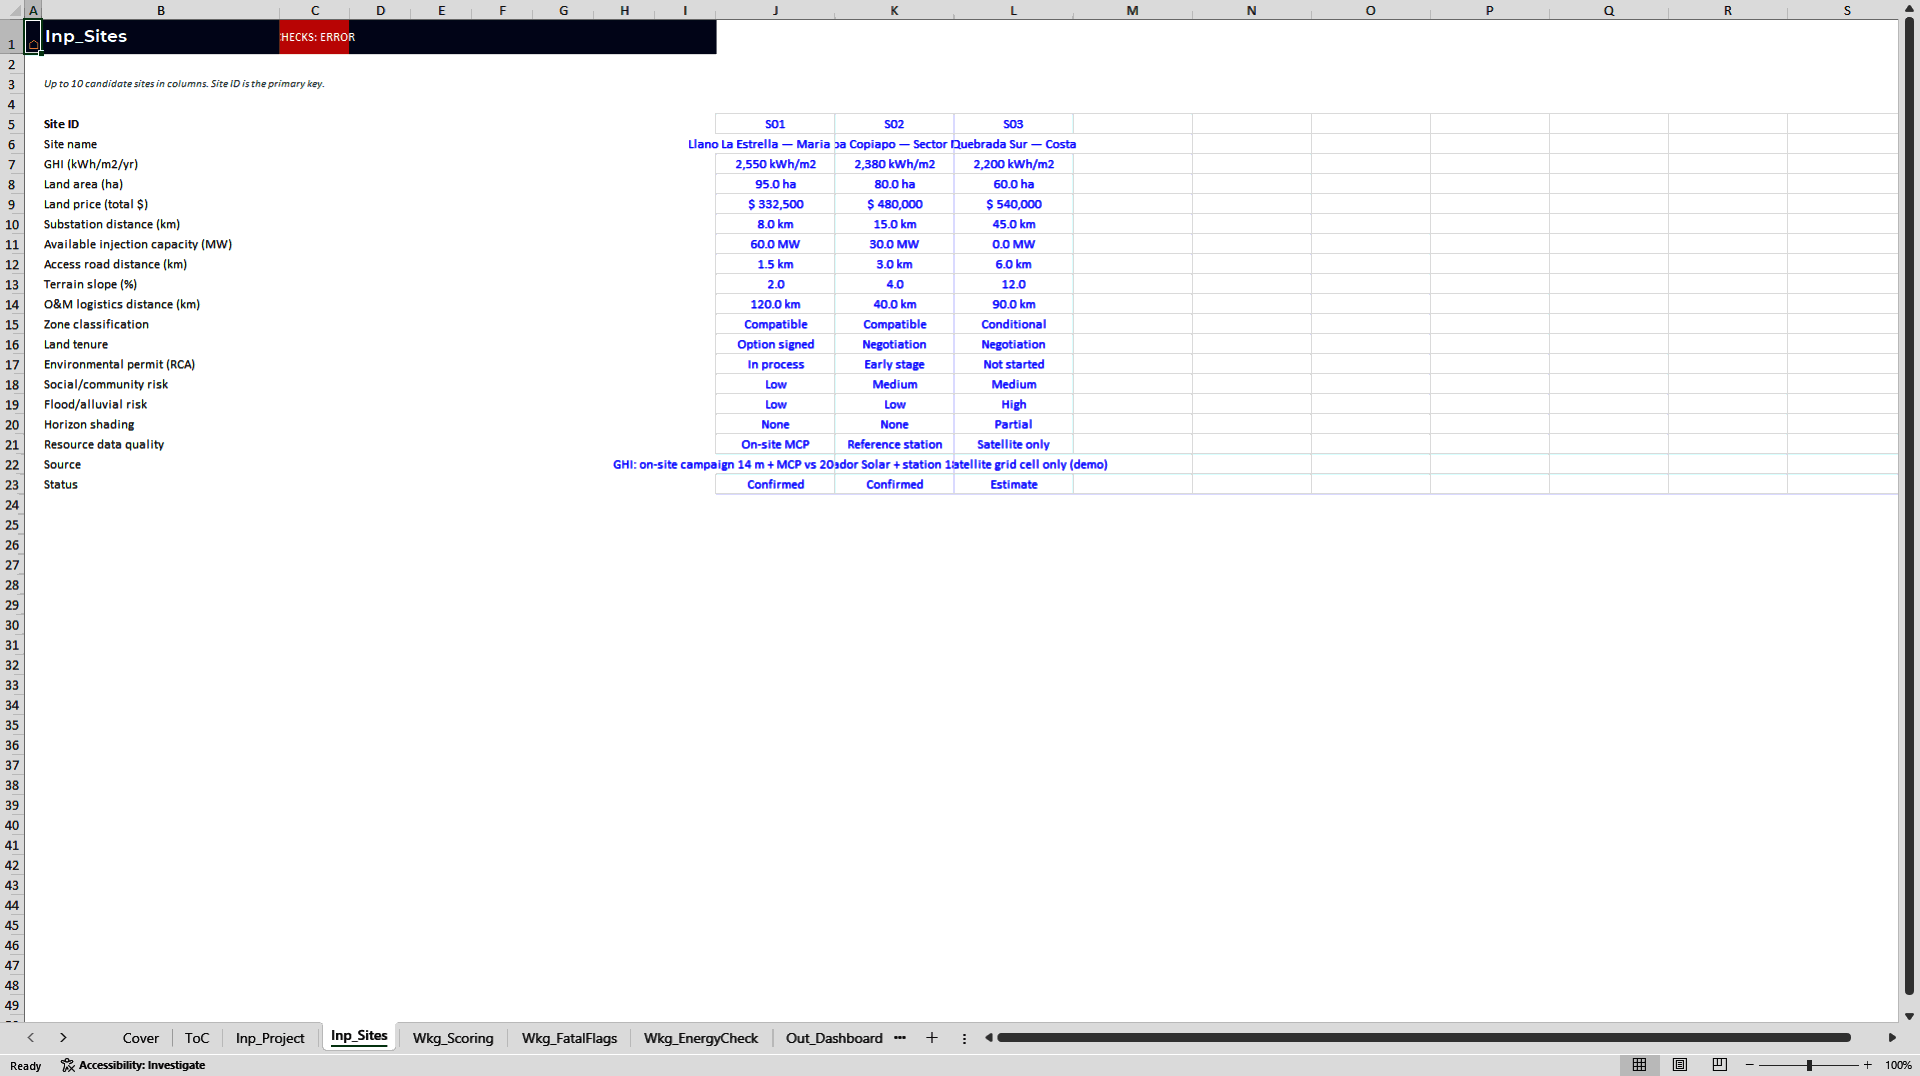
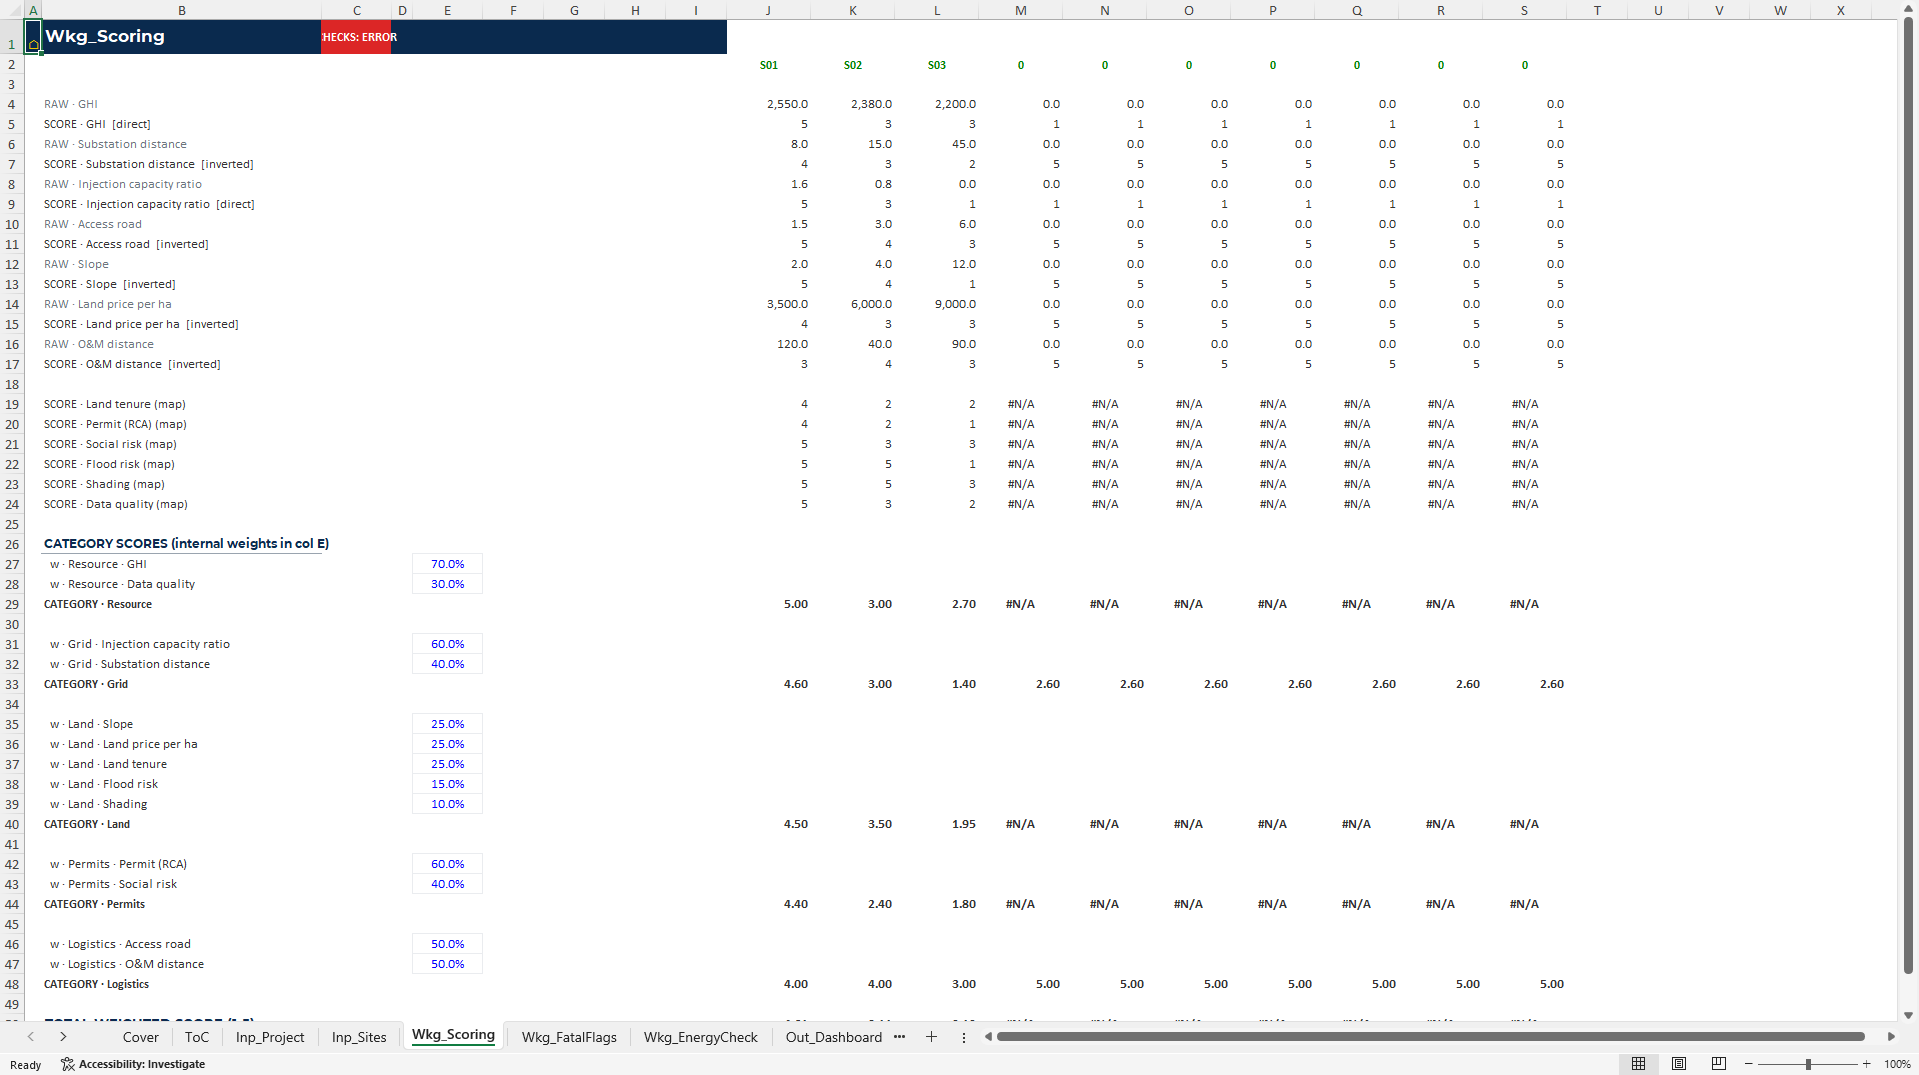
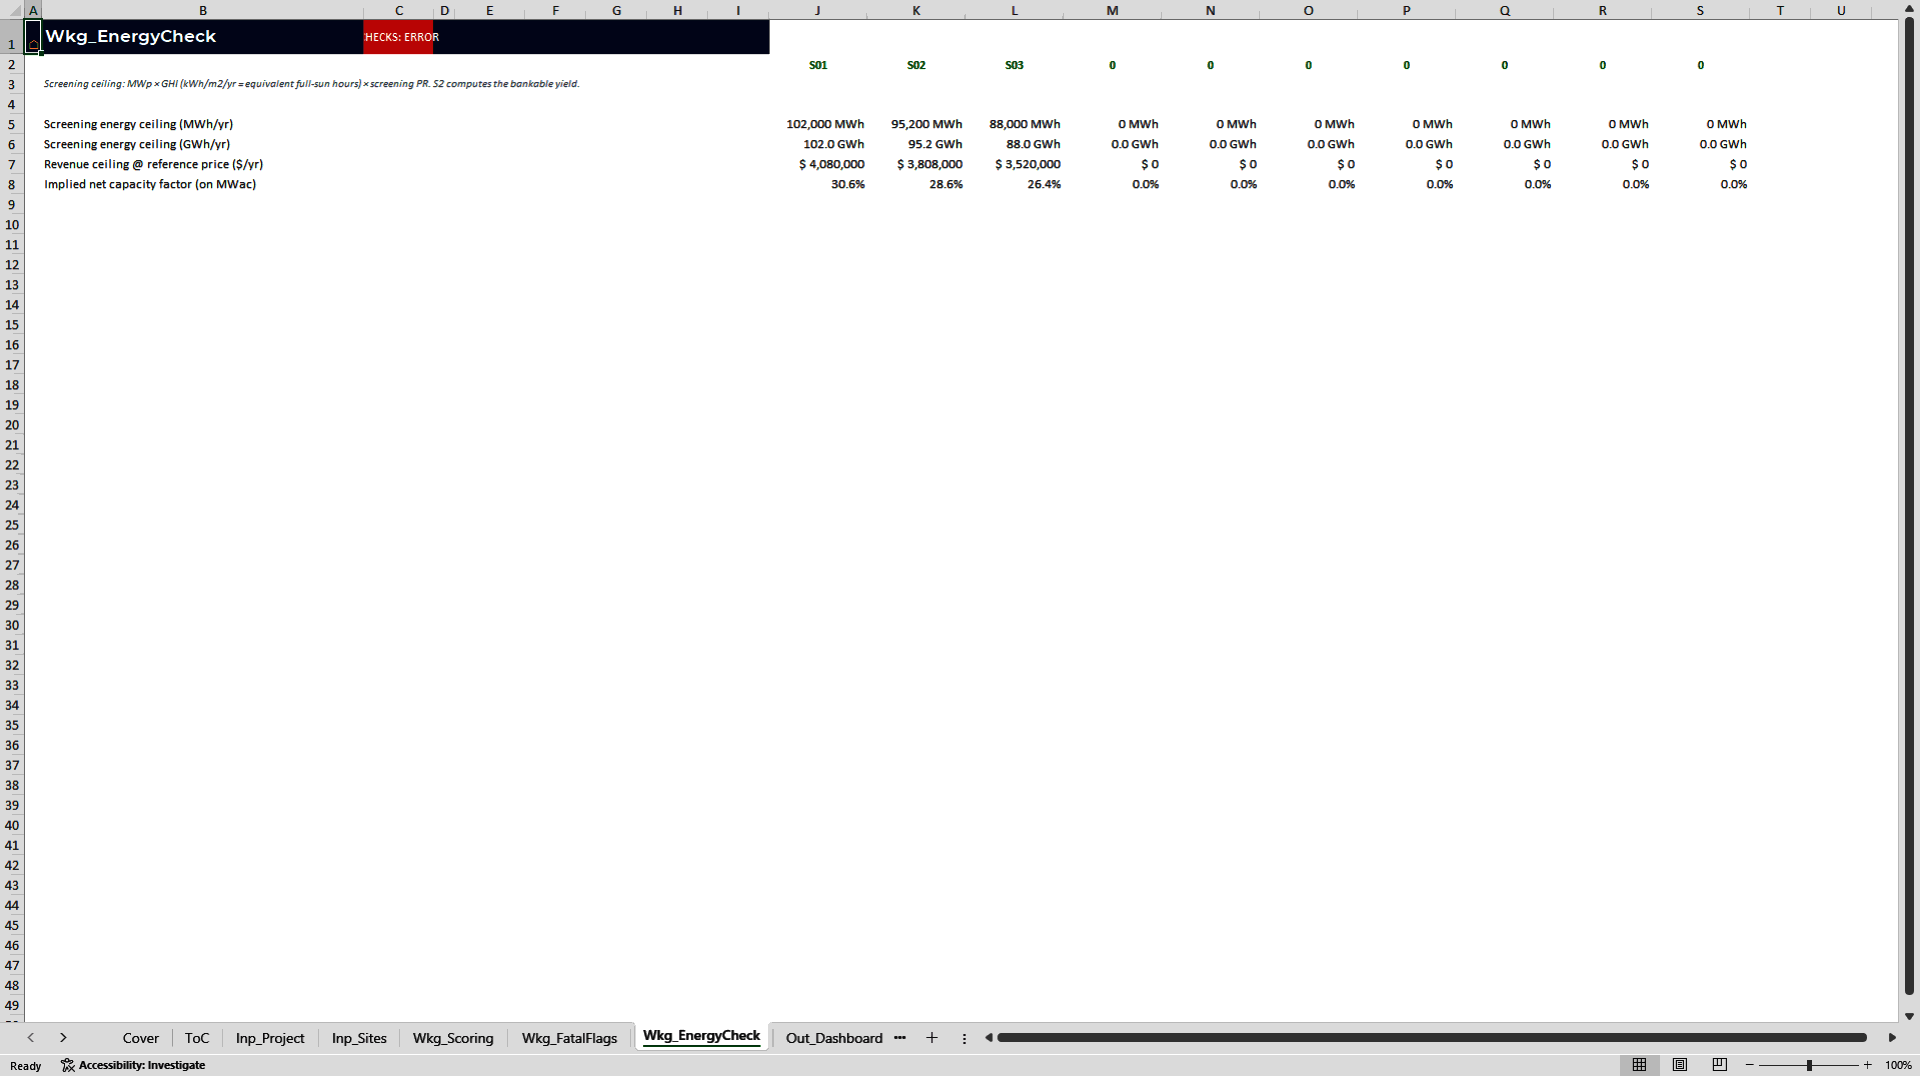
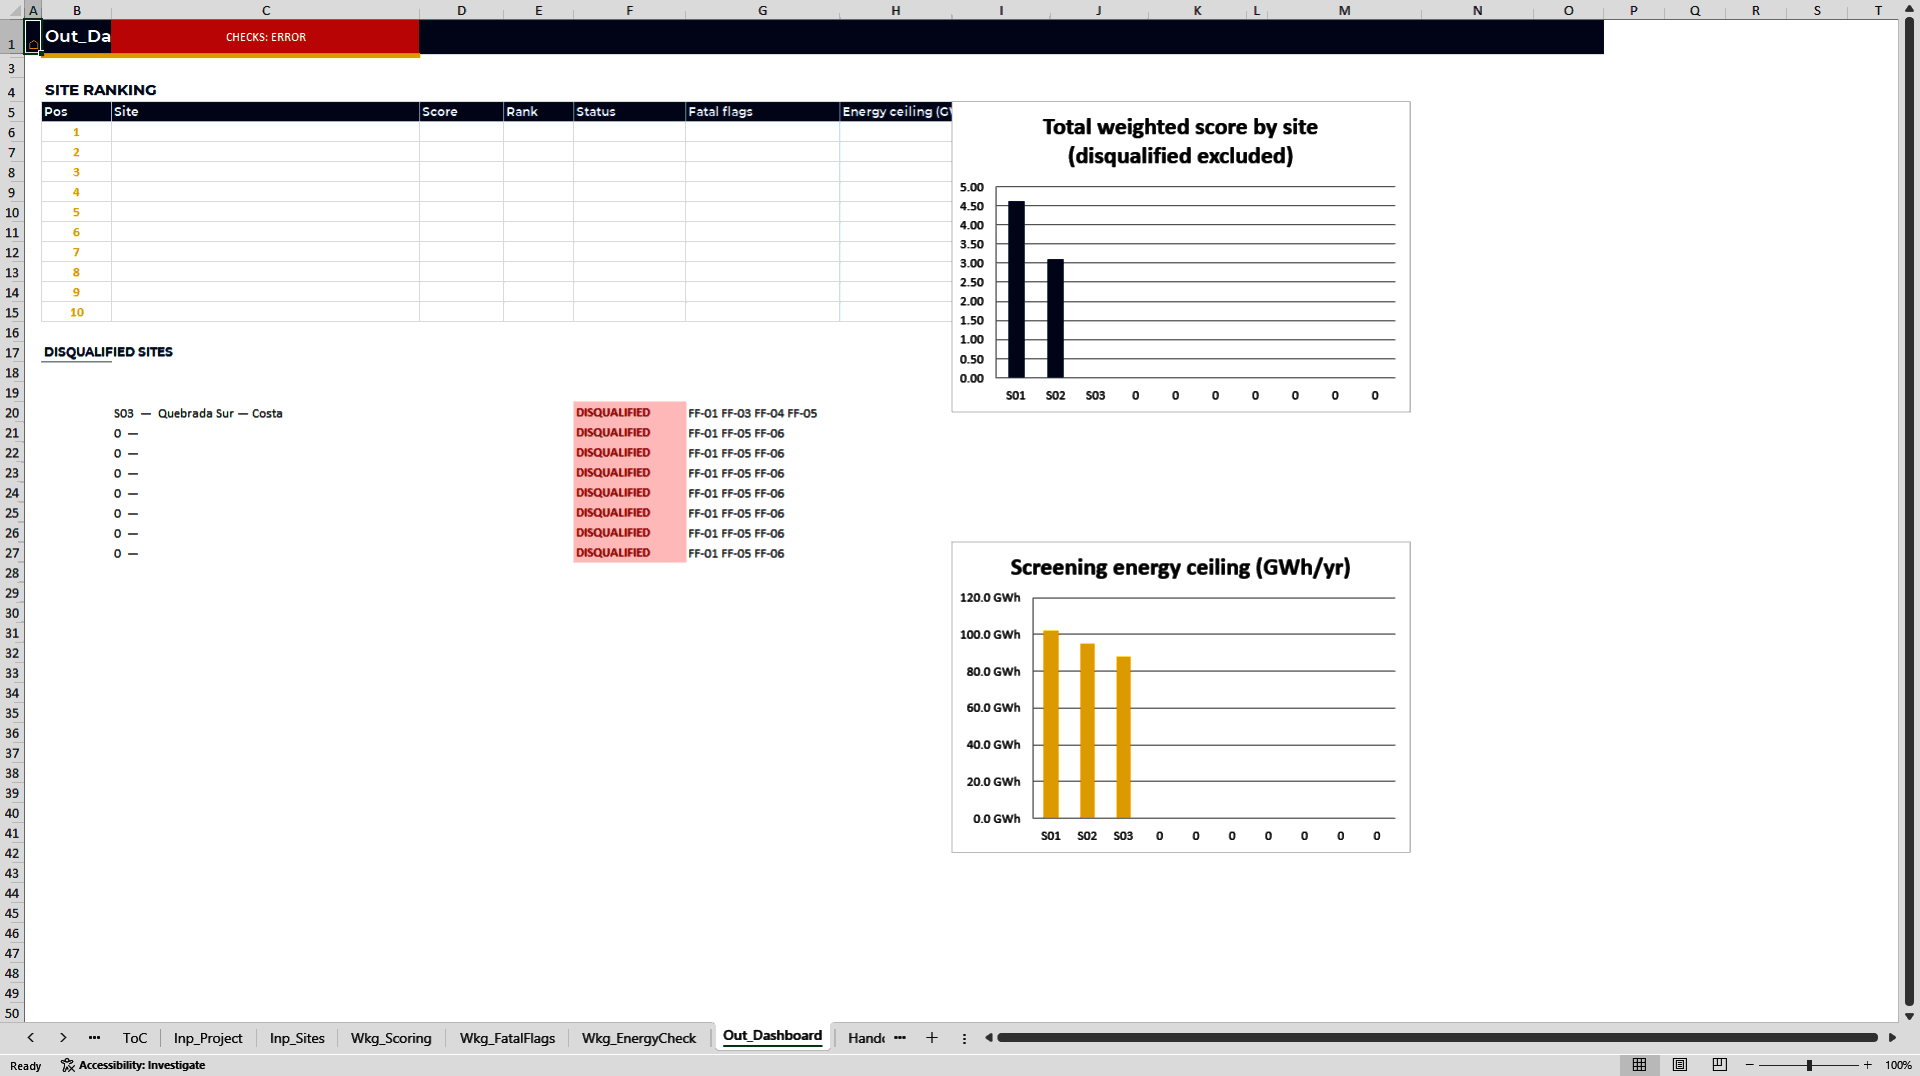
S1 – Site and Resource Screening. Ranks up to 10 candidate sites across 19 attributes grouped in 5 weighted categories, covering irradiance and resource-data quality, land price and tenure, terrain and slope, distance to substation and injection capacity, interconnection lead time, permitting complexity, water for module cleaning, natural hazards and community context. Six fatal flags stay separate from the score, so a site with no injection capacity or an alluvial flood risk is disqualified no matter how much sun it gets. Outputs a ranked scorecard, category profiles, and a screening energy ceiling that gives scale before any engineering exists.
S2 – Energy Yield Assessment. Builds 300 months of production from the ground up: monthly irradiance shares transposed to the plane of array, a performance ratio assembled from seven constant losses plus temperature and soiling seasonality, availability and curtailment multipliers, and degradation split between a first-year step and a linear rate. Above the engine sits the uncertainty block: resource and modelling sigma combined in quadrature, then converted through one-tailed normal scores into P75 and P90 exceedance factors. That distinction is where physics becomes finance, because equity plans on P50 while lenders size on P90, and better resource data measurably buys debt capacity.
S3 – CapEx and BOS Budget. Converts the plant into a 32-line budget across land, hard costs and soft costs, including modules, trackers, inverters, DC and AC balance of system, civil works, HV line and substation, EPC, owner's engineer, permits, insurance, contingency and development fee. Every line is then phased month by month over the construction window using straight-line, locked S-curve or manual milestone profiles. Each line closes to the cent through telescopic closure, the development fee prices on the budget excluding itself through exact algebra rather than iteration, and the monthly funding peak is visible before a lender asks about it.
S4 – Financial Model. Monthly construction, annual operations, twenty-five years. Equity-first funding, interest during construction accrued inside the window, financing fees and a six-month debt service reserve account funded at COD. Senior debt is sized at the lesser of the gearing cap and the present value of P90 cash available for debt service at the target coverage, then sculpted to hold that coverage flat and swept at maturity. Three parallel tax cascades with loss carry-forward price the equity case, the P90 base case that sizes the debt, and the unlevered case. The two genuine circularities, construction interest and debt sizing, are resolved through visible frozen quantities with a live drift check, never Excel iteration and never a macro. Reports equity and project IRR, minimum DSCR, LLCR, payback and NPV on a dated ledger, plus four two-dimensional sensitivity tables.
S5 – Comparison Dashboard. The committee room. Receives up to 12 sealed S4 runs, gates each one on presence, provenance, seal and three recomputed financial identities before it is allowed to compete, judges them against four explicit hurdles, ranks them with competition ranking, and prints a one-page decision card with a tornado showing whether structure, price or cost moves the return hardest. It never edits a run; the sheet is the decision record.
HOW THE CHAIN HOLDS
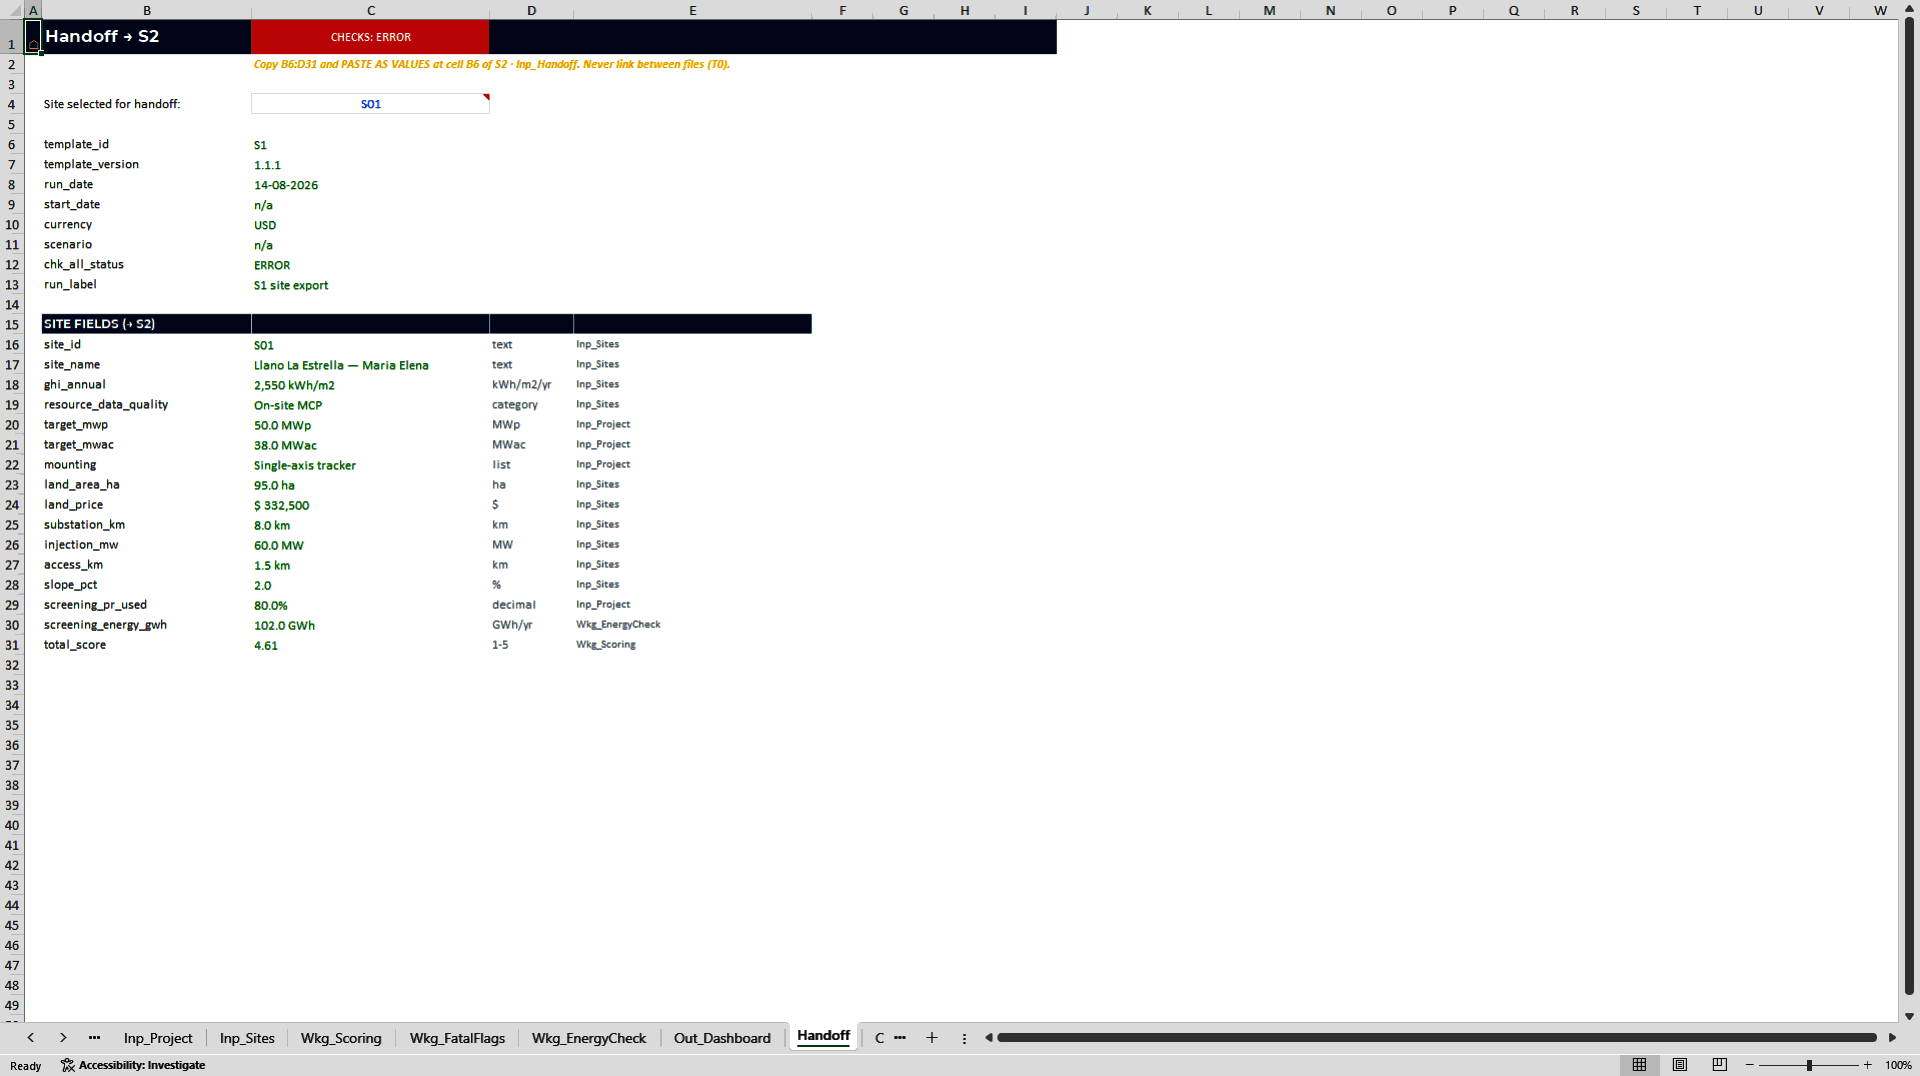
Nothing links live across workbooks. Each template composes a handoff block that you paste as values into the next, and the receiving file re-reads the header, that is template, version, currency, calendar, run label and master-check status, then recomputes physical identities on the pasted numbers themselves. Sixty-nine numbered checks with ERROR and WARNING severities guard the chain, including label-by-label paste alignment and provenance gates, so a stale, truncated or misaligned paste fails loudly instead of travelling downstream. The result is an audit artifact rather than a live web of links: the numbers the committee saw are the numbers in the file, permanently.
WHAT YOU RECEIVE
Five Excel workbooks (S1 to S5), a Master Guide covering the chain, scenario governance, the consolidated check catalogue and a full narrated pass end to end, and five dedicated user manuals, one per template. All files are built under the FAST Standard, that is Flexible, Appropriate, Structured and Transparent, with zero macros, no hidden logic, one formula per calculation row, colour-coded input, calculation and link cells, a documented Source and Status behind every input, pre-set print areas on every sheet, and a checks panel whose master light must read green before a handoff exists. Built for Excel 2019 or Microsoft 365. A complete worked demo, a 50 MWp single-axis tracker plant in the Atacama desert with a fifteen-year PPA and a merchant tail, ships loaded in all five files, so you learn the chain before touching your own data.
WHO IT IS FOR
Development leads and sponsors, yield engineers and technical advisors, cost estimators and procurement teams, project finance modellers, lenders' and investors' analysts underwriting renewable generation, and investment committee secretaries who need the decision documented rather than asserted.
WHAT IT IS NOT
This is a bankability-oriented underwriting and decision toolkit, not a substitute for due diligence. It does not replace an on-site measurement campaign, a PVsyst-class hourly simulation, geotechnical or title studies, detailed engineering, a signed EPC price, an independent engineer's report, a lender's own credit model or a tax opinion. Benchmark bands ship as sourced placeholders for you to confirm against current market evidence. It narrows, ranks, stress-tests and documents; the signature stays human.
Got a question about the product? Email us at support@flevy.com or ask the author directly by using the "Ask the Author a Question" form. If you cannot view the preview above this document description, go here to view the large preview instead.
Source: Best Practices in Solar Energy, Integrated Financial Model Excel: Solar PV Project Finance Suite (5 Models + 6 Manuals) Excel (XLSX) Spreadsheet, ExpertPro Consulting
ABOUT THE AUTHOR

ExpertPro is an advisory firm that builds the financial and decision infrastructure behind capital projects. Our work sits at the intersection of project finance, engineering economics and data: we model, stress-test and document infrastructure investments so that sponsors, lenders and investment committees can decide on evidence rather than intuition.
The practice is led by Eduard Kofman, .
... [read more]
Ask the Author a Question
You must be logged in to contact the author.




























