
Shipping Vessel Operator 10-Year 3 Statement Financial Model – Excel XLSX
Excel (XLSX)
BENEFITS OF THIS DOWNLOADABLE EXCEL DOCUMENT
- Provides a comprehensive framework for modeling the financial performance of a vessel operating company across fleet expansion, charter revenue, voyage costs, and capital structure over a 10-year horizon.
- Enables shipowners, maritime investors, and finance teams to evaluate fleet growth, charter strategies, bunker fuel exposure, and vessel financing with institutional-grade financial projections.
- Supports data-driven decision-making for maritime businesses by integrating fleet operations, voyage economics, capital expenditures, and debt financing into a fully linked financial model.
SHIPPING INDUSTRY EXCEL DESCRIPTION
Curated by McKinsey-trained Executives
🚢 Shipping Vessel Operator Financial Model – Institutional-Grade 10-Year Excel Pro Forma for Fleet Owners, Maritime Investors & Ship Finance Teams
The Ultimate Financial Model for Shipowners, Fleet Operators, Maritime Private Equity & Vessel Finance Professionals
Stop pricing charter contracts based on gut feeling.
Stop pitching maritime investors with back-of-napkin freight margin math.
Stop underestimating bunker fuel volatility, drydock timing, and off-hire cash drag.
Stop losing money because your projections ignored vessel utilization ramp curves, straight-line depreciation compounding on a 25-year asset life, and payment retention cycles across bulk, container, and tanker fleets.
If you are launching a vessel operating company, scaling a multi-vessel maritime platform, entering new trade routes, raising a shipping fund, or financing a newbuild program with bank debt – your financial model is not "just a spreadsheet."
It is your:
• #1 Maritime Investor Pitch Weapon
• Ship Finance & Vessel Mortgage Approval Tool
• Charter Rate & Fleet Utilization Optimizer
• Project-Level Voyage P&L Command Center
• Multi-Fleet Expansion & Trade Route Roadmap
This model gives you – fully built, fully formula-driven – exactly what ship finance banks, maritime private equity firms, infrastructure funds, bonding agencies, and serious vessel operators expect to see in a professional shipping business plan and financial projection package.
💼 What You Get
✅ 10-Year Fully Integrated 3-Statement Financial Model – Revenue scaling from $88M (Year 1) to $641M (Year 10)
✅ Annual Forecasts with Operational-Grade Granularity – Every number driven by real vessel-level economics
✅ Fleet Acquisition Engine – Starting fleet of 5 vessels scaling to 24 vessels across Bulk Carriers, Container Vessels & Tankers
✅ Revenue Segmented by Contract Type – Time Charter, Spot Market Voyages & COA / Strategic Contracts (60% / 25% / 15% blended mix)
✅ Revenue Segmented by Vessel Class – Bulk Carrier ($28,000/day), Container ($42,000/day) & Tanker ($35,000/day) charter rates with 4% annual escalation
✅ Demurrage Revenue, Fuel Surcharge, Container Leasing & Ancillary Income Modeling – 4 discrete ancillary revenue streams
✅ Bunker Fuel Cost Engine – Laden vs. ballast consumption separately modeled (28 vs. 22 tons/day) against live fuel price escalation at $550/ton base
✅ Vessel Operating Cost Breakdown – Crew wages, P&I + hull insurance ($850K/vessel/year), maintenance, lubricants & drydock overhaul every 5 years ($3.5M per event)
✅ Voyage Expense Schedule – Port charges ($38K/voyage), canal transit fees ($12K), cargo handling, agency fees & broker commissions (2.5% of revenue)
✅ Fleet Utilization Model – Available days (365) minus off-hire (12 days) minus drydock (5 days) = 348 net days, ramping from 82% utilization in Year 1 to 90% base rate
✅ PP&E Rollforward with Straight-Line Vessel Depreciation – 25-year useful life, 10% residual value, 3.6% annual depreciation rate on $300M+ opening gross PP&E
✅ Working Capital Schedule – Accounts receivable (35-day DSO), spare parts inventory (30-day turns), accounts payable (45-day DPO) & accrued expenses
✅ Vessel Loan Amortization Schedule – 70% LTV vessel mortgage financing, 15-year debt tenor, 1-year grace period, 4.8% interest, straight-line amortization with DSCR monitoring
✅ Investor-Ready Income Statement – Revenue → Gross Profit → EBITDA → EBIT → Net Income with NOL protection in early-fleet ramp years
✅ Cash Flow Statement – Indirect method, CFO + CFI + CFF, ending cash ties directly to Balance Sheet every year
✅ Balance Sheet – Dynamically balances to zero across all 10 years
✅ Scenario & Sensitivity Analysis – 6 named scenarios + charter rate × utilization sensitivity matrix with conditional color-scale heatmap
✅ Executive Dashboard – 12 live KPI cards, 4 embedded charts and 6 covenant alert cells – all updating automatically
✅ Blue-Coded Assumptions Engine – Change one cell, entire 10-year model recalculates instantly
This is not a generic shipping spreadsheet.
This is a complete maritime financial planning system built for real-world vessel unit economics and institutional capital raising.
🎯 Who This Is For
• First-time shipowners launching a vessel operating company
• Multi-fleet maritime operators scaling bulk, container and tanker divisions simultaneously
• Ship management companies building investor-grade financial packages for capital partners
• Dry bulk, container and tanker fleet operators entering new trade lanes
• Maritime private equity firms evaluating fleet acquisitions and shipping platform roll-ups
• Infrastructure and transportation funds adding maritime exposure to their portfolio
• Ship finance banks, export credit agencies and vessel mortgage lenders requiring financial proof packages
• Series A & Series B fundraising teams in the maritime and ocean freight vertical
• Shipbrokers and charter managers building investor decks for vessel financing mandates
• Accelerators and incubators backing next-generation maritime logistics platforms
• SBA, bonding agency and commercial bank loan applicants in the shipping sector
• Public-private partnership developers structuring port and maritime infrastructure projects
If you own vessels, operate fleets, charter ships, or run contract-driven maritime revenue businesses – this model was built for you.
🔥 Why Most Shipping Financial Models Fail
Most templates rely on:
• Simple "Revenue = Vessels × Charter Rate × Days" with zero operational logic beneath the surface
• No fleet utilization ramp curve for new vessel deliveries and first-year off-hire reality
• No contract type split between time charter, spot market, and COA book – just one blended rate
• No bunker fuel model with laden vs. ballast consumption split and live fuel price escalation
• No drydock event timing, per-vessel overhaul cost, or regulatory compliance CapEx schedule
• No vessel-class-level charter rate differentiation between bulk, container and tanker assets
• No demurrage, fuel surcharge, or container leasing as separate revenue line items
• No PP&E rollforward or straight-line vessel depreciation schedule across a 25-year asset life
• No working capital modeling for accounts receivable, spare parts inventory and AP payment timing
• No equity round or vessel financing integration with LTV covenant monitoring
• No DSCR tracking against debt service obligations across new loan tranches
• No multi-class fleet expansion schedule with per-vessel acquisition pricing and CapEx escalation
• No sensitivity matrix stress-testing charter rates against utilization simultaneously
This model fixes all of that – from the ground up.
📊 What's Inside – Every Major Component
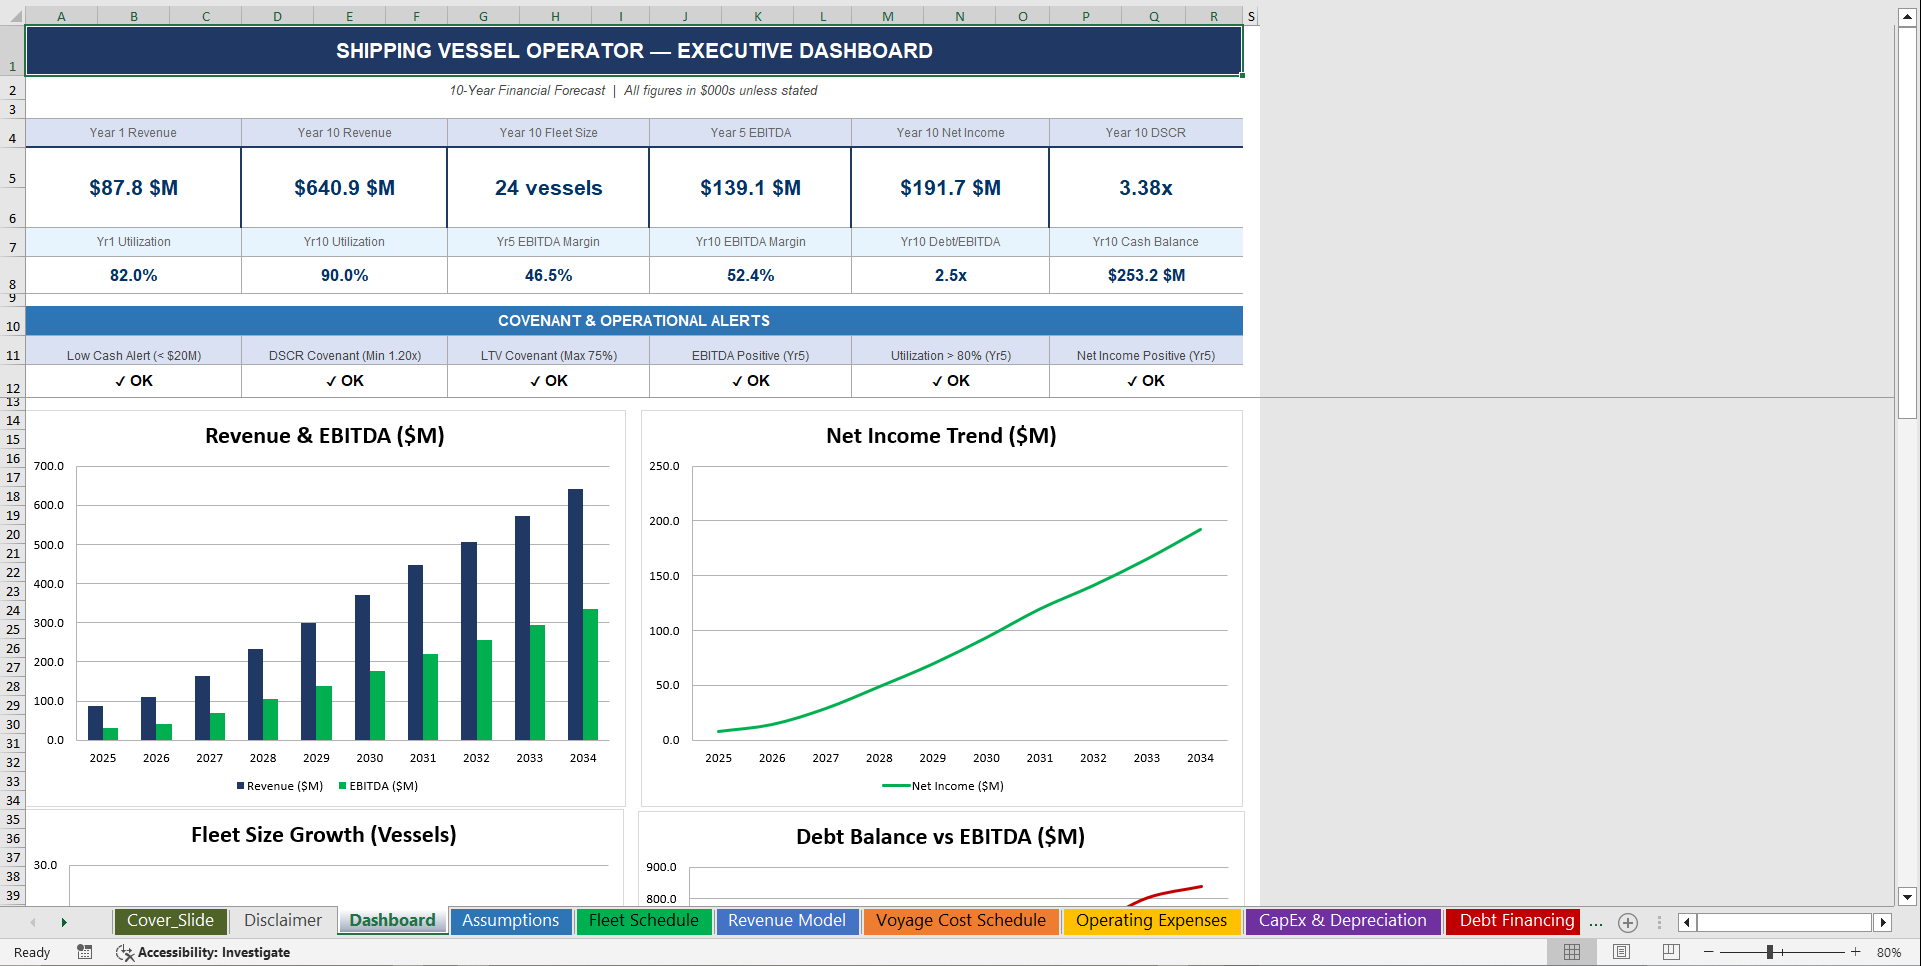
1️⃣ Executive Dashboard
Instant investor snapshot including:
• Total Revenue scaling from $88M (Year 1) to $641M (Year 10) – 7.3× growth over the forecast period
• Gross Profit & Gross Margin % by Year – expanding from 50.1% to 57.8% as fleet scales
• EBITDA & EBITDA Margin % by Year – growing from $30M at 34.6% (Year 1) to $336M at 52.4% (Year 10)
• Net Income & Net Margin % by Year – $8M (Year 1) to $192M (Year 10), positive throughout
• Ending Cash Balance & Cash Runway across all 10 forecast years
• Fleet Size: 5 vessels (Year 1) to 24 vessels (Year 10) with vessel type breakdown
• Vessel Utilization Rate: ramping from 82% (Year 1) to 90% base as operations mature
• Average Charter Rate by vessel class – Bulk $28K, Container $42K, Tanker $35K per day
• DSCR monitoring – 3.01× (Year 1) with covenant floor at 1.20×
• Debt/EBITDA ratio, LTV covenant status, and interest coverage live from model
• 4 fully embedded charts: Revenue & EBITDA bar, Net Income trend line, Fleet growth bar, Debt vs. EBITDA line
Built for pitch decks, bank meetings, ship finance due diligence, bonding agency approval packages and board presentations.
2️⃣ Assumptions Engine – Single Source of Truth
Centralized input section controlling the entire model. Change one blue cell. Every number across all 13 sheets recalculates instantly.
Includes:
• Fleet expansion plan – new vessel acquisitions by year (0 → 2 → 3 → 3 → 2 → 3 → 3 → 2 → 3 → 2 across the decade)
• Vessel retirement and disposal schedule with 10% residual value recovery
• Available operating days per vessel (365) minus off-hire days (12) minus drydock days (5) = 348 net available days
• Utilization rate ramp: 82% Year 1 to 90% base target, with linear interpolation logic
• Time charter rate by vessel class with 4% annual escalation built in
• Charter contract mix: 60% time charter / 25% spot / 15% COA – adjustable by year
• Demurrage revenue as % of voyage revenue (3%)
• Ancillary revenue as % of charter revenue (2%)
• Bunker fuel: $550/ton base, 2% annual escalation, 28 tons/day laden vs. 22 tons/day ballast, 55% laden ratio
• Crew cost: $2,800/vessel/day
• P&I + hull & machinery insurance: $850,000/vessel/year
• Maintenance: $1,100/vessel/day
• Lubricants & consumables: $280/vessel/day
• Drydock: $3.5M per event every 5 years
• Port charges: $38,000/voyage at 18 voyages/vessel/year
• Canal transit: $12,000/voyage (Suez/Panama blended average)
• Broker commissions: 2.5% of revenue
• Newbuild vessel pricing: Bulk $55M, Container $80M, Tanker $65M with 2.5% CapEx escalation
• Infrastructure & IT CapEx: $2M Year 1 growing at 5% per year
• Vessel loan: 70% LTV, 4.8% interest rate, 15-year tenor, 1-year principal grace period
• Fleet management salaries: $3.5M Year 1 with 4% annual OpEx growth
• Commercial & chartering team: $2.2M Year 1
• G&A: $4.0M Year 1
• Tax rate: 20% with zero tax in loss periods
• DSO: 35 days | DPO: 45 days | Inventory turns: 30 days
• WACC / discount rate: 9%
3️⃣ Fleet & Vessel Schedule
Structured for real maritime scaling:
• Opening fleet, new vessel additions, retirements and closing fleet by year
• Average fleet (opening + closing / 2) – the correct basis for all operating day calculations
• Vessel type mix: Bulk Carriers (50%), Container Vessels (30%), Tankers (20%) of closing fleet
• Net available days per vessel: 348 days (365 minus 12 off-hire minus 5 drydock)
• Effective operating days per vessel: net available days × utilization rate
• Total fleet operating days: average fleet × effective operating days per vessel
• Fuel price roll-forward at 2% annual escalation
• Laden days vs. ballast days fleet total – separately calculated
• Total fuel consumption in tons: laden tons + ballast tons
• Total Fuel Cost ($M) – fully linked to Voyage Cost Schedule and Income Statement
Know exactly how many revenue-generating days your fleet will produce before committing to a single charter contract.
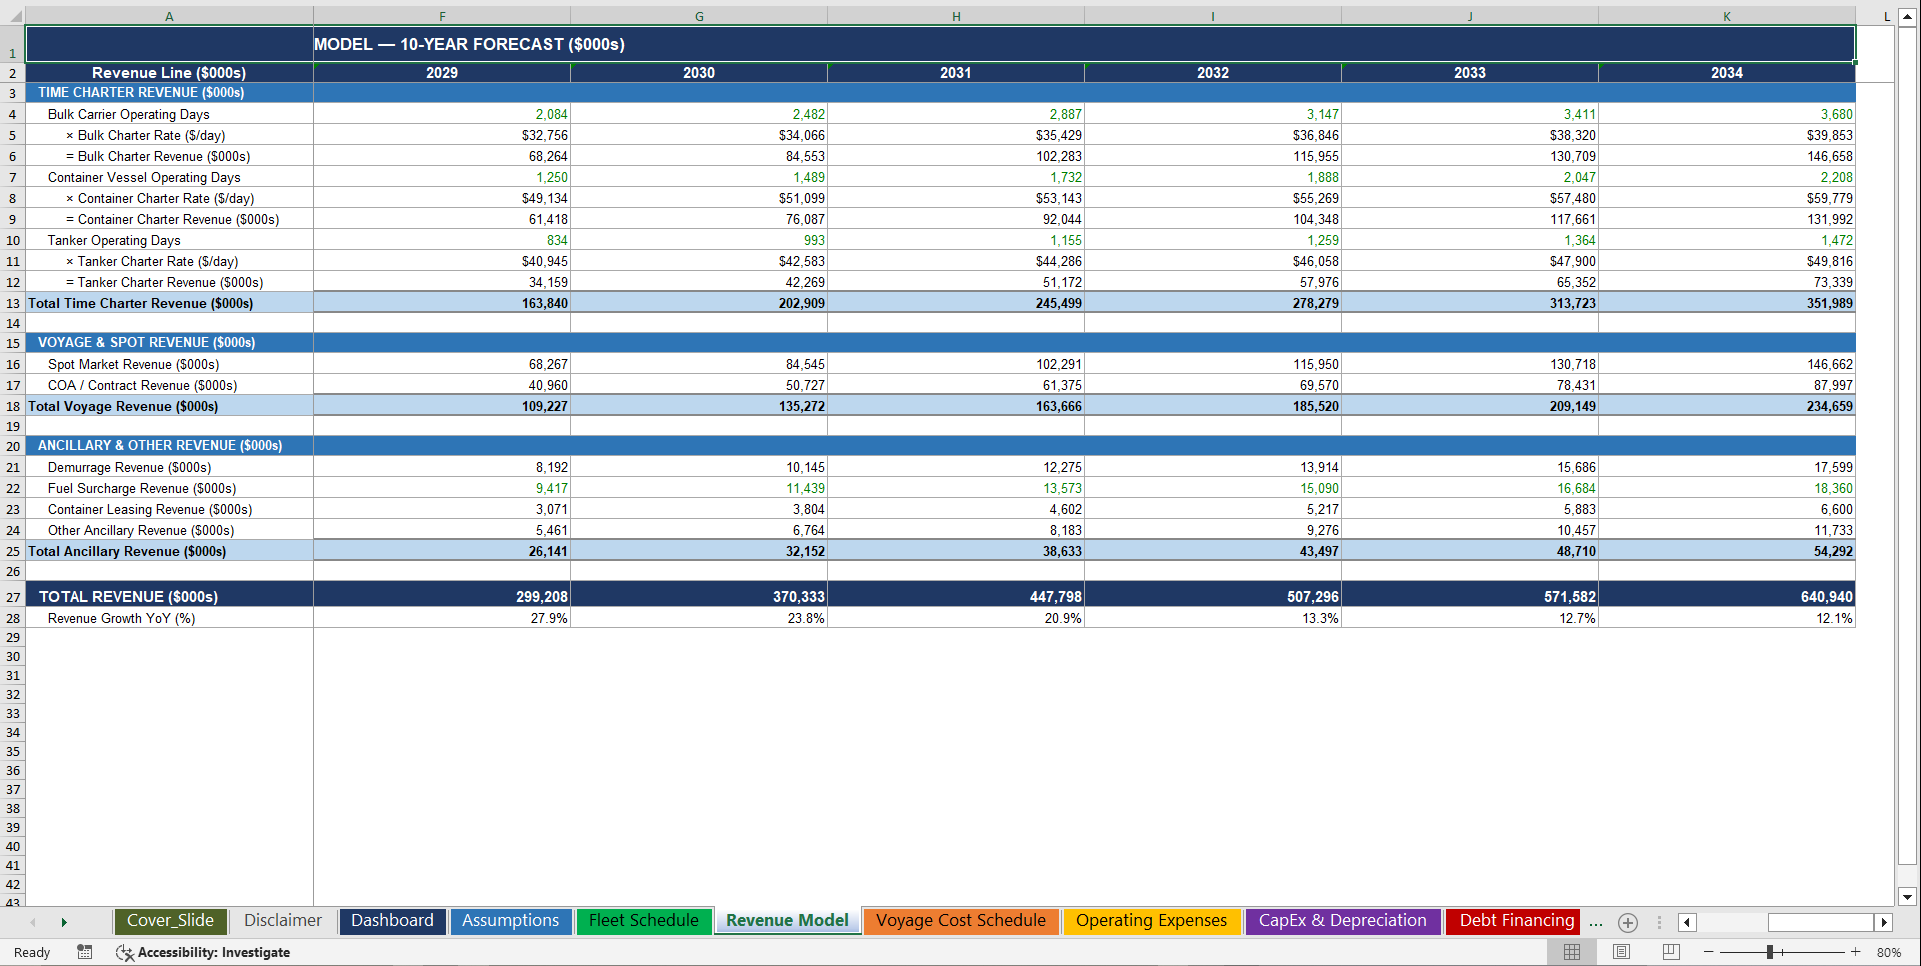
4️⃣ Revenue Model – Built Like a Real Shipping Company
The model does not use "Revenue = Vessels × Rate." It builds revenue from the vessel level up:
Time Charter Revenue (the primary engine):
• Bulk Carrier operating days × $28,000/day (escalating 4% p.a.) = Bulk Charter Revenue
• Container Vessel operating days × $42,000/day (escalating 4% p.a.) = Container Charter Revenue
• Tanker operating days × $35,000/day (escalating 4% p.a.) = Tanker Charter Revenue
• Year 1 Time Charter Revenue: $47.9M
Voyage & Spot Revenue:
• Spot Market Revenue – proportional to time charter book at 25%/60% mix ratio
• COA / Strategic Contract Revenue – proportional to time charter book at 15%/60% mix ratio
• Year 1 Total Voyage Revenue: $32.0M
Ancillary Revenue (4 streams):
• Demurrage Revenue: 3% of total voyage revenue
• Fuel Surcharge Revenue: 15% of total fuel cost passed through to charterers
• Container Leasing Revenue: 5% of container charter revenue
• Other Ancillary Revenue: 2% of total charter revenue
• Year 1 Total Ancillary Revenue: $7.9M
Total Revenue: $87.8M (Year 1) → $640.9M (Year 10)
This allows you to stress-test fleet size, charter rate assumptions, contract type mix, and ancillary revenue streams independently before signing a single charter party agreement.
5️⃣ Voyage Cost Schedule & COGS – Real Vessel-Level Profitability
Track real profitability at the voyage and vessel level:
Vessel Operating Costs:
• Crew Wages & Benefits – $2,800/vessel/day × total fleet operating days, inflation-escalated annually
• Vessel Insurance (P&I + Hull & Machinery) – $850,000/vessel/year × average fleet
• Maintenance & Repairs – $1,100/vessel/day × total fleet operating days
• Lubricants & Consumables – $280/vessel/day × total fleet operating days
• Drydock & Overhaul – $3.5M/event ÷ 5-year cycle × average fleet
• Year 1 Total Vessel Operating Costs: $13.7M
Voyage Expenses:
• Bunker Fuel – $19.9M (Year 1), fully driven by laden/ballast consumption model
• Port Charges – $38K/voyage × 18 voyages × average fleet
• Canal Transit Fees – $12K/voyage × 18 voyages × average fleet
• Cargo Handling Costs – 4% of total revenue
• Agency Fees & Commissions – 2.5% of revenue
• Year 1 Total Voyage Expenses: $30.1M
Total COGS: $43.8M (Year 1) → $270.3M (Year 10)
Gross Profit: $44.0M (Year 1) → $370.6M (Year 10)
Gross Margin: 50.1% expanding to 57.8%
Stop guessing your vessel unit economics. Know them cold.
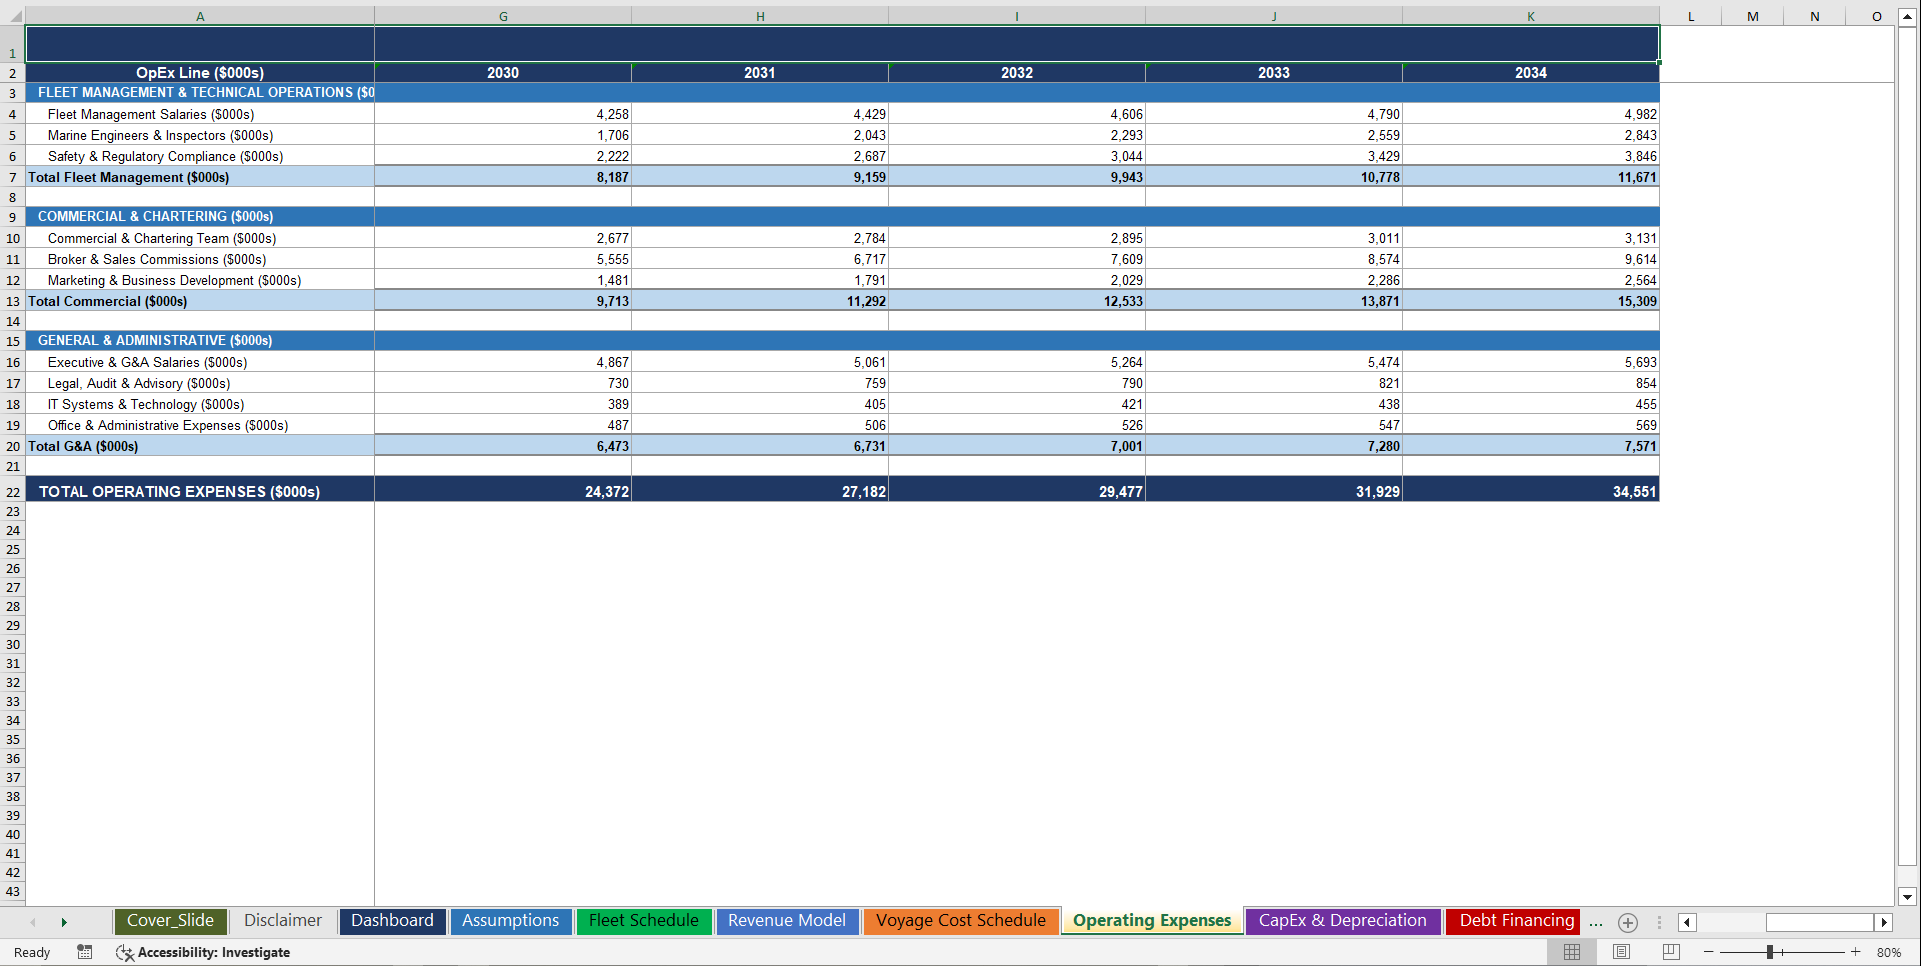
6️⃣ Operating Expenses – Fully Built, Fully Linked
Fleet management and commercial headcount is your largest controllable cost. This model tracks every dollar:
• Fleet Management & Technical Operations team salaries – $3.5M Year 1 growing at 4% p.a.
• Marine Engineers & Inspectors – per average vessel, inflation-escalated
• Safety & Regulatory Compliance – 0.6% of revenue
• Commercial & Chartering Team – $2.2M Year 1 growing at 4% p.a.
• Broker & Sales Commissions – 1.5% of revenue
• Marketing & Business Development – 0.4% of revenue
• Executive & G&A Salaries – $4.0M Year 1 growing at 4% p.a.
• Legal, Audit & Advisory – 15% of G&A base
• IT Systems & Technology – 8% of G&A base
• Office & Administrative Expenses – 10% of G&A base
• Year 1 Total Operating Expenses: $13.6M
• Year 10 Total Operating Expenses: $48.7M (absorbing scale cost growth while EBITDA margin expands to 52.4%)
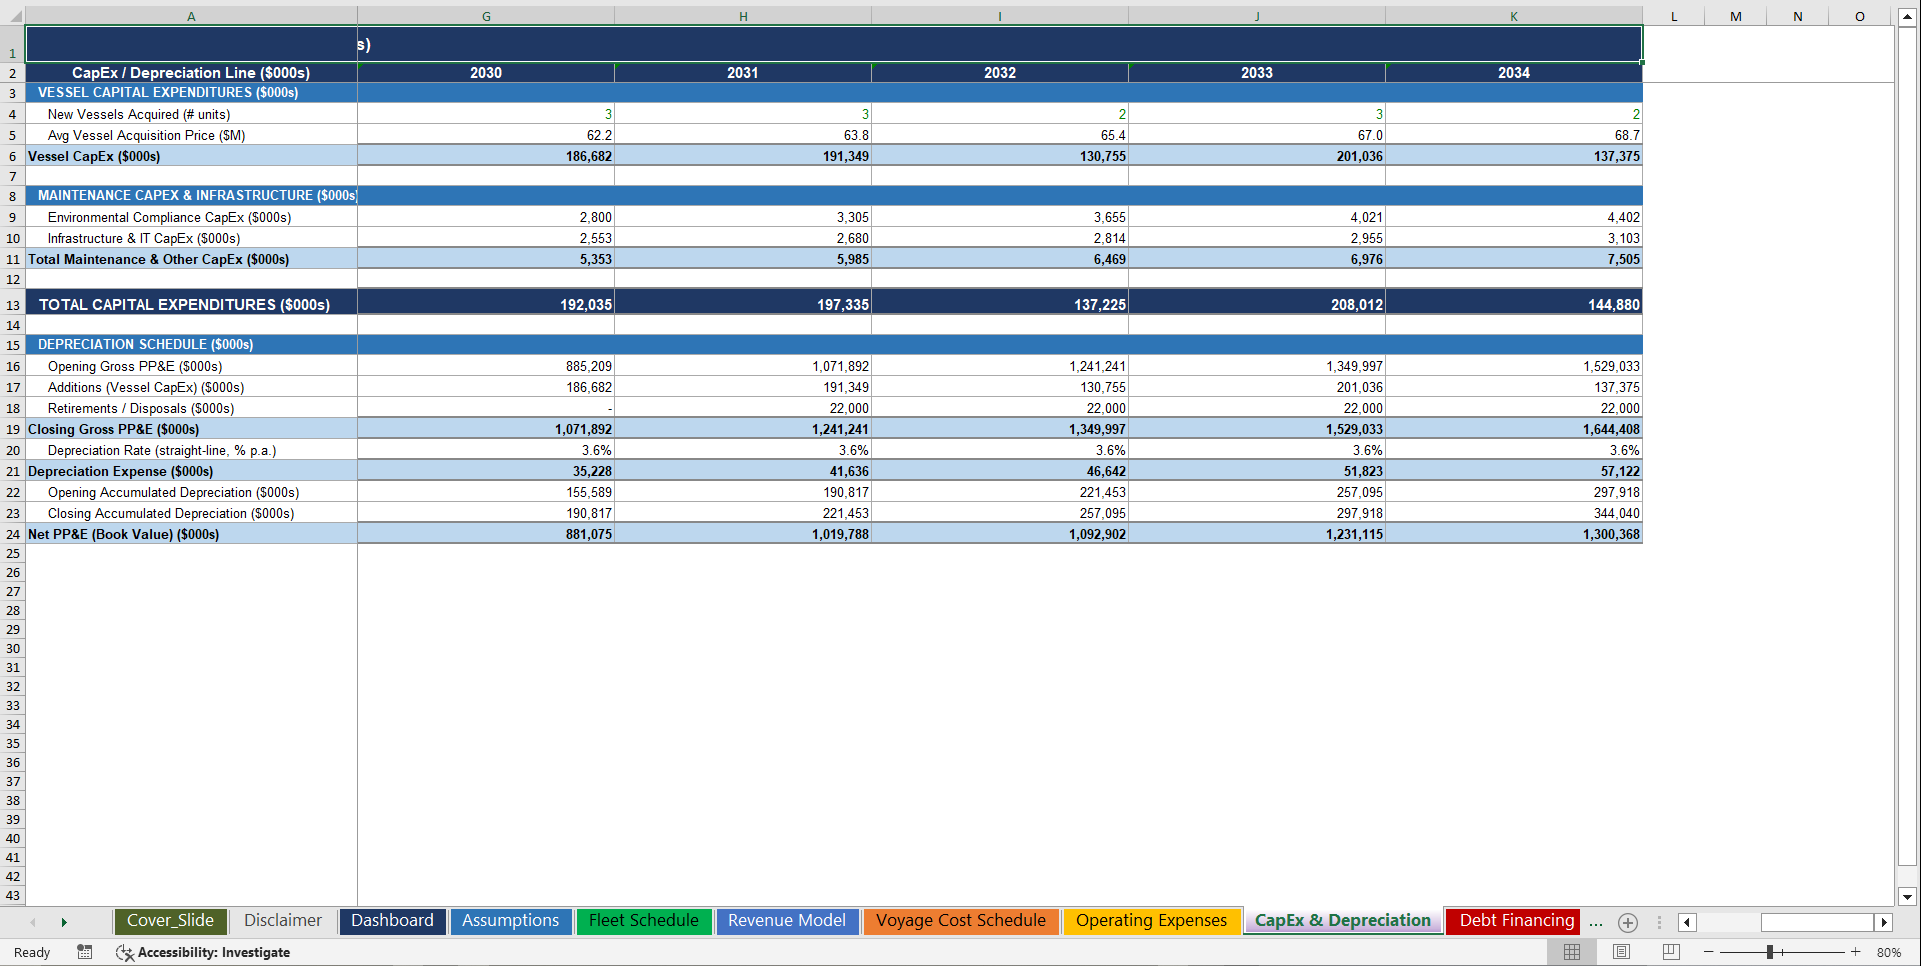
7️⃣ CapEx & Depreciation Schedule
Institutional-grade asset tracking:
Vessel Capital Expenditures:
• New vessel acquisition costs per year at $55M (Bulk), $80M (Container), $65M (Tanker) – with 2.5% annual CapEx escalation
• Vessel CapEx scales from $0 (Year 1, fleet already operational) to $165M+ in peak acquisition years
• Environmental compliance upgrades – $150/vessel/year in average fleet, inflation-escalated
• Infrastructure & IT CapEx – $2.0M Year 1, growing 5% per year
PP&E Rollforward:
• Opening Gross PP&E: $300M (5 vessels × $60M average)
• Additions from newbuild acquisitions roll into gross PP&E each year
• Retirements at 40% of $55M carrying value when vessels are sold
• Straight-line depreciation: 3.6% per year (25-year life, 10% residual value)
• Year 1 Depreciation: $10.8M → Year 10 Depreciation: $57.1M
• Net PP&E: $229M (Year 1) → $1.3B (Year 10) as fleet doubles in value
Know exactly how much capital you need before signing your next shipbuilding contract or second-hand vessel purchase agreement.
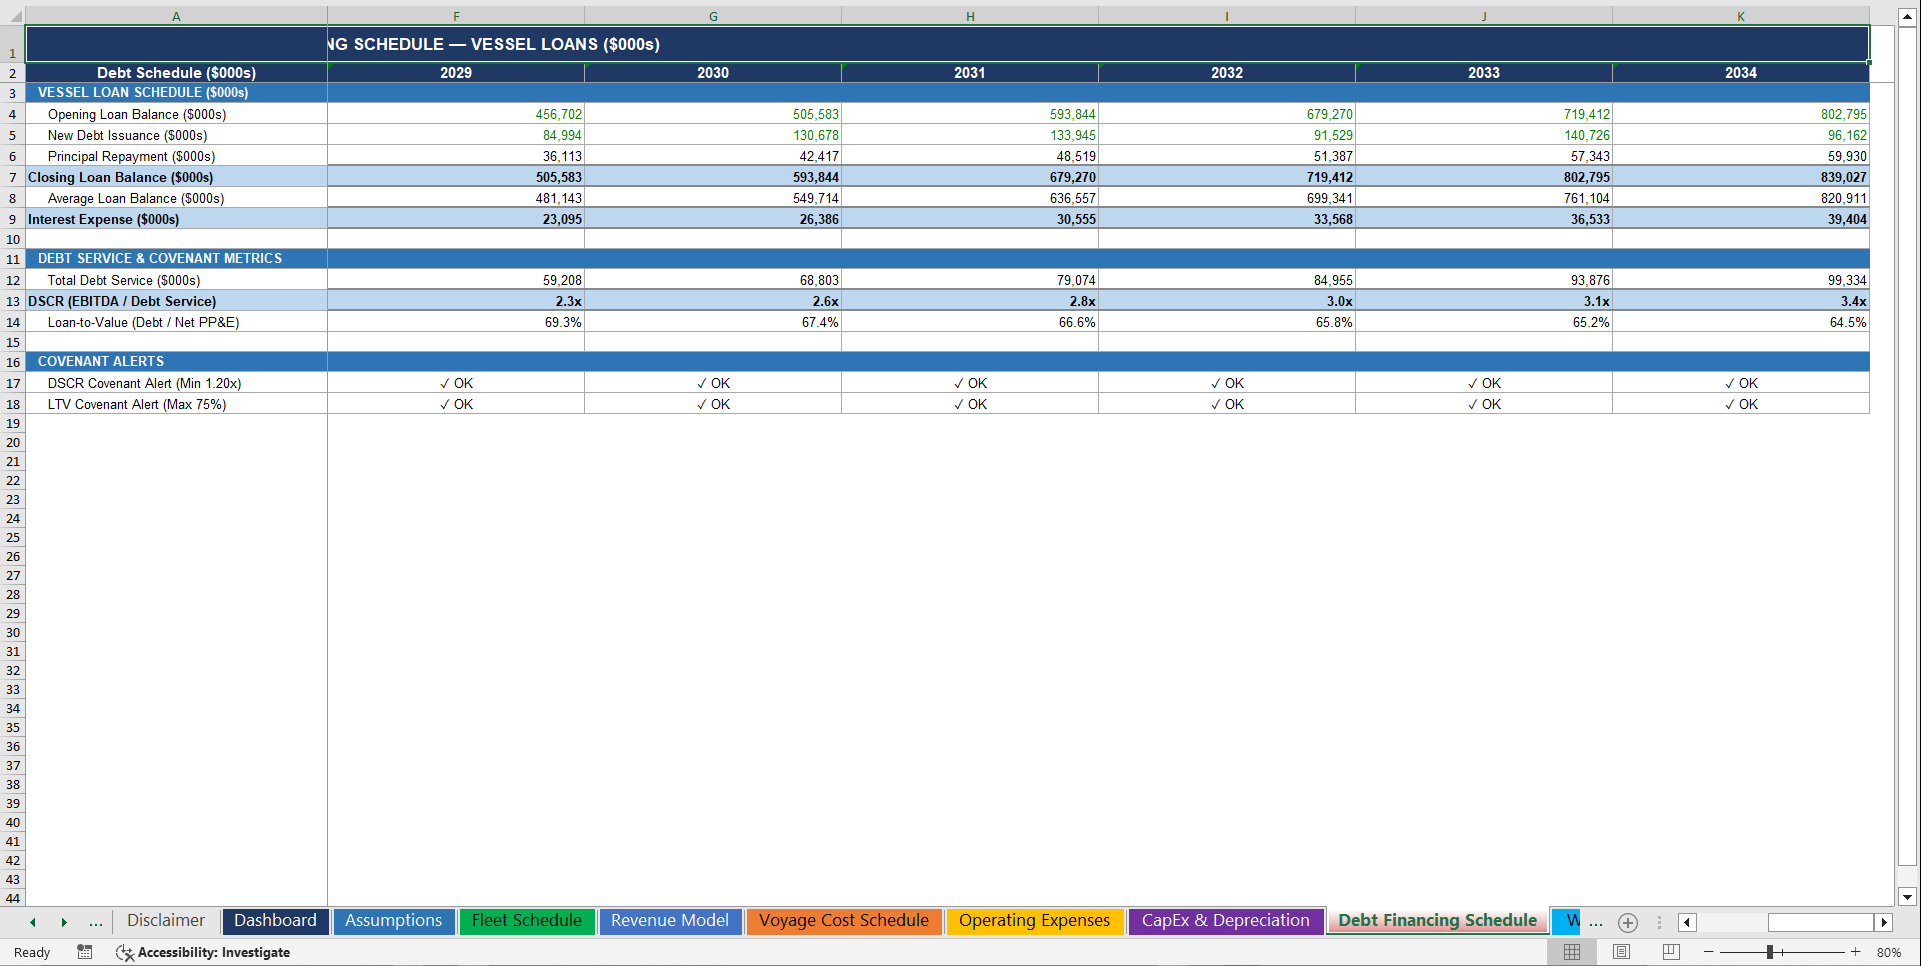
8️⃣ Debt Financing Schedule – Vessel Mortgage Modeling
Institutional-grade vessel loan structure:
• Opening loan balance: $210M (5 vessels × $60M × 70% LTV)
• New debt issuance: 70% LTV financing on all newbuild vessel acquisitions
• Principal grace period: 1 year (no repayment in Year 1)
• Straight-line amortization over 15-year debt tenor
• Interest expense on average loan balance at 4.8% per annum
• Year 1 Interest Expense: $10.1M rising to $39.4M as fleet expands
• Debt service coverage ratio (DSCR): 3.01× in Year 1 – comfortably above 1.20× covenant minimum
• LTV ratio tracked annually against Net PP&E – with breach alert logic
• Covenant alert system: DSCR ✓ OK and LTV ⚠ BREACH flags displayed live on dashboard
Perfect for ship finance bank term sheets, export credit facility applications, equipment financing drawdown schedules, or private credit vessels facilities.
9️⃣ Working Capital Schedule
Cash conversion modeling for maritime operations:
• Accounts Receivable – 35-day DSO on total revenue (charter hire, freight, demurrage)
• Spare Parts & Consumables Inventory – 30-day inventory turns on total COGS
• Prepaid Expenses – 1% of revenue for insurance prepayments and advance port deposits
• Accounts Payable – 45-day DPO on total COGS (bunker suppliers, port agents, crews)
• Accrued Expenses – 1/12 of annual OpEx for crew wages and management fees accruals
• Net Working Capital and Change in NWC both feed directly into the Cash Flow Statement (indirect method)
🔟 Integrated 3-Statement Financials – Everything Connects. Everything Balances.
✔ Income Statement – Revenue → Gross Profit → EBITDA → EBIT → Pre-Tax Income → Net Income with zero-tax protection in loss periods
✔ Cash Flow Statement – Indirect method, CFO (net income + D&A ± working capital changes) + CFI (vessel CapEx − disposal proceeds) + CFF (new debt + repayments + dividends) – ending cash ties directly to Balance Sheet
✔ Balance Sheet – Cash (from CFS), accounts receivable, inventory, prepaid, net PP&E, accounts payable, accrued expenses, current and long-term vessel debt, paid-in capital, retained earnings – dynamically balances to zero every year with live balance check cell
1️⃣1️⃣ Scenario & Sensitivity Analysis
Instant visibility into your risk exposure across 6 named scenarios:
• Base Case – Current assumptions, moderate fleet expansion, 4% charter rate growth
• Shipping Boom – Charter rates +25%, fuel −10%, utilization +3%
• Global Trade Recession – Charter rates −30%, fuel +5%, utilization −8%
• Fuel Price Shock – All other assumptions held, fuel price +40%
• Interest Rate Spike – All other assumptions held, interest rates +200bps
• Bear Case (Combined) – Charter rates −20%, fuel +20%, utilization −5%, rates +150bps
Plus: Charter Rate × Utilization Sensitivity Matrix
5 utilization scenarios (−10% to +10%) × 7 charter rate scenarios (−30% to +30%) = 35 stress-test combinations, all color-coded by Year 5 EBITDA impact with a green-to-red heat map.
Know your downside before you sign the charter party, accept the term sheet, or take delivery of the vessel.
1️⃣2️⃣ Executive Dashboard – Investor-Ready in One View
• 6 KPI cards: Year 1 Revenue, Year 10 Revenue, Year 10 Fleet Size, Year 5 EBITDA, Year 10 Net Income, Year 10 DSCR
• 6 secondary metrics: Year 1 & Year 10 Utilization Rate, Year 5 & Year 10 EBITDA Margin, Debt/EBITDA multiple, Year 10 Cash Balance
• 6 live covenant & operational alerts: Cash balance, DSCR covenant, LTV covenant, EBITDA positivity, utilization floor, net income
• 4 working embedded charts: Revenue & EBITDA clustered bar, Net Income trend line, Fleet growth bar, Debt vs. EBITDA line – all pulling live from the model
💎 Why This Shipping Model Is Different
✔ Built specifically for vessel operating companies – not generic SaaS, restaurant, or construction templates repurposed for maritime
✔ Fleet-level revenue logic driven by vessel class, operating days, utilization ramp, and contract type mix – not a single revenue line
✔ Bunker fuel modeled at the consumption level (laden vs. ballast, tons per day) – not a percentage assumption
✔ Drydock events modeled as capital timing events every 5 years per vessel – not smoothed away into a maintenance percentage
✔ Three vessel classes (Bulk, Container, Tanker) with separate daily rates and distinct operating cost drivers
✔ Vessel loan amortization modeled at 70% LTV across a 15-year mortgage schedule – not a generic interest line
✔ DSCR and LTV covenant monitoring built directly into the debt schedule with live breach alerts
✔ 10-year forecast with startup-to-scale operating leverage from $88M to $641M revenue
✔ EBITDA margin expanding from 34.6% (Year 1) to 52.4% (Year 10) – driven by fleet scale economies
✔ Net income positive from Year 1 – $7.6M in Year 1 growing to $191.7M in Year 10
✔ Institutional-level structure for ship finance banks, maritime PE, infrastructure funds, and IPO readiness
🧠 Built for Real Maritime Profitability Decisions
This model allows you to:
• Raise maritime private equity or infrastructure fund capital with institutional-grade shipping projections
• Secure vessel mortgage financing with financial proof packages ship finance banks actually accept
• Negotiate better charter party terms with data-backed margin analysis by vessel class
• Optimize fleet type mix, time charter vs. spot exposure, and COA contract strategy
• Control bunker cost exposure and fuel surcharge pass-through strategy
• Manage off-hire timing, drydock scheduling, and working capital gaps between charter payments
• Forecast cash runway and time-to-profitability across 10 fleet expansion years with vessel-level precision
• Evaluate new trade route and vessel class expansion ROI before committing newbuild CapEx
• Model multi-class fleet vertical unit economics separately by bulk, container, and tanker divisions
• Stress-test charter rate risk before your next long-term time charter renewal
Instead of hoping your shipping company makes money – you know exactly when and how it will.
🚨 The Cost of Not Having This
Without a proper shipping financial model, you risk:
• Running out of cash between equity rounds during peak fleet mobilization and newbuild delivery spend
• Mispricing your charter strategy and destroying contribution margin on time-sensitive contract renewals
• Overstaffing commercial and technical teams before fleet volume justifies the overhead
• Underestimating bunker cost drag on voyage margins when fuel prices spike 40%+
• Getting rejected by ship finance banks, export credit agencies, and vessel mortgage lenders
• Signing the wrong long-term charter agreement with no downside margin model
• Expanding into new vessel classes too fast without vessel-level profitability validation
• Losing institutional maritime investors because your model had no operational shipping logic
• Burning through the $210M debt facility runway in the first 18 months of operations
One properly scaled shipping platform operating 5 to 24 vessels can generate category-defining, asset-backed, barrier-to-entry returns.
But only if you plan the vessel unit economics correctly from Day 1.
⚡ Stop Guessing. Start Modeling Like an Institutional Maritime Operator.
If you are serious about:
• Launching a profitable vessel operating company or fleet management platform
• Scaling a multi-class shipping business across bulk, container, and tanker divisions
• Raising maritime private equity, infrastructure fund capital, or ship finance debt
• Securing vessel mortgage facilities, export credit financing, or equipment leasing approvals
• Maximizing charter rate margins, utilization rates, and LTV/DSCR covenant headroom
• Surviving bunker fuel volatility, off-hire cost compression, and drydock timing risk
• Building a delivery-first maritime brand at institutional capital scale
• Preparing for a Series B, strategic fleet acquisition, or public market IPO readiness
This model is your unfair advantage.
👉 Download the Shipping Vessel Operator Financial Model today – and launch, fund, and scale your maritime empire with the numbers to back it up.
Key Words:
Strategy & Transformation, Growth Strategy, Strategic Planning, Strategy Frameworks, Innovation Management, Pricing Strategy, Core Competencies, Strategy Development, Business Transformation, Marketing Plan Development, Product Strategy, Breakout Strategy, Competitive Advantage, Mission, Vision, Values, Strategy Deployment & Execution, Innovation, Vision Statement, Core Competencies Analysis, Corporate Strategy, Product Launch Strategy, BMI, Blue Ocean Strategy, Breakthrough Strategy, Business Model Innovation, Business Strategy Example, Corporate Transformation, Critical Success Factors, Customer Segmentation, Customer Value Proposition, Distinctive Capabilities, Enterprise Performance Management, KPI, Key Performance Indicators, Market Analysis, Market Entry Example, Market Entry Plan, Market Intelligence, Market Research, Market Segmentation, Market Sizing, Marketing, Michael Porter's Value Chain, Organizational Transformation, Performance Management, Performance Measurement, Platform Strategy, Product Go-to-Market Strategy, Reorganization, Restructuring, SWOT, SWOT Analysis, Service 4.0, Service Strategy, Service Transformation, Strategic Analysis, Strategic Plan Example, Strategy Deployment, Strategy Execution, Strategy Frameworks Compilation, Strategy Methodologies, Strategy Report Example, Value Chain, Value Chain Analysis, Value Innovation, Value Proposition, Vision Statement, Corporate Strategy, Business Development, Business plan pdf, business plan, PDF, Business Plan DOC, Business Plan Template, PPT, Market strategy playbook, strategic market planning, competitive analysis tools, market segmentation frameworks, growth strategy templates, product positioning strategy, market execution toolkit, strategic alignment playbook, KPI and OKR frameworks, business growth strategy guide, cross-functional strategy templates, market risk management, market strategy PowerPoint doc, guide, ebook, e-book ,McKinsey Change Playbook, Organizational change management toolkit, Change management frameworks 2025, Influence model for change, Change leadership strategies, Behavioral change in organizations, Change management PowerPoint templates, Transformational leadership in change, supply chain KPIs, supply chain KPI toolkit, supply chain PowerPoint template, logistics KPIs, procurement KPIs, inventory management KPIs, supply chain performance metrics, manufacturing KPIs, supply chain dashboard, supply chain strategy KPIs, reverse logistics KPIs, sustainability KPIs in supply chain, financial supply chain KPIs, warehouse KPIs, digital supply chain KPIs, 1200 KPIs, supply chain scorecard, KPI examples, supply chain templates, Corporate Finance SOPs, Finance SOP Excel Template, CFO Toolkit, Finance Department Procedures, Financial Planning SOPs, Treasury SOPs, Accounts Payable SOPs, Accounts Receivable SOPs, General Ledger SOPs, Accounting Policies Template, Internal Controls SOPs, Finance Process Standardization, Finance Operating Procedures, Finance Department Excel Template, FP&A Process Documentation, Corporate Finance Template, Finance SOP Toolkit, CFO Process Templates, Accounting SOP Package, Tax Compliance SOPs, Financial Risk Management Procedures.
NOTE: Our digital products are sold on an "as is" basis, making returns and refunds unavailable post-download. Please preview and inquire before purchasing. Please contact us before purchasing if you have any questions! This policy aligns with the standard Flevy Terms of Usage.
Got a question about the product? Email us at support@flevy.com or ask the author directly by using the "Ask the Author a Question" form. If you cannot view the preview above this document description, go here to view the large preview instead.
Source: Best Practices in Shipping Industry, Integrated Financial Model Excel: Shipping Vessel Operator 10-Year 3 Statement Financial Model Excel (XLSX) Spreadsheet, SB Consulting
ABOUT THE AUTHOR
SB Consulting is dedicated to empowering businesses to communicate their ideas with impact. This consulting firm specializes in teaching organizations how to create effective corporate and management presentations. With training from top-tier global consulting firms, including McKinsey, BCG, and Porsche Consulting, extensive expertise in presentation design and ... [read more]
Ask the Author a Question
You must be logged in to contact the author.
