
Offshore Marine Services Financial Model (10+ Year DCF Valuation) – Excel XLSX
Excel (XLSX)
VIDEO DEMO
BENEFITS OF THIS DOWNLOADABLE EXCEL DOCUMENT
- 10-Year DCF and Valuation: Long-term financial projections, including NPV and IRR calculations.
- Strategic Planning: Helps optimize fleet expansion, service pricing, and cost control strategies.
- Informed Decision-Making: Supports funding, market positioning, and operational efficiency with financial insights.
SHIPPING INDUSTRY EXCEL DESCRIPTION
The Offshore Marine Services Financial Model with a 10-Year DCF (Discounted Cash Flow) and Valuation provides a detailed financial analysis for businesses providing offshore support services. It includes comprehensive projections for fleet utilization, rates, leases, operational expenses, and capital investment.
This model helps assess long-term profitability, investment feasibility, and business scalability. Additionally, it produces pro forma financial statements, net present value (NPV), internal rate of return (IRR), and payback period to support decision-making and strategic planning.
Key Components:
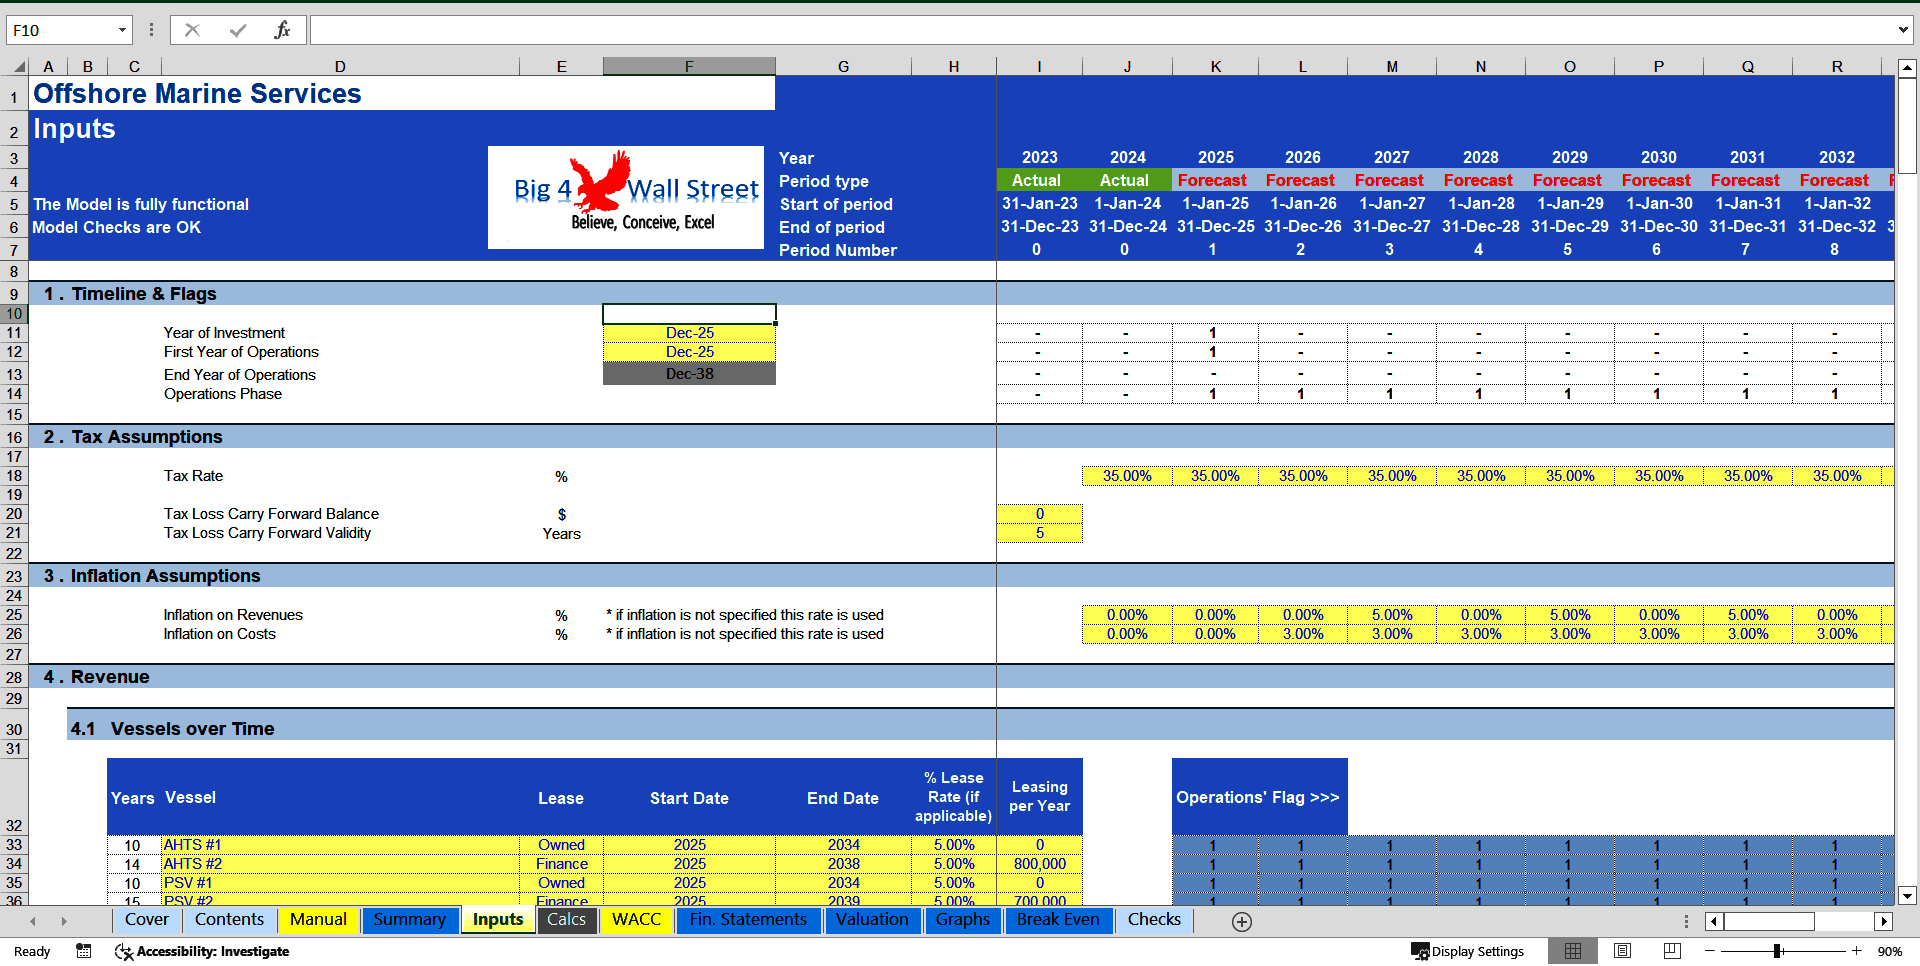
1. Fleet Utilization: Assumptions for leasing (finance, operating, owned), and days hired.
2. Revenue Streams: Income from vessel hires, project based, consulting and other revenue streams.
3. Operating Expenses: Costs related to fuel, crew wages, maintenance, insurance, and port fees.
4. Capital Expenditures (CapEx): Investments in new vessels, equipment, and facility upgrades.
5. 10-Year DCF and Valuation: Long-term financial projections, including NPV and IRR calculations.
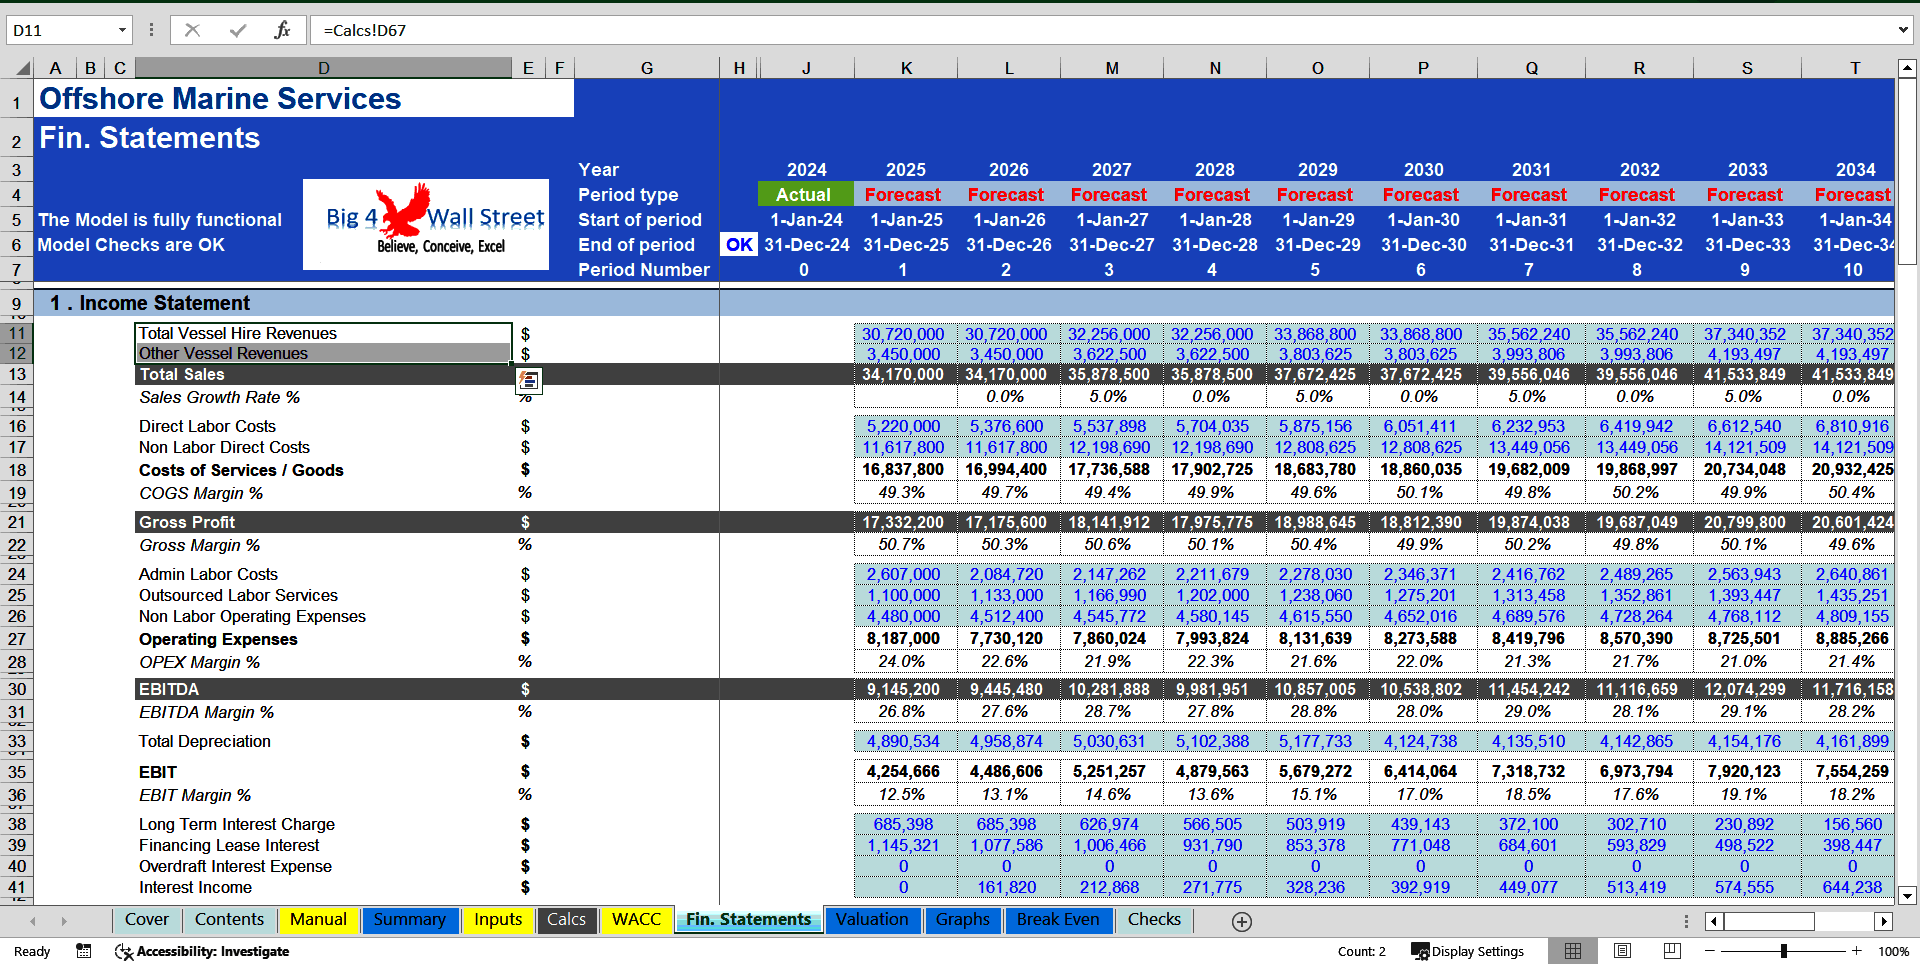
6. Pro Forma Financial Statements: Includes income statement, balance sheet, and cash flow projections.
7. Payback Period: Calculation of the time required to recover the initial investment.
Key Benefits:
1. Investment Viability: Evaluates profitability, scalability, and return potential for offshore marine operations.
2. Strategic Planning: Helps optimize fleet expansion, service pricing, and cost control strategies.
3. Informed Decision-Making: Supports funding, market positioning, and operational efficiency with financial insights.
4. Investor Appeal: A robust financial model to present to stakeholders and secure financing.
————————————————————————————————————————————————
MODEL GUIDELINES
So, a quick overview of the model, in the contents tab you can see the structure of the model and by clicking on any of the headlines to be redirected to the relevant worksheet.
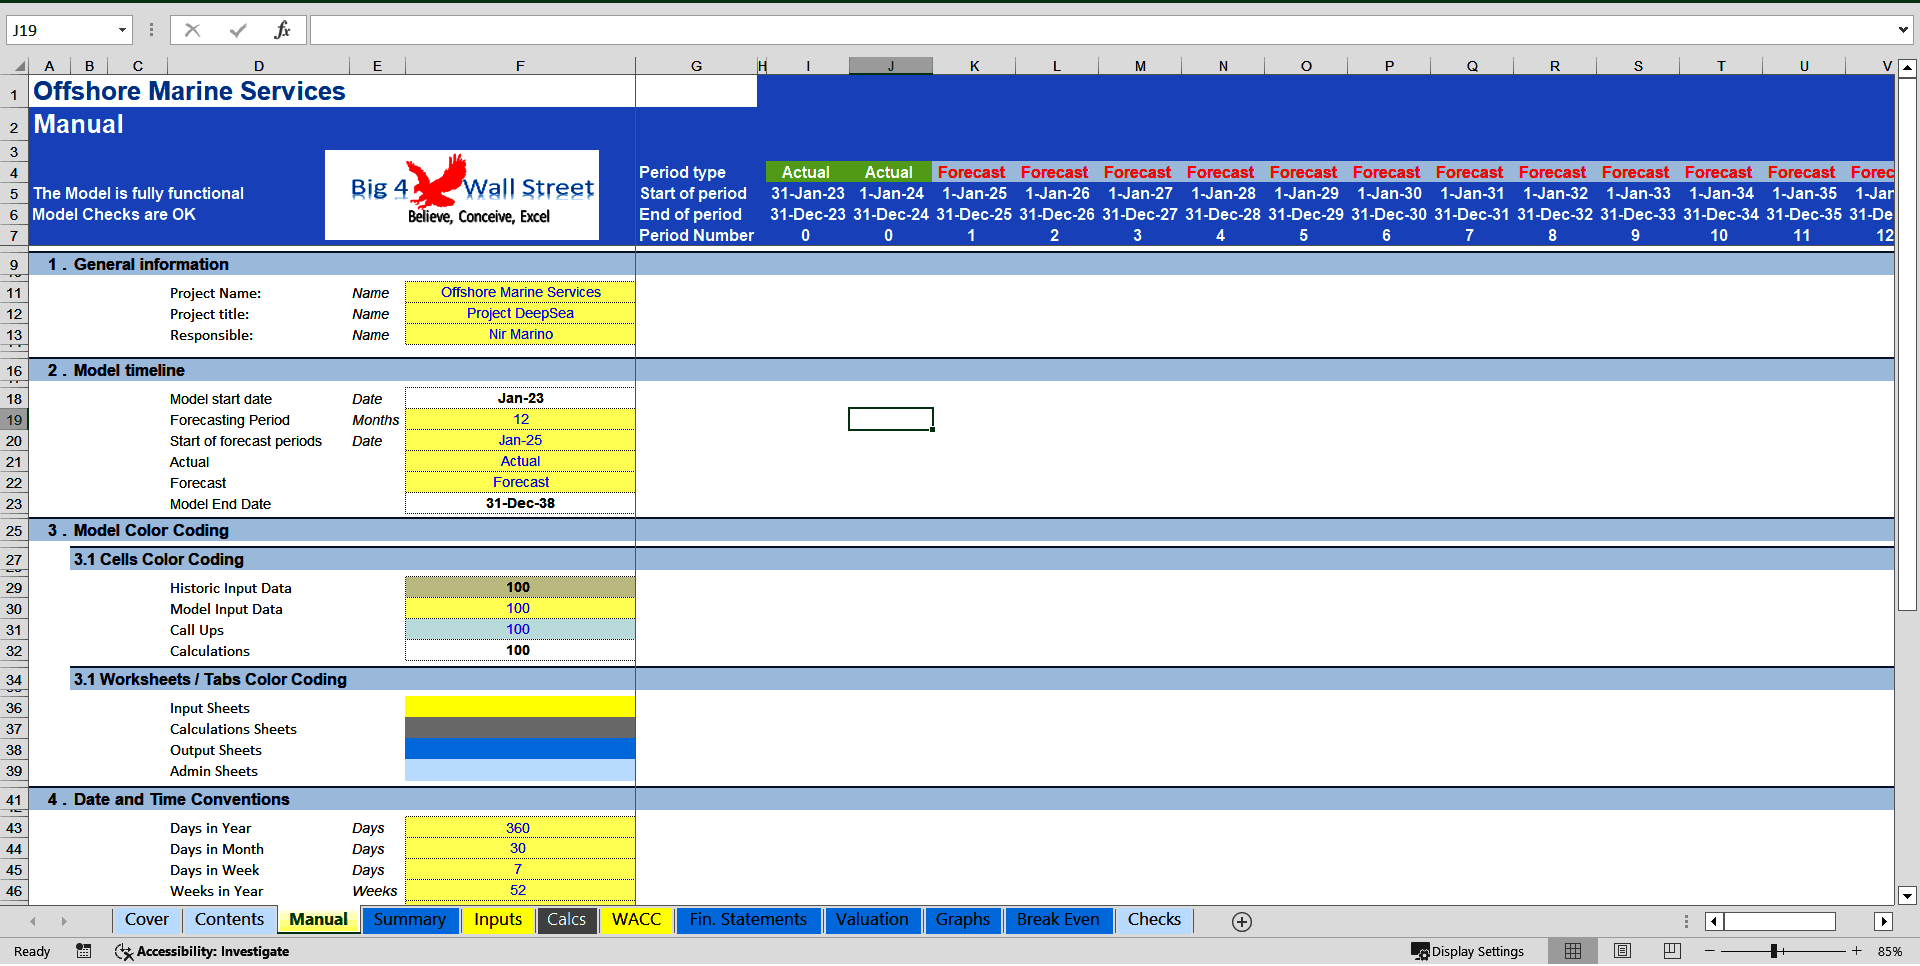
On the manual tab you can feed the general information for the model such as: project name & title, responsible, timeline of the model and date and currency conventions.
Additionally, there is a description of the color coding of the model in the same tab. Inputs are always depicted with a yellow fill and blue letters, call up (that is direct links from other cells) are filled in light blue with blue letters while calculations are depicted with white fill and black characters.
There is also color coding for the various tabs of the model. Yellow tabs are mostly assumptions tabs, grey tabs are calculations tabs, blue tabs are outputs tabs (that is effectively results or graphs) and finally light blue tabs are admin tabs (for example: the cover page, contents, and checks).
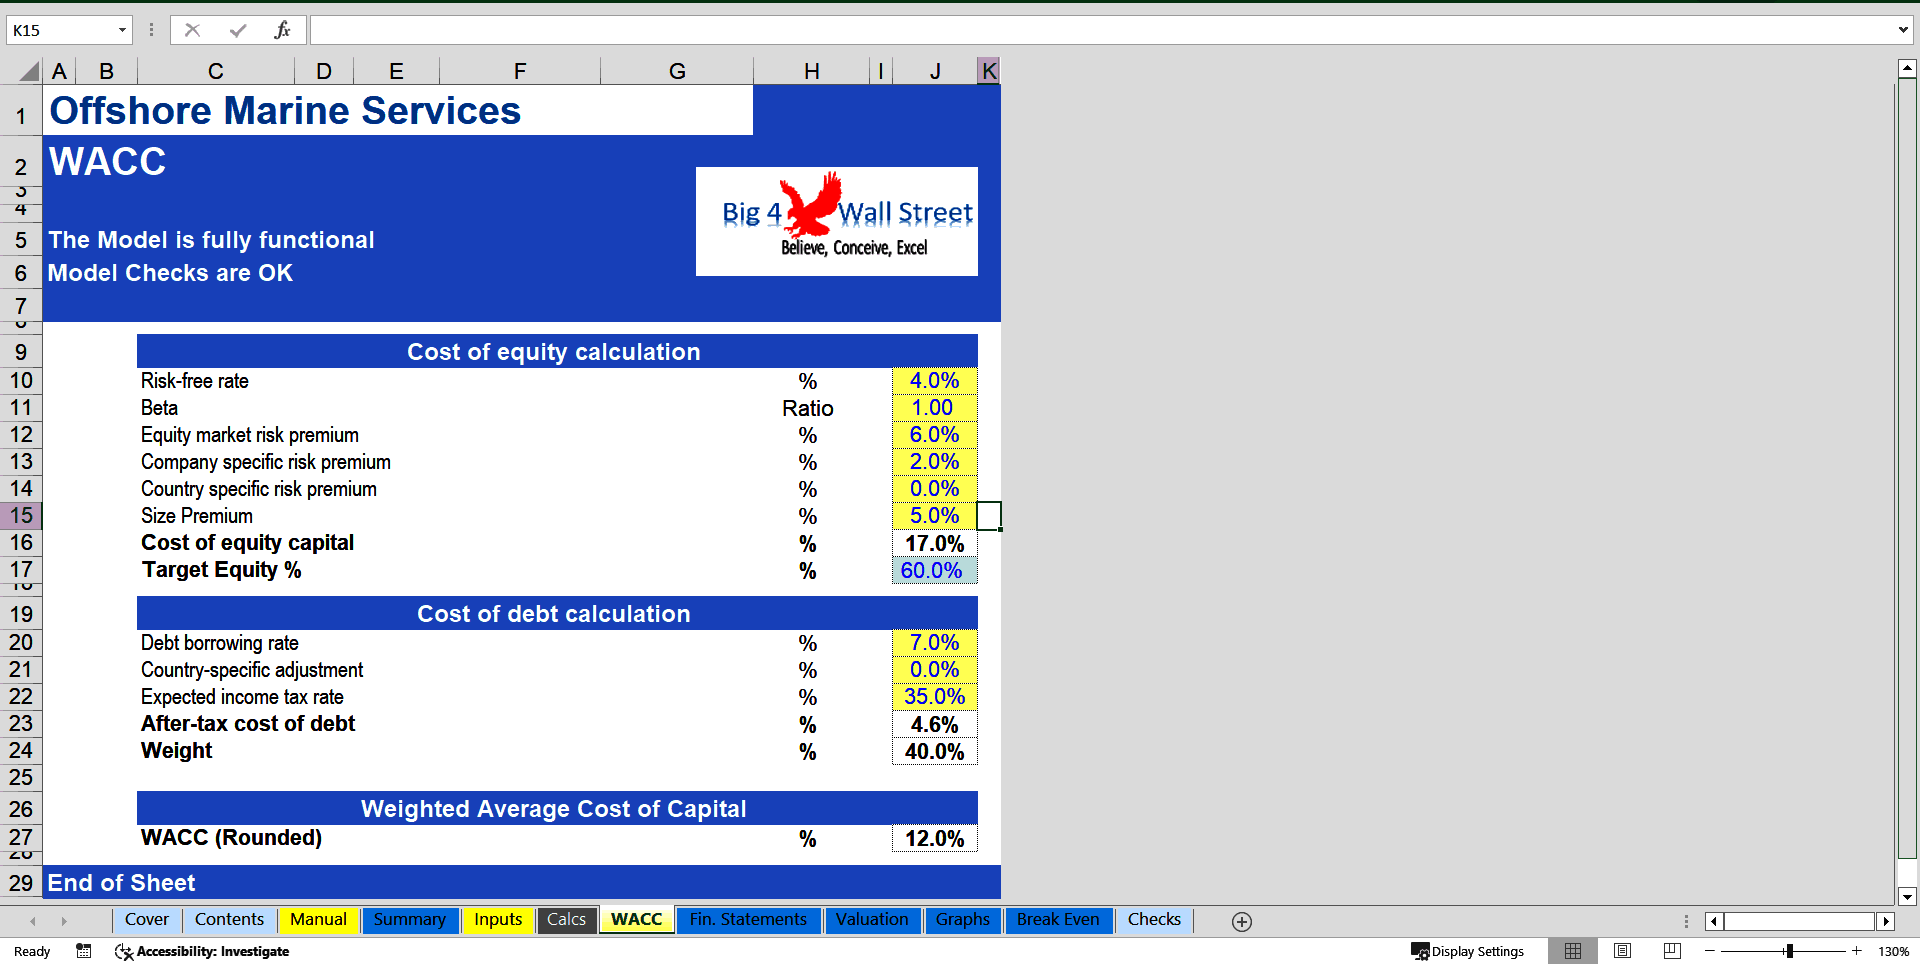
Moving on to the Inputs: detailed inputs for revenues such vessel hires and other revenue streams and costs splits between direct costs (direct labor costs, and other direct costs) and indirect costs (such as admin staff, outsourced staff, insurance, advertising & promotions as well as other costs), working capital (receivables, payables, and inventory), fixed assets and capex (split into start up investment and new maintenance capex), debt & equity financing as well as valuation assumptions (such as discount rates used in the weighted average cost of capital).
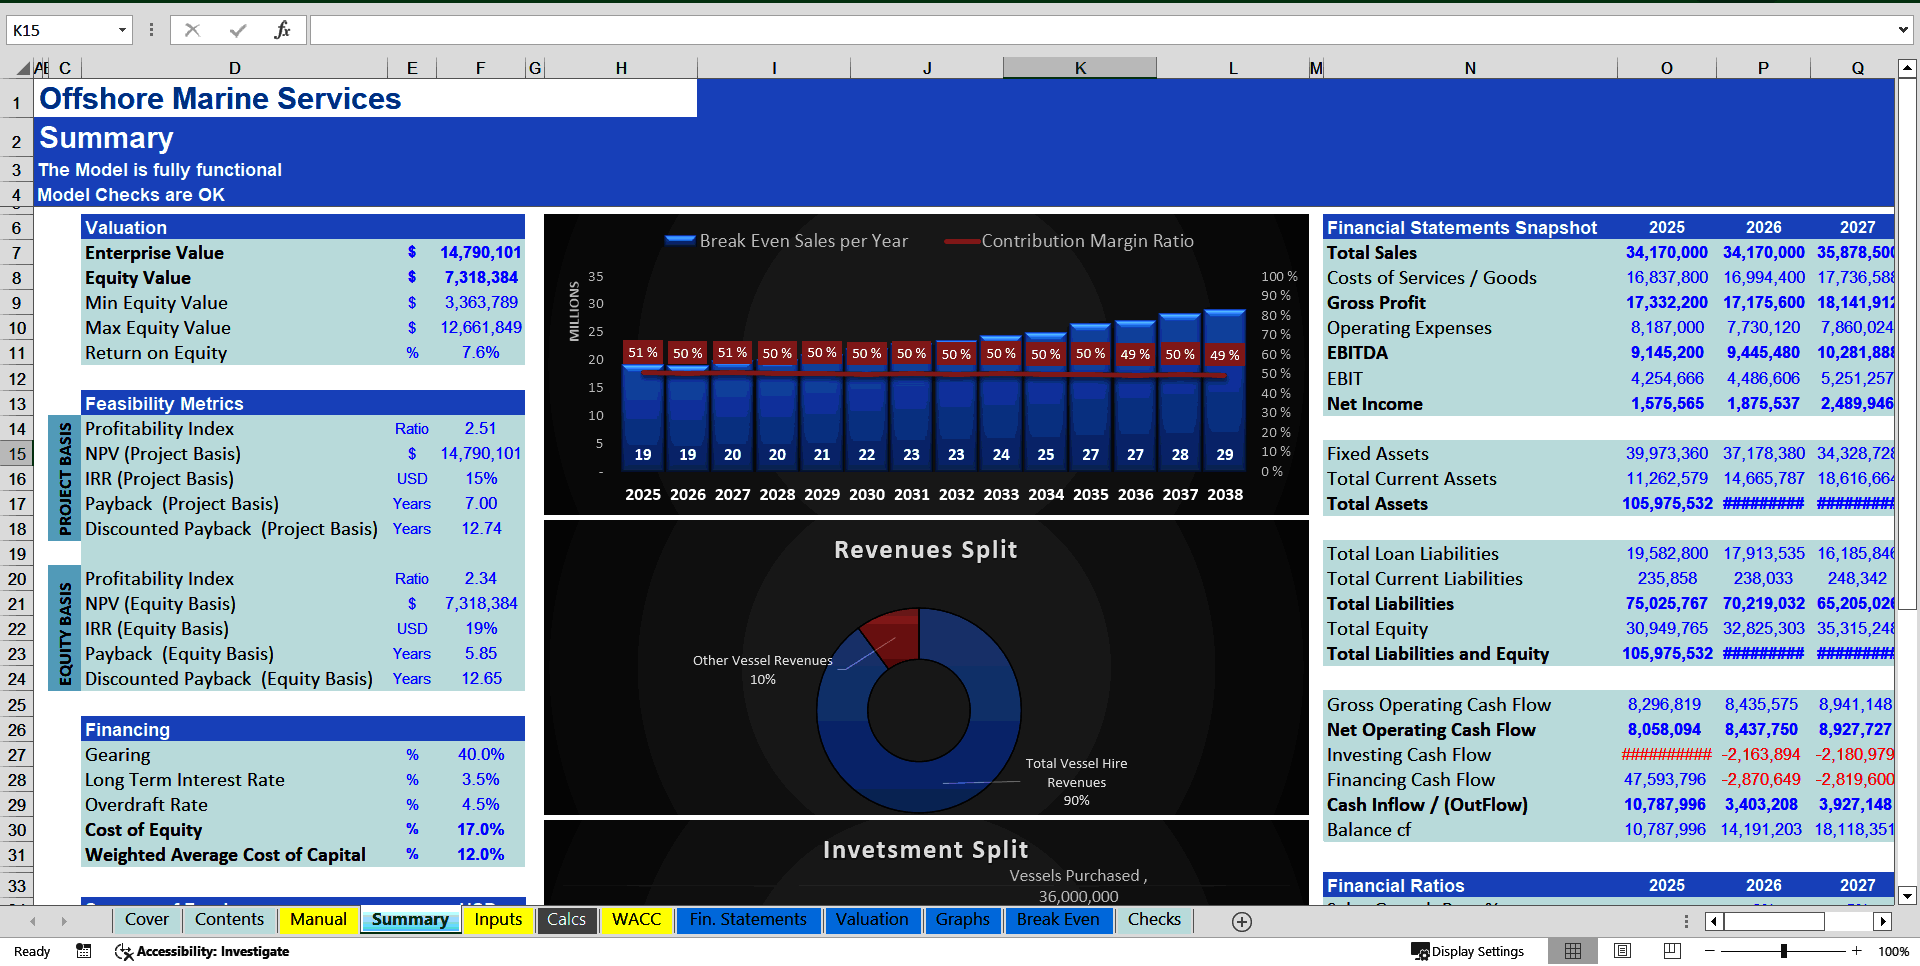
In the summary tab you can see a high-level report with the main metrics and value drivers of the model. It can be readily printed on one page for your convenience.
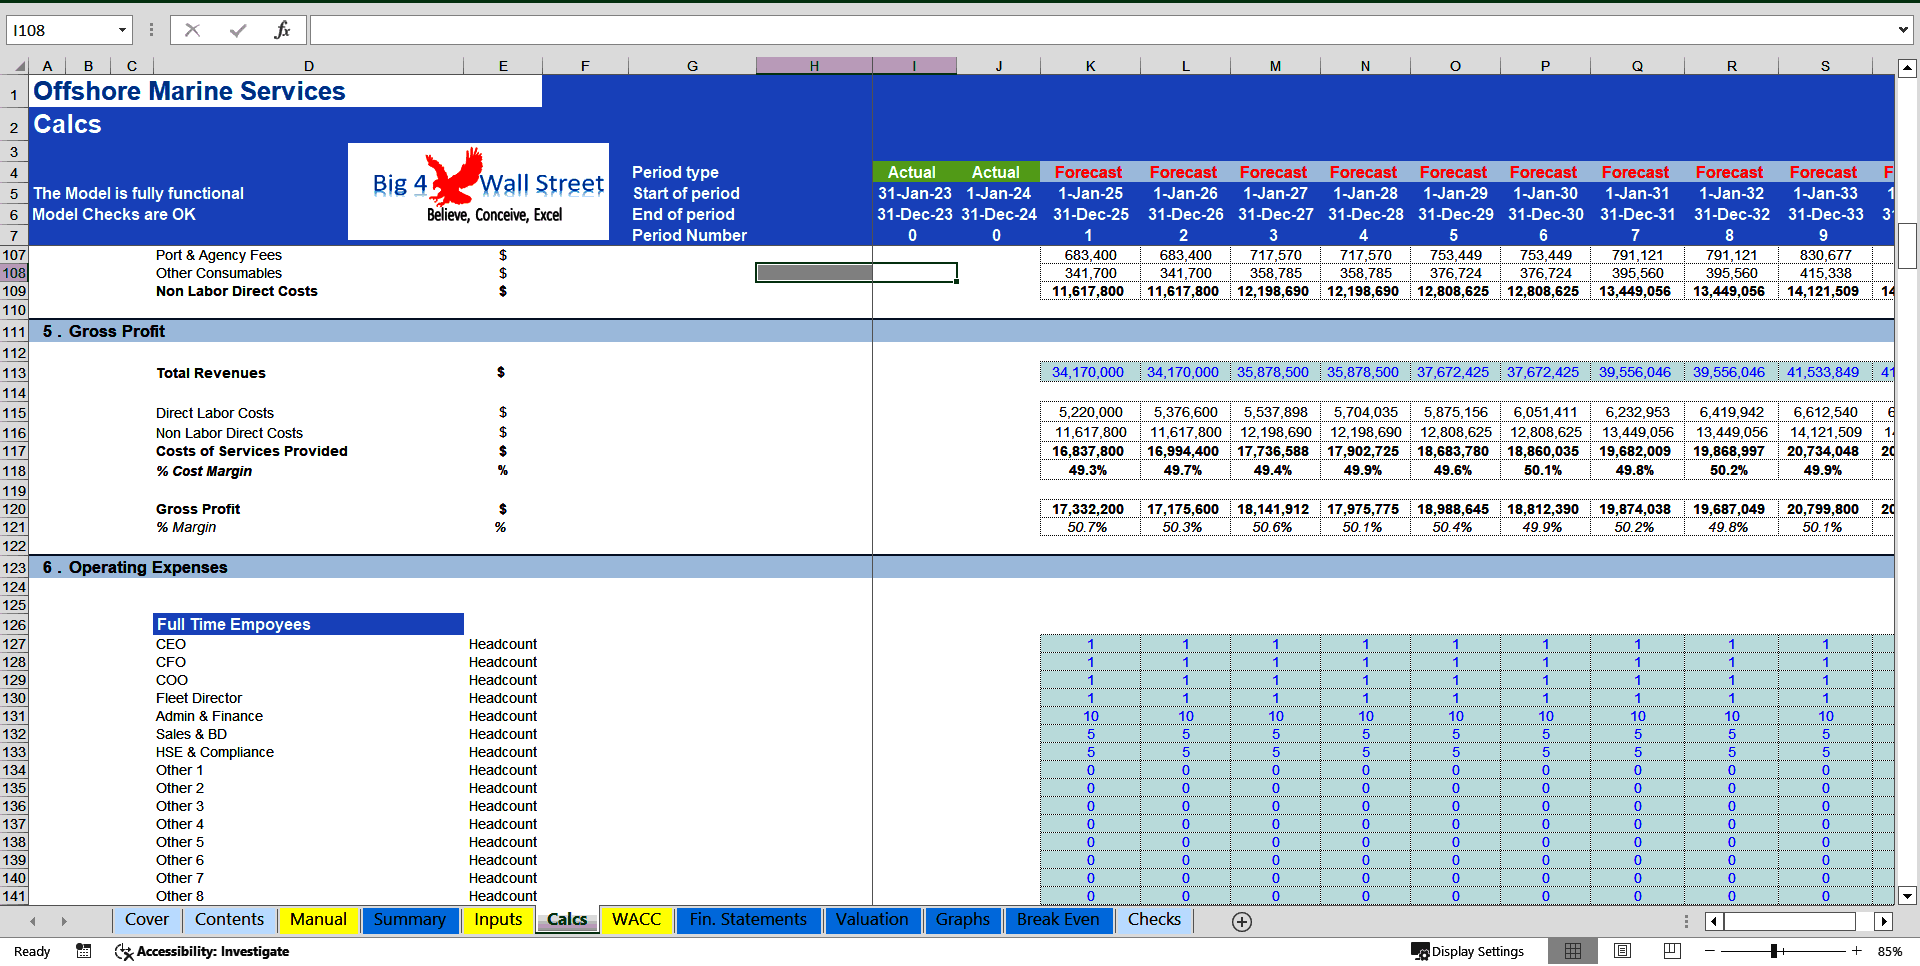
Calculations: this is where all calculations are performed. The revenues are calculated based on the various revenue streams and by deducting the operating costs adjusted for inflation the operating profit is resulting. Based on the assets financed and the gearing of the financing the interest and depreciation are occurring. By using the working capital assumptions, the impact of the business cycle is presented. Finally, depending on the level of the investment considered the relevant debt financing is calculated (Long term debt and overdraft).
In the Outputs tab: everything is aggregated here into the relevant statements: profit and loss, balance sheet and cash flow.
Moving to the Valuation tab, a valuation is performed by using the free cash flows to the firm and then a series of investment metrics are presented (Net Present Value, Internal Rate of Return, Profitability Index, Payback Period, Discounted Payback Period, Sensitivity Analysis).
In the Graphs tab: Various graphs present the business metrics, revenues, operating costs, and profitability. Then multiple charts present the working capital, debt & equity along with cash, assets, and cash flows which results in a valuation on a project basis as well as on an equity basis together with the feasibility metrics.
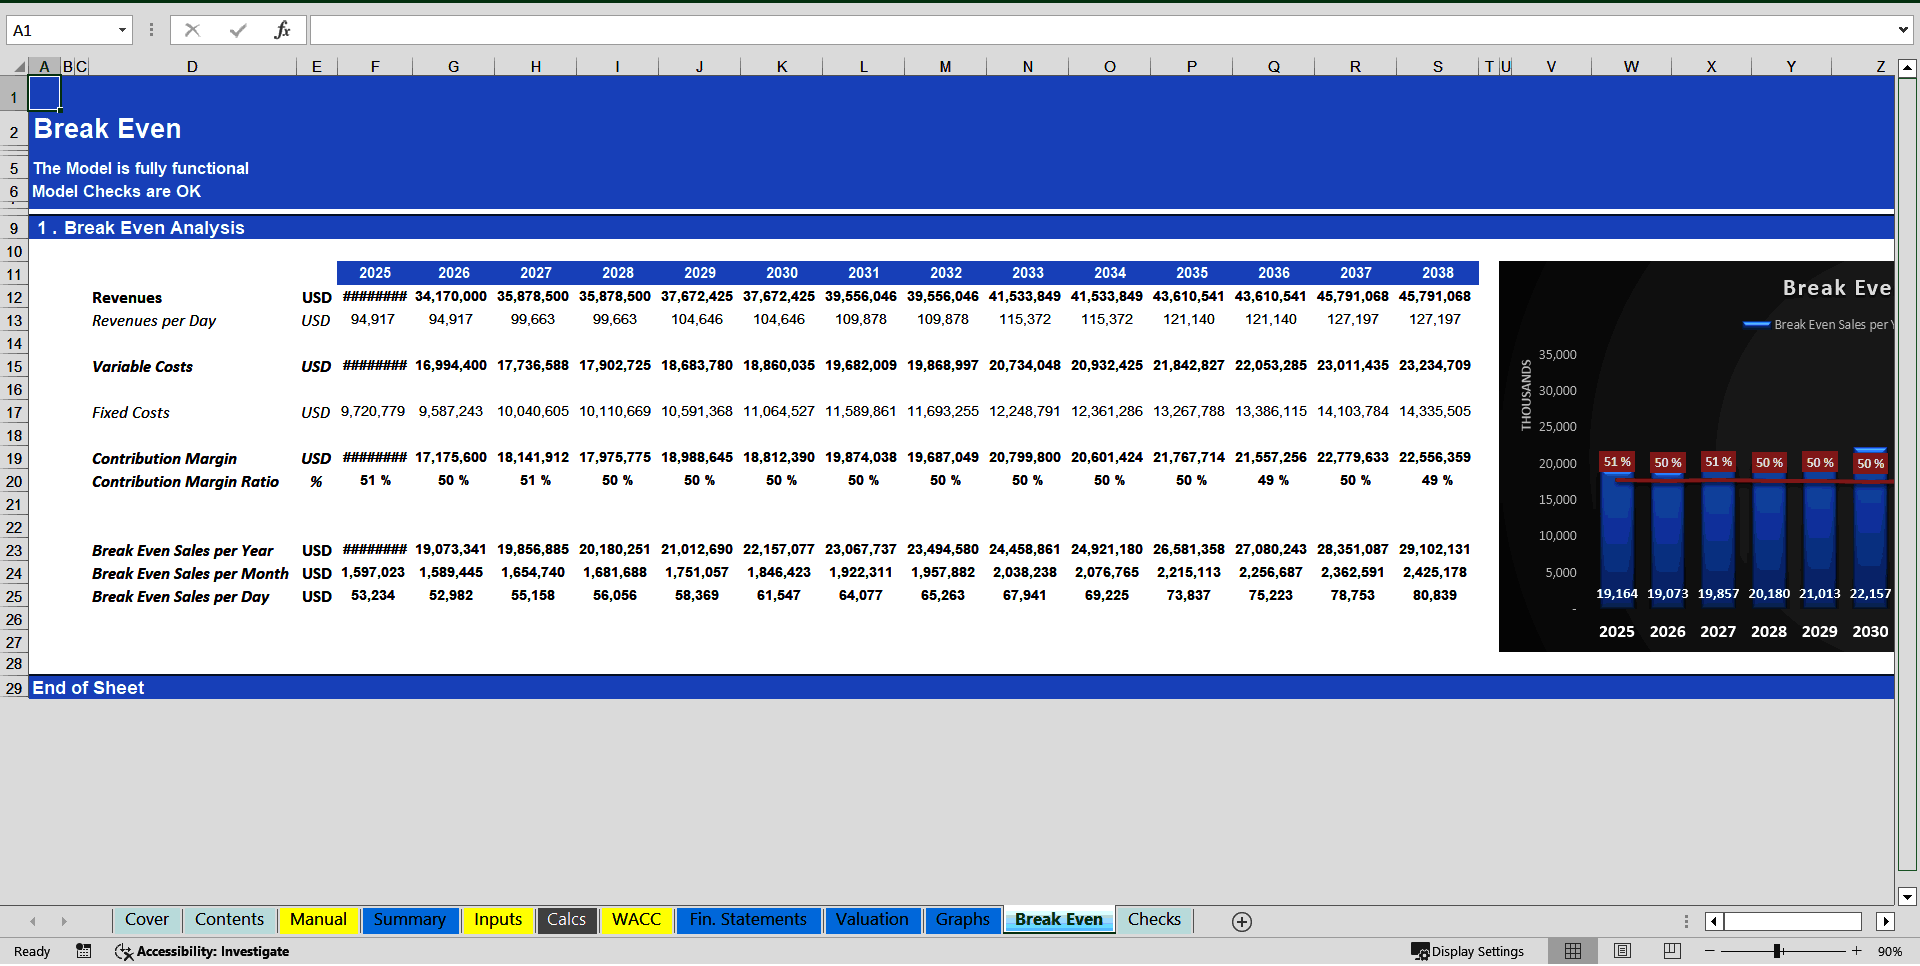
In the Break-Even tab, you can find a break-even analysis and see how many sales you need to break even.
Checks: A dedicated worksheet that makes sure that everything is working as it should!
Important Notice: Yellow indicates inputs and assumptions that the user can change, blue cells are used for called up cells, and white cells with black characters indicates calculation cells.
Got a question about the product? Email us at support@flevy.com or ask the author directly by using the "Ask the Author a Question" form. If you cannot view the preview above this document description, go here to view the large preview instead.
TOPIC FAQ
What inputs are required to build a DCF model for an offshore support services business?
A DCF for offshore services typically needs fleet utilization assumptions (leasing type and days hired), detailed revenue streams (vessel hires, project work, consulting), operating expense breakdowns, CapEx plans, working capital assumptions (receivables, payables, inventory), and debt/equity financing and valuation assumptions such as discount rates and WACC.How should I model fleet utilization and leasing options for vessels?
Model fleet utilization by specifying vessel categories, leasing arrangements (finance, operating, owned), utilization rates or days hired, and hire rates per vessel class; link those assumptions to revenue lines so vessel hires translate into projected revenues based on days hired and leasing type assumptions.Which operating costs matter most when modeling offshore marine operations?
Key operating costs to model include fuel, crew wages, routine maintenance, insurance, port and agency fees, plus indirect costs such as admin and outsourced staff; these cost lines feed into operating profit after being adjusted for inflation and direct/indirect cost splits.How do pro forma financial statements feed into valuation for an offshore project?
Pro forma income statements, balance sheets, and cash flow projections produce free cash flows to the firm, which are discounted to derive valuation metrics; a model then reports NPV, IRR, profitability index, and payback metrics, as in the Offshore Marine Services Financial Model (10+ Year DCF Valuation).What features should I look for when buying a financial model template for offshore marine services?
Look for detailed fleet utilization and revenue-stream inputs, separated direct and indirect cost lines, CapEx (startup and maintenance) breakdowns, working capital and financing sections, built outputs (pro forma statements, DCF), sensitivity analysis, break-even, and model documentation/color-coding such as input cells and checks — and a 10-year DCF.How much Excel and finance expertise is needed to customize a pre-built maritime DCF model?
You should be comfortable editing assumptions (yellow input cells), linking scenarios, and understanding corporate finance concepts like WACC, depreciation, interest calculations, working capital impacts, and debt sizing; familiarity with model checks and color-coding speeds customization in templates like the Offshore Marine Services Financial Model (10+ Year DCF Valuation).I'm evaluating an acquisition of a small offshore operator — what modeling steps should I run first?
Begin by normalizing historical revenues and costs, updating fleet utilization and CapEx plans, setting working capital assumptions, defining financing structure, and then run forward pro forma statements and a discounted cash flow to derive valuation metrics and exit scenarios, ending with NPV, IRR and payback period.How can sensitivity analysis and break-even analysis improve decision-making for vessel projects?
Sensitivity analysis shows how changes in key assumptions (rates, utilization, costs) affect valuation metrics and returns, while break-even analysis identifies required revenue or utilization thresholds to reach zero profit or recover investment; both clarify risk and operational levers using break-even and sensitivity outputs.Source: Best Practices in Shipping Industry, Integrated Financial Model Excel: Offshore Marine Services Financial Model (10+ Year DCF Valuation) Excel (XLSX) Spreadsheet, Big4WallStreet
ABOUT THE AUTHOR
We help small and midsize businesses' leaders with their strategic problems by creating or improving financial models, implementing tools to drive efficiency, performance, and better decision making.
With over 15 years of experience in Financial & Business Modeling / Planning, Performance & Analysis (Ernst & Young, Toyota, Viohalco and Upstream), we have developed strong business
... [read more]
Ask the Author a Question
You must be logged in to contact the author.
