
 Click main image to view in full screen. Unlock all 10 preview images:
Real Estate Portfolio Investment, Cash Flow, IRR, Waterfall – Excel XLSX
Excel (XLSX) + supplemental PDF


BENEFITS OF THIS DOWNLOADABLE EXCEL DOCUMENT
- Connects property-level assumptions to 10-year operating forecasts, debt, exit proceeds, returns and consolidated portfolio reporting.
- Evaluates investor economics through levered and unlevered IRRs, equity multiples, target-return comparisons and an LP/GP waterfall.
- Improves investment review with dashboards, property KPIs, market valuation, conditional formatting and visible model-integrity checks.
REAL ESTATE EXCEL DESCRIPTION
🏢 Real Estate Portfolio Financial Model
Integrated acquisition, operating, financing, returns, waterfall and valuation analysis
The Real Estate Portfolio Financial Model is a comprehensive Excel framework for evaluating and monitoring a diversified portfolio of income-producing properties. It connects property-level acquisition and operating assumptions with 10-year cash-flow forecasts, debt schedules, investor returns, LP/GP distributions, market valuation and consolidated portfolio reporting.
The model is designed for real estate investors, private equity professionals, asset managers, developers, lenders, consultants and financial analysts who need a transparent and editable tool for portfolio underwriting, investment review, forecasting and performance analysis.
🎯 What can the model be used for?
Underwrite multiple properties in one consistent framework.
Forecast rent, vacancy, operating expenses, NOI and capital reserves.
Evaluate property-level and portfolio-level cash flows.
Model acquisition financing, debt service, amortization and refinancing.
Calculate levered and unlevered investment returns.
Compare projected IRR with property-specific target returns.
Analyse cash-on-cash yield, equity multiple and payback period.
Model LP/GP distributions, preferred return and promote economics.
Estimate exit proceeds using property-specific exit cap rates.
Compare appraised values, DCF values and market cap-rate benchmarks.
Monitor portfolio value, occupancy, NOI growth and debt reduction.
Present investment results through dashboards and an executive summary.
⚙️ Central assumptions and portfolio inputs
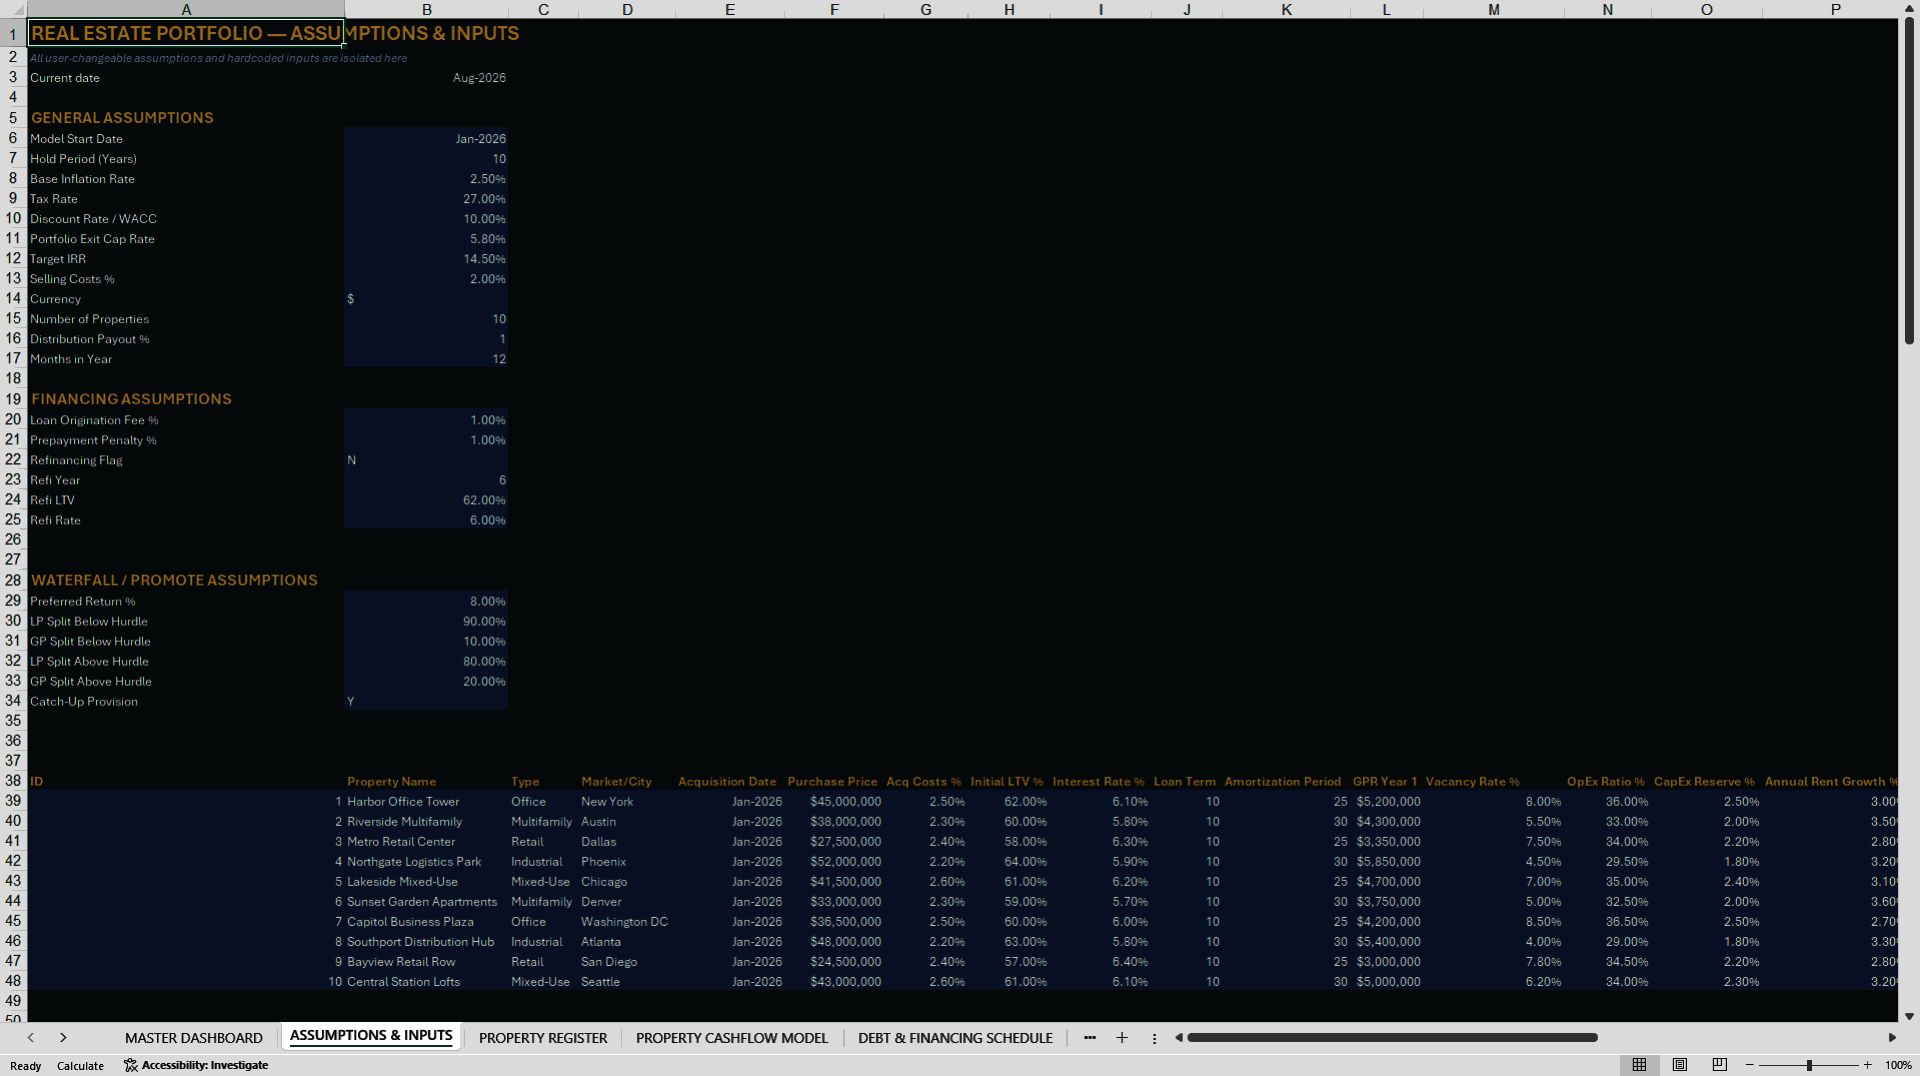
All major user-changeable assumptions are consolidated within a dedicated input worksheet. This keeps the calculation areas formula-driven and makes the model easier to update, review and audit.
Portfolio-level assumptions include:
Model start date and 10-year holding period.
Inflation and tax assumptions.
Discount rate or WACC.
Portfolio exit cap rate.
Target IRR.
Selling costs.
Distribution payout percentage.
Loan origination and prepayment fees.
Refinancing flag, year, LTV and interest rate.
Preferred return and LP/GP sharing percentages.
Catch-up provision.
Property-level inputs include:
Property name, type and market.
Acquisition date and purchase price.
Acquisition costs.
Initial loan-to-value ratio.
Interest rate, loan term and amortization period.
Year-one gross potential rent.
Vacancy rate and occupancy assumptions.
Operating expense ratio.
Capital expenditure reserve.
Annual rent and expense growth.
Exit cap rate and target IRR.
Market cap rate, property size and operating status.
The illustrative portfolio contains 10 properties across office, multifamily, retail, industrial and mixed-use categories in 10 U.S. markets. Buyers can replace these fictional examples with their own validated investment data.
📋 Linked property register
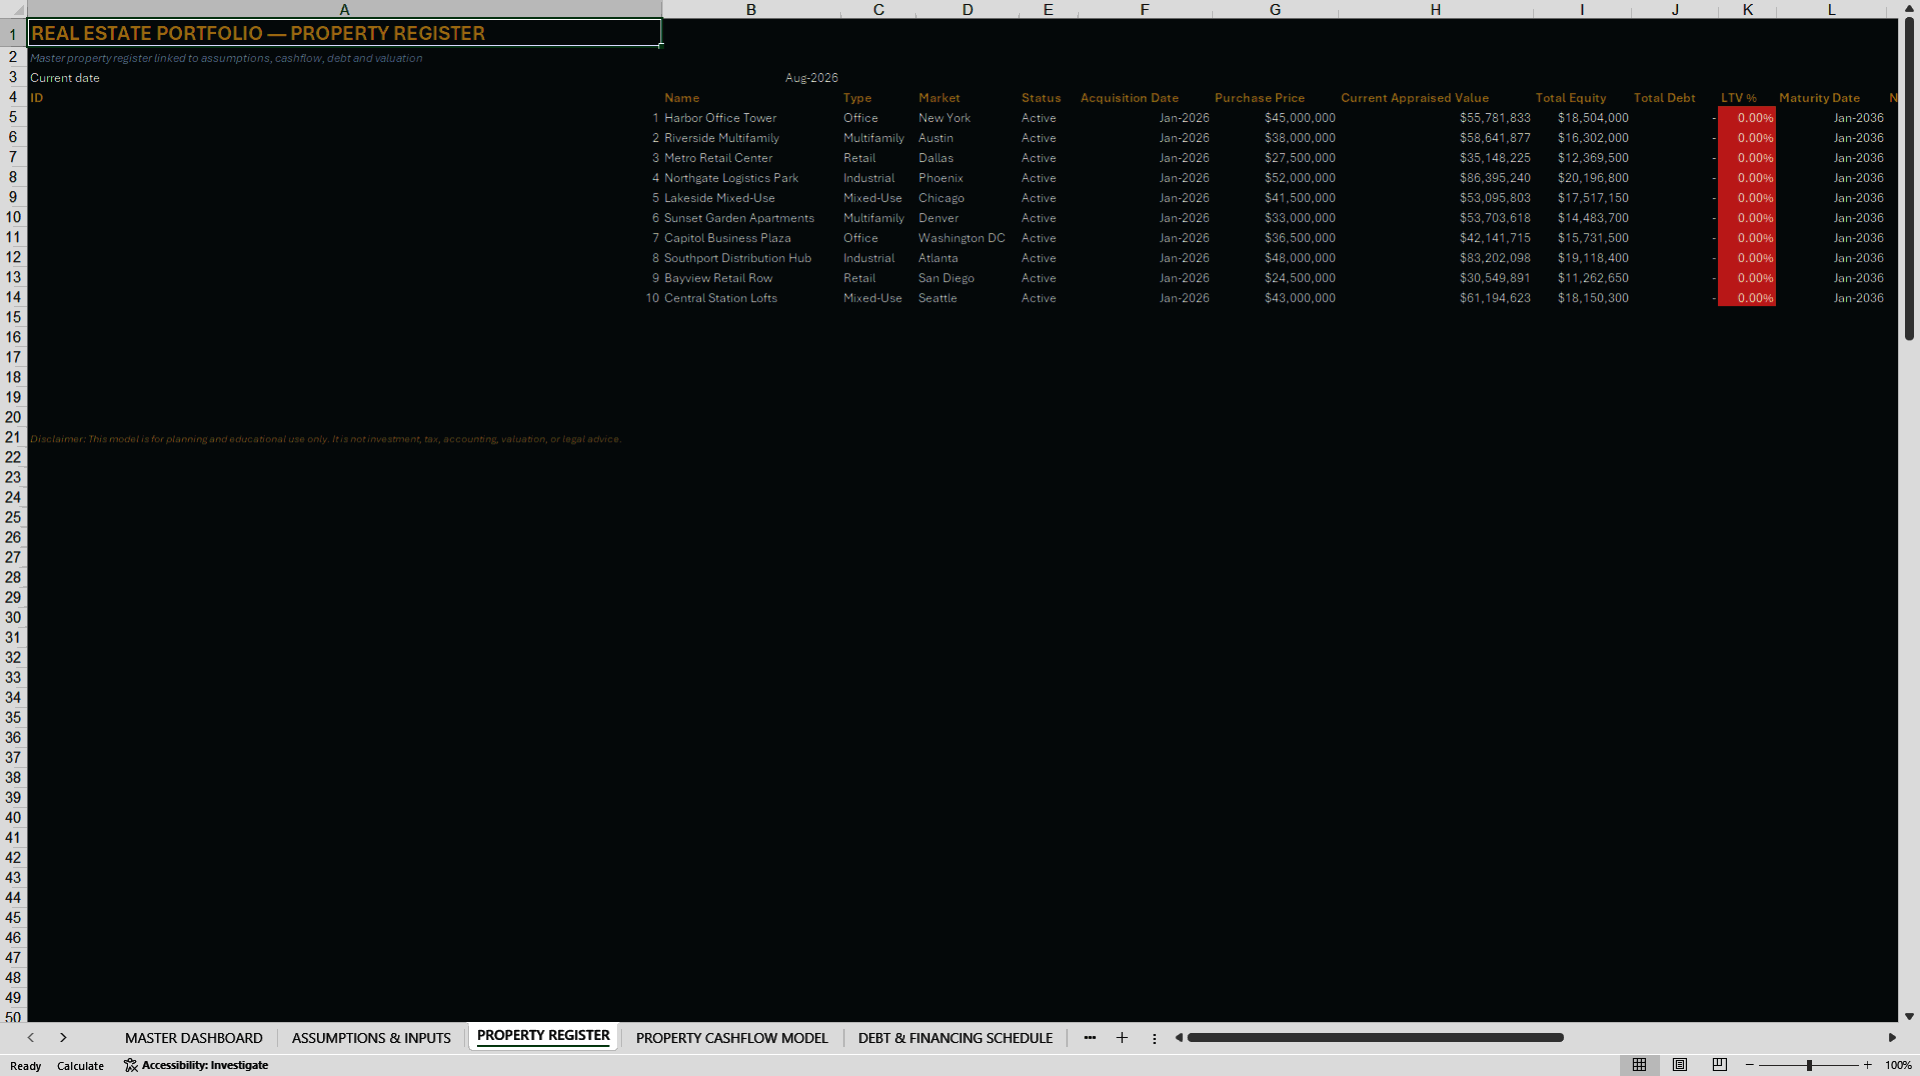
The Property Register gives users a consolidated view of every asset, including acquisition price, appraised value, equity investment, outstanding debt, LTV, maturity date, trailing NOI, cap rate and occupancy.
It is linked to the assumptions, operating model, debt schedules and valuation analysis, helping users trace property-level information throughout the workbook.
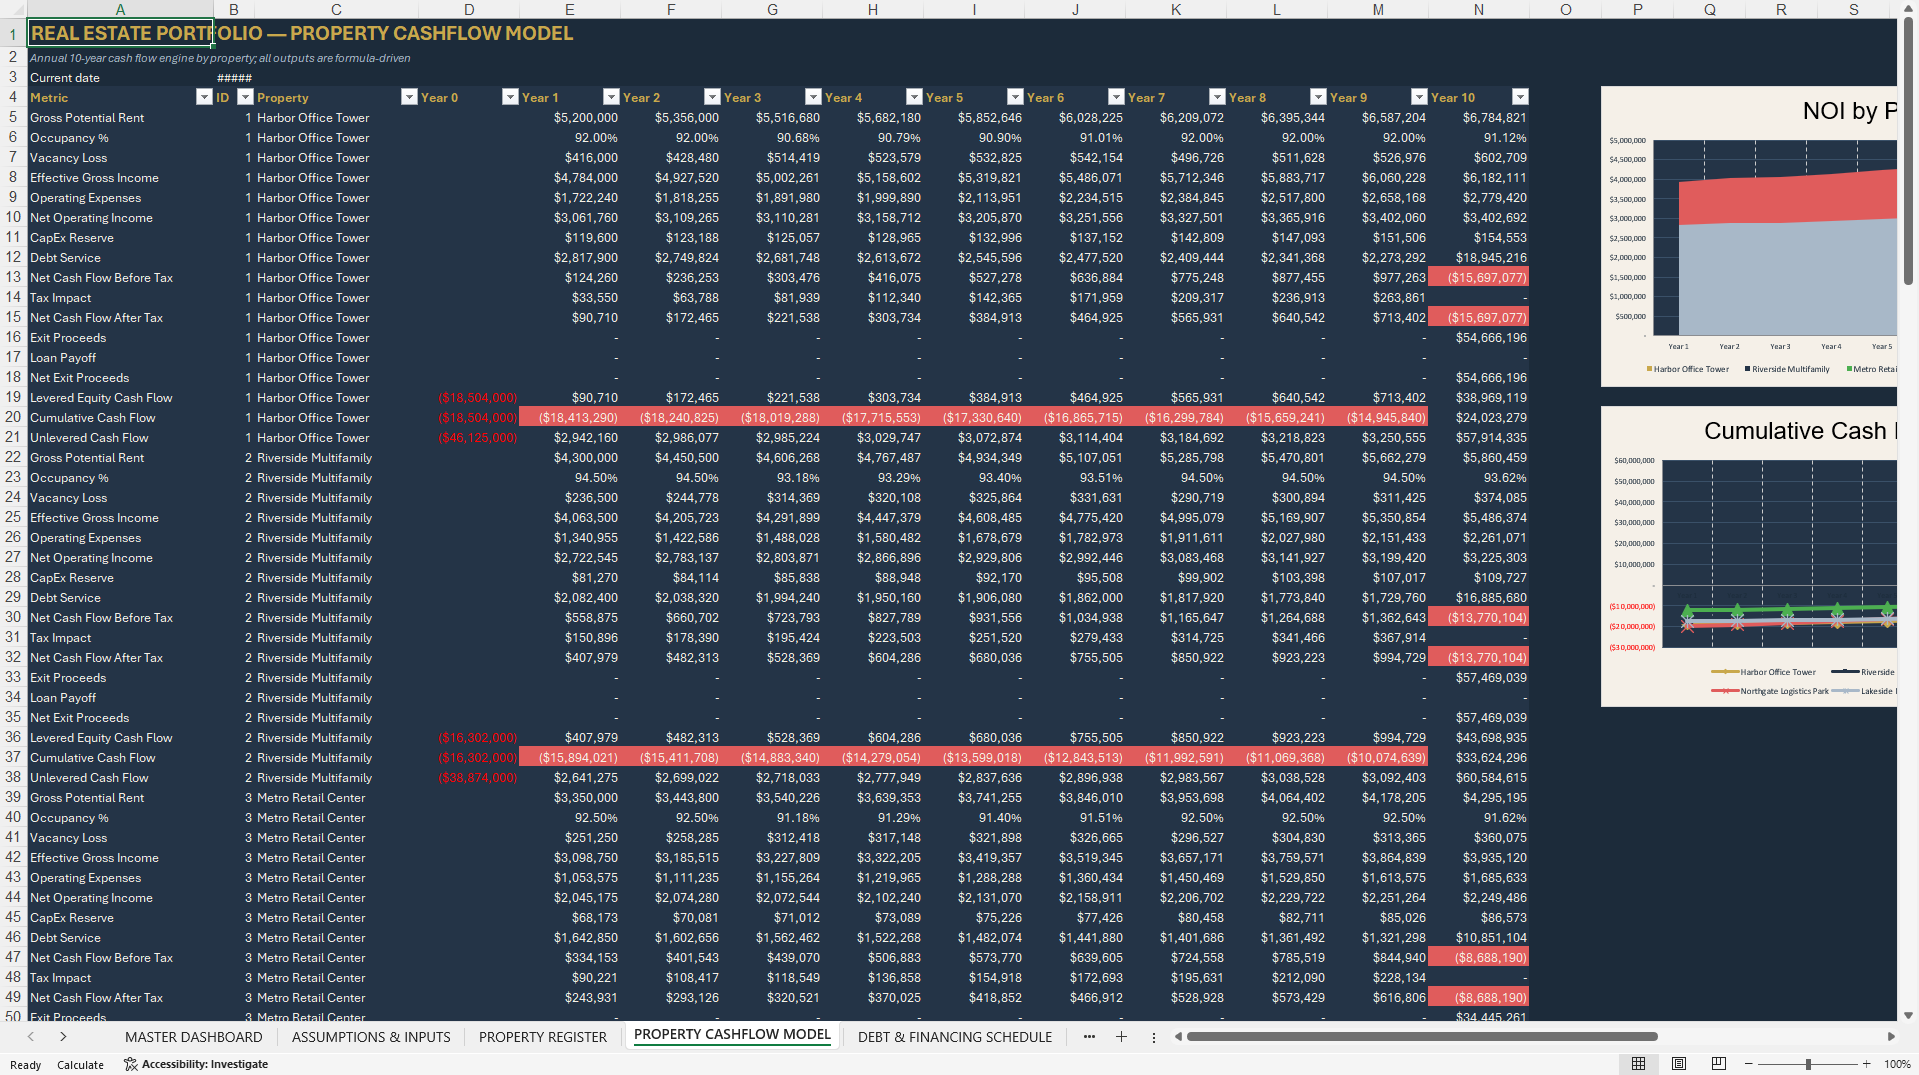
📈 Ten-year property cash-flow engine
The model develops annual cash flows for each property and calculates:
Gross potential rent.
Occupancy and vacancy loss.
Effective gross income.
Operating expenses.
Net operating income.
Capital expenditure reserves.
Debt service.
Net cash flow before and after tax.
Exit proceeds and loan payoff.
Levered equity cash flow.
Cumulative cash flow.
Unlevered cash flow.
Property-specific growth, occupancy and exit assumptions flow into the schedules, allowing each asset to retain its own operating profile while remaining part of a consolidated portfolio model.
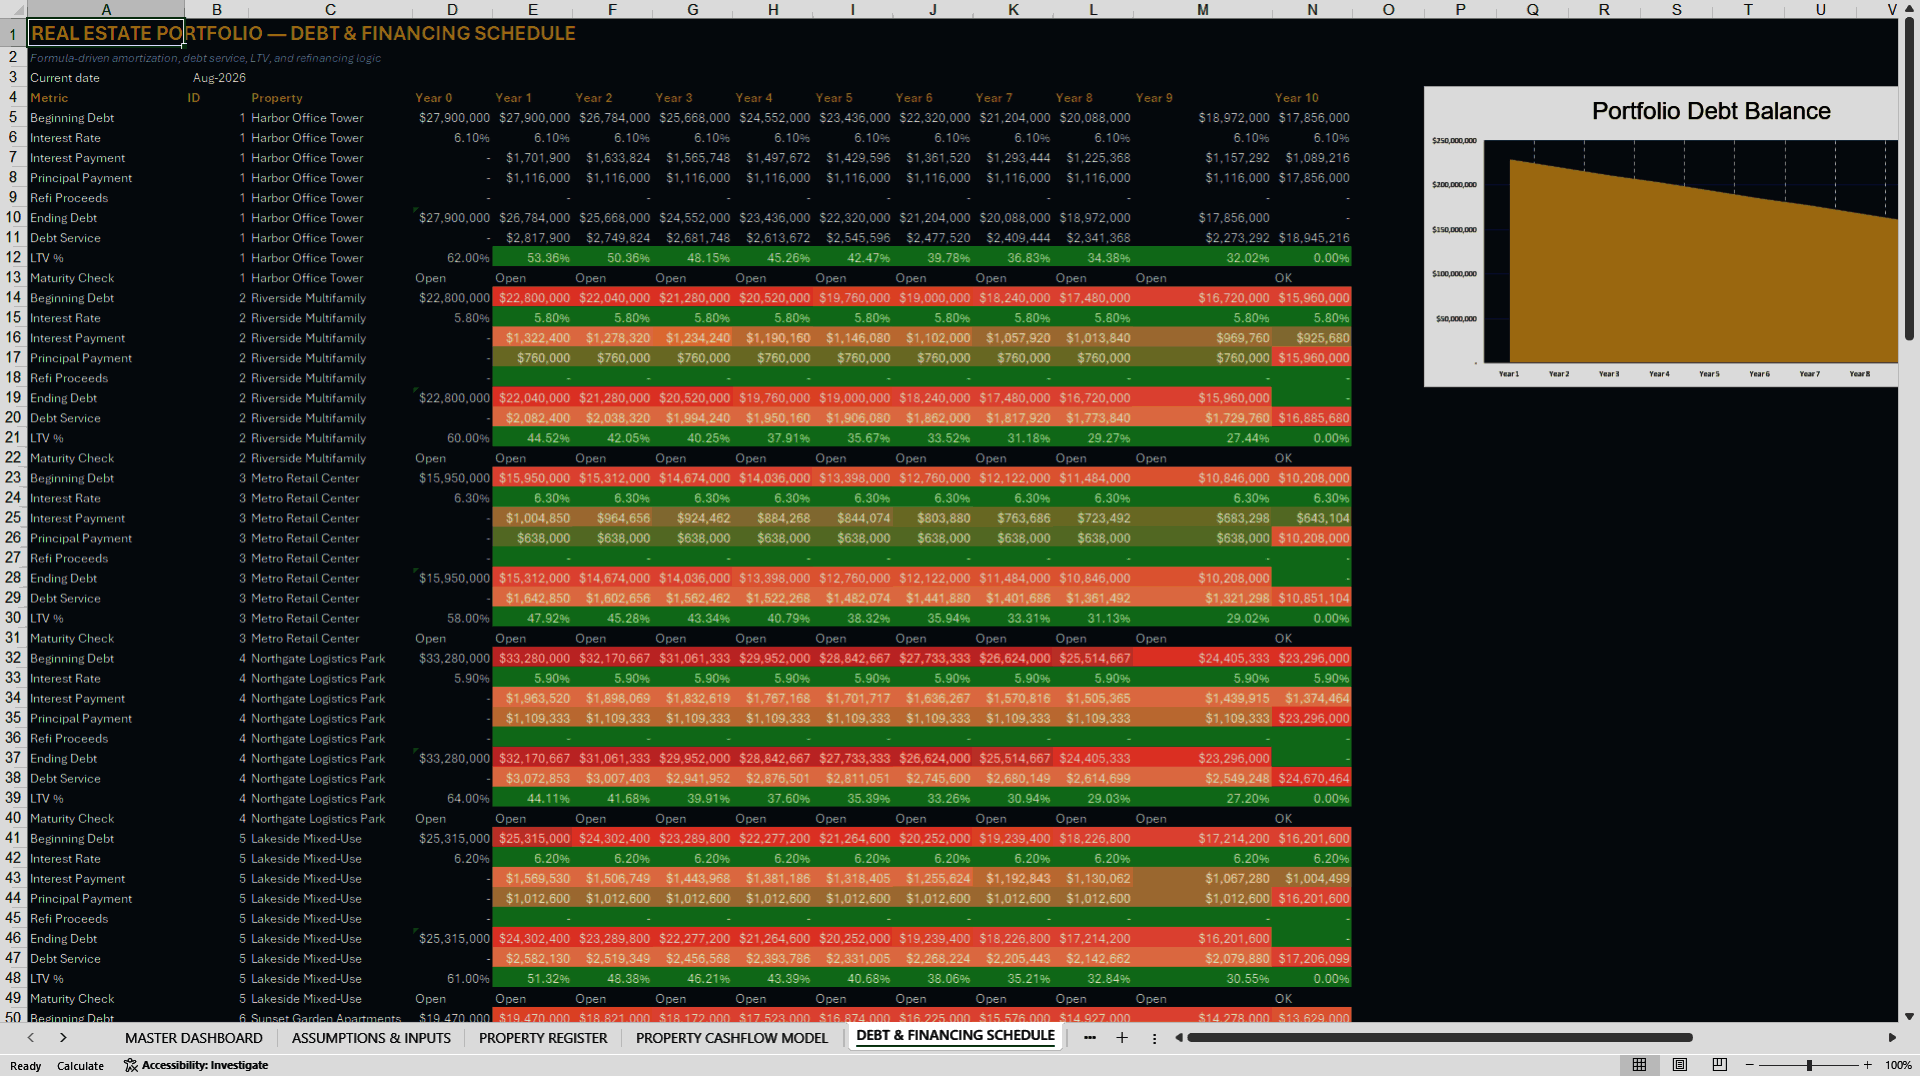
💳 Debt and financing schedule
The financing module calculates debt movements over the holding period, including:
Beginning and ending debt balances.
Interest payments.
Principal repayments.
Annual debt service.
Loan-to-value ratios.
Maturity checks.
Loan origination fees.
Prepayment penalties.
Optional refinancing assumptions and proceeds.
The schedule connects directly to property cash flows, returns and portfolio KPIs, making financing assumptions visible throughout the model.
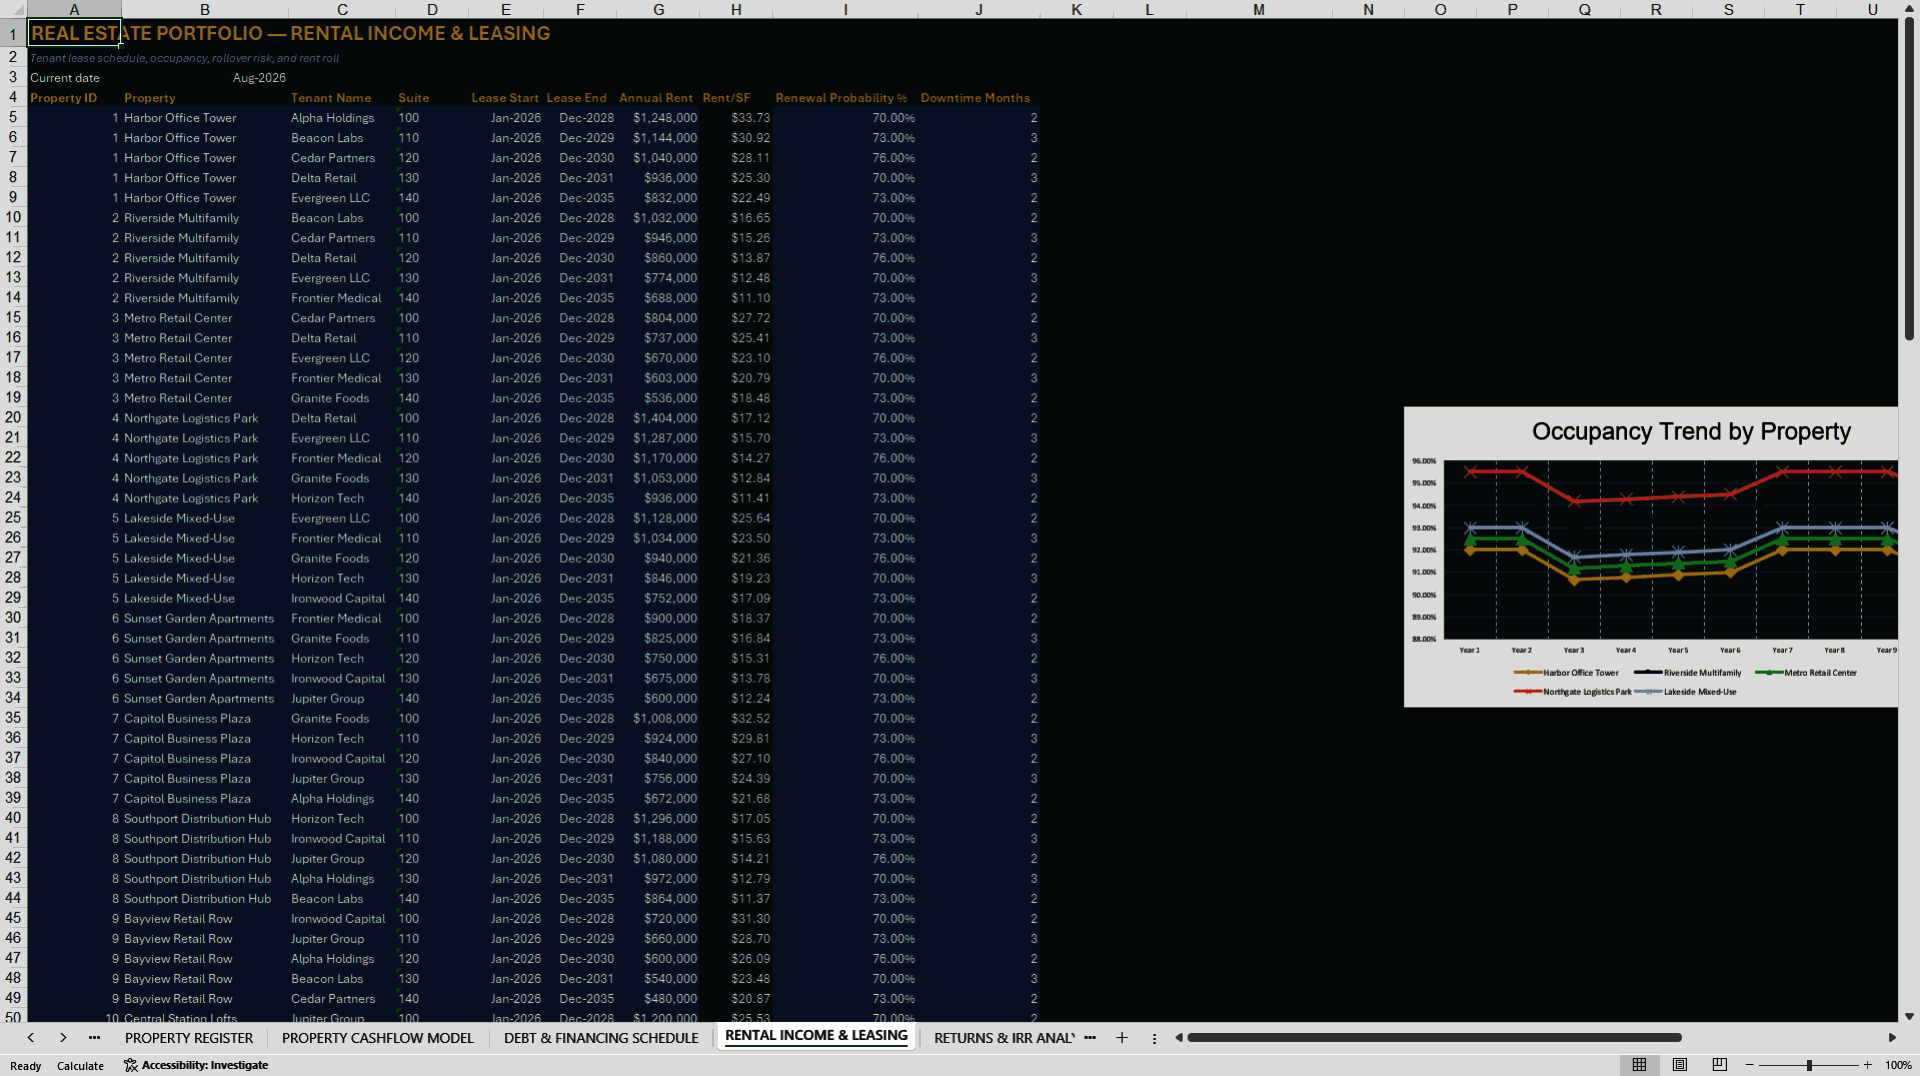
🏬 Rental income and leasing analysis
The leasing module tracks property-level rental performance and provides visibility over gross potential rent, occupancy, vacancy loss, effective rental income, rental growth and occupancy trends.
This helps users assess how leasing assumptions influence NOI, valuation and investor returns rather than treating revenue as a simple top-down growth line.
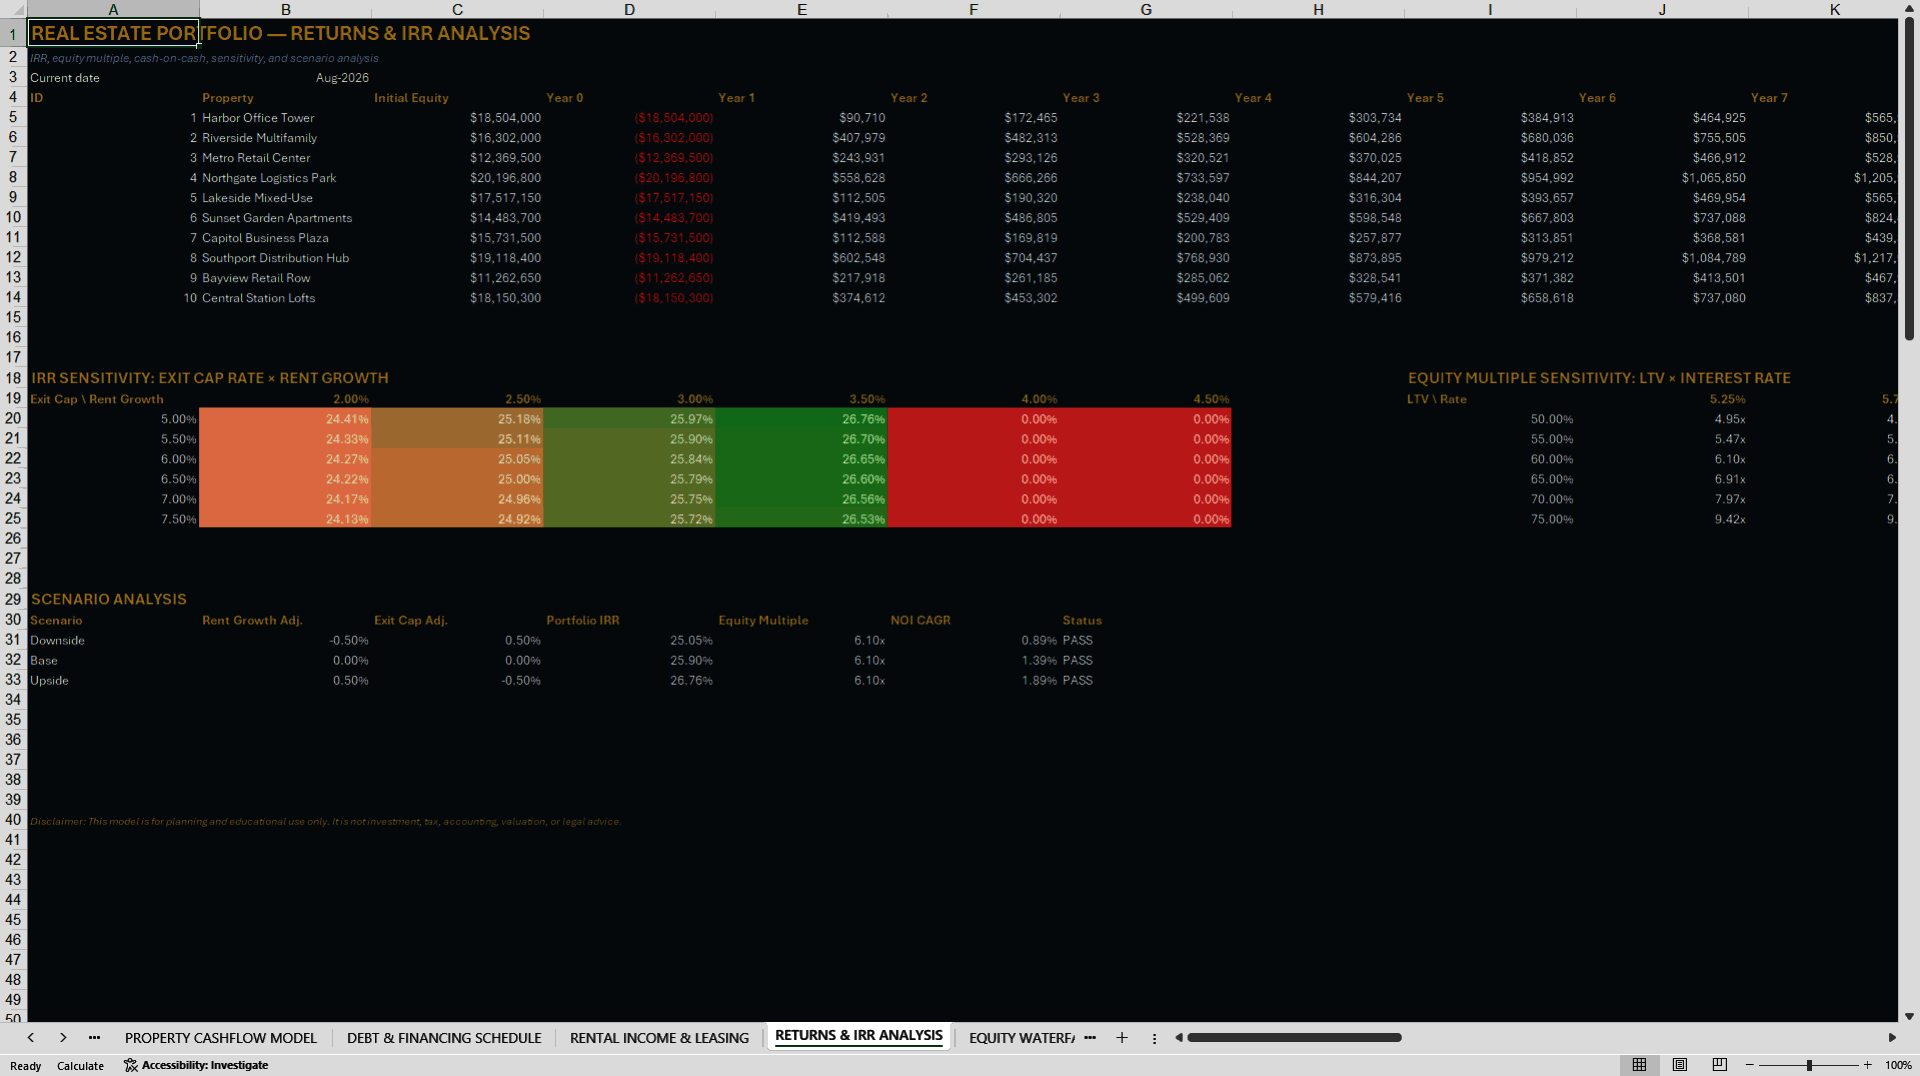
📊 Returns and IRR analysis
The Returns worksheet brings together the investment cash flows for each property and calculates important return measures, including:
Property-level IRR.
Unlevered IRR.
Equity multiple.
Cash-on-cash yield.
Payback period.
Target IRR comparison.
Above-target or below-target status.
Net present value indicators.
The model also provides a weighted portfolio IRR and consolidated equity multiple, allowing users to compare individual asset performance with the total portfolio.
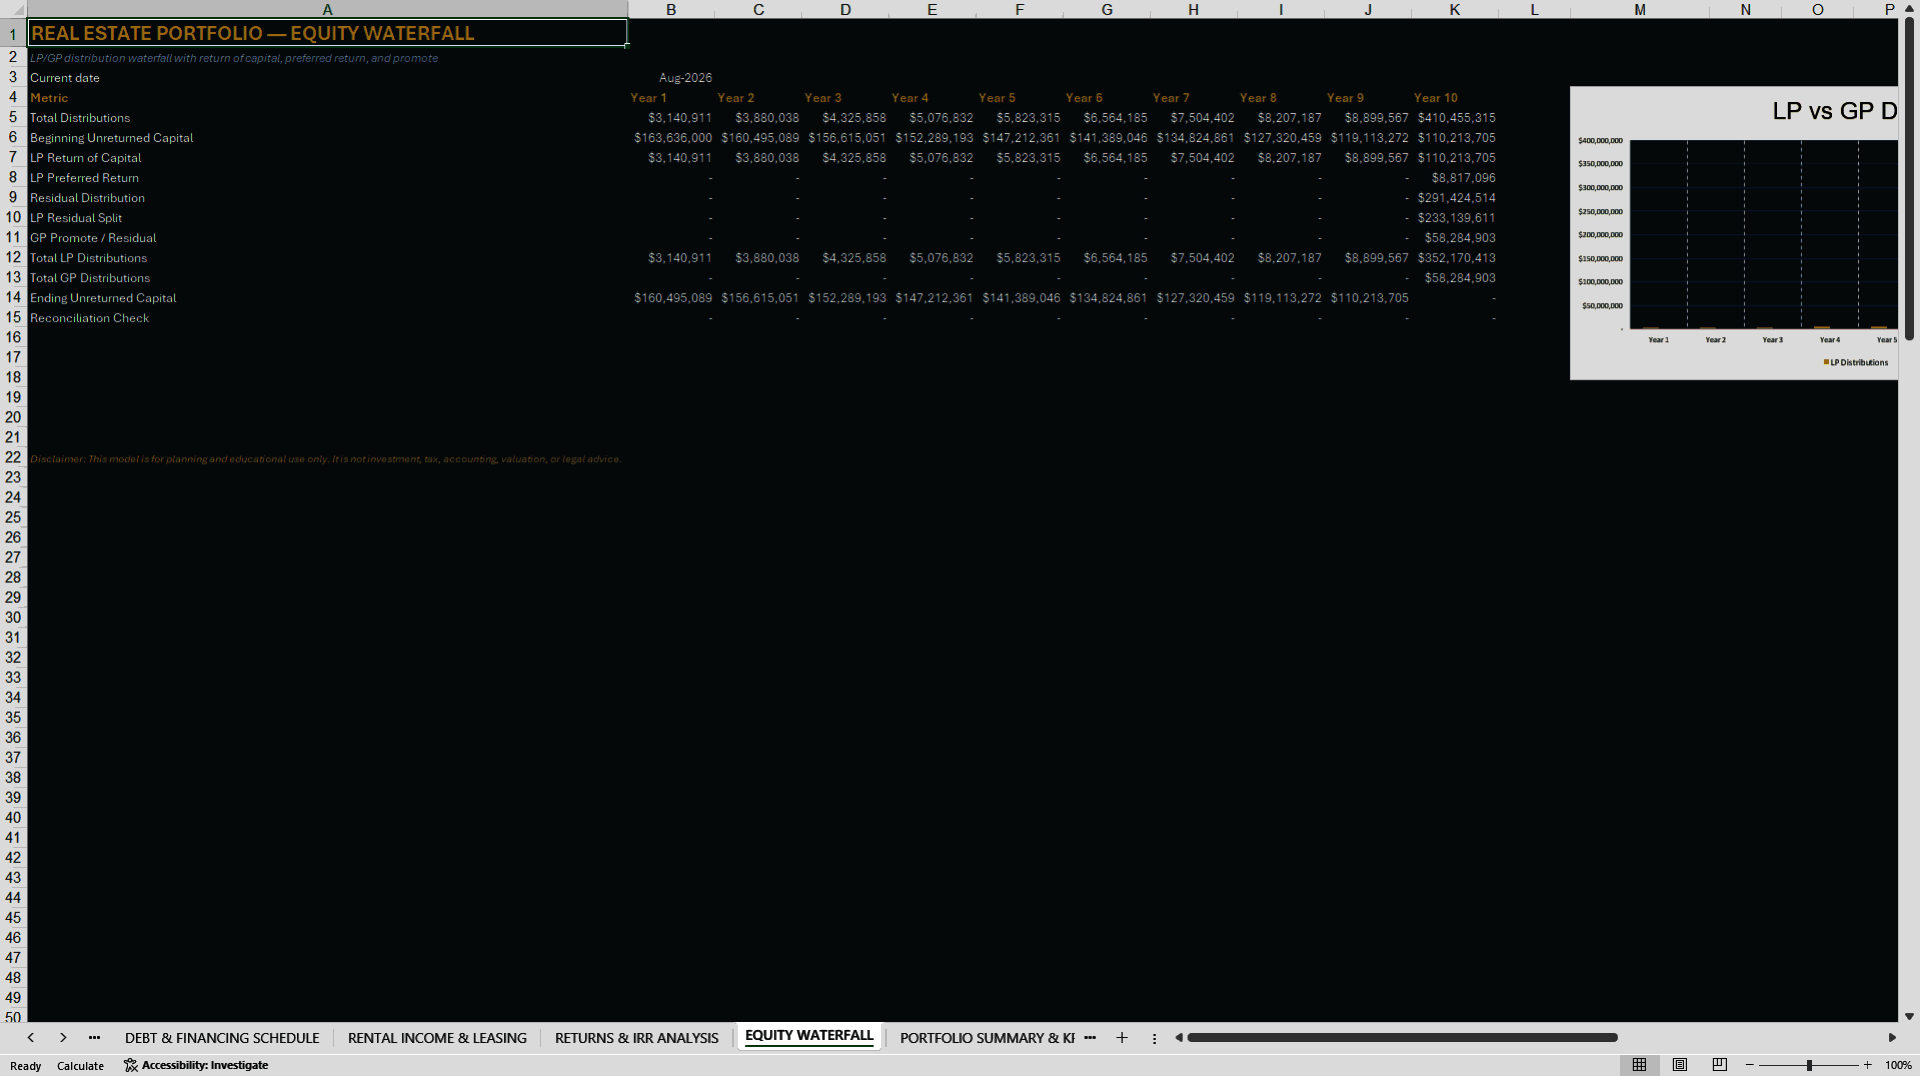
💰 LP/GP equity waterfall
The waterfall module allocates annual portfolio distributions between limited partners and the general partner.
It models:
Beginning unreturned capital.
Return of LP capital.
Preferred return.
Residual distributions.
LP residual share.
GP promote or residual share.
Total LP distributions.
Total GP distributions.
Ending unreturned capital.
Distribution reconciliation.
Users can adjust the preferred return, below-hurdle split, above-hurdle split and catch-up assumption in the central inputs sheet.
📌 Portfolio summary and KPIs
The consolidated portfolio schedule reports:
Gross potential rent.
Effective gross income.
Net operating income.
Capital reserves.
Debt service.
After-tax cash flow.
Exit proceeds.
Levered equity cash flow.
Distributions.
Ending debt.
Portfolio value.
Weighted average occupancy.
Blended cap rate.
NOI CAGR.
A property KPI table compares IRR, yield, LTV, occupancy, NOI, equity multiple and cap rate across the portfolio. Conditional formatting and charts make it easier to identify relative performance and potential review areas.
🏙️ Market and valuation analysis
The valuation module compares property economics using multiple perspectives:
Purchase price versus current appraised value.
Gain or loss and percentage appreciation.
Market cap rate versus property cap rate.
Cap-rate spread.
DCF value.
Present-value premium or discount.
Portfolio weight.
Annual mark-to-market value by property.
This provides a structured view of valuation differences and portfolio concentration without relying on a single valuation method.
📊 Master dashboard and executive summary
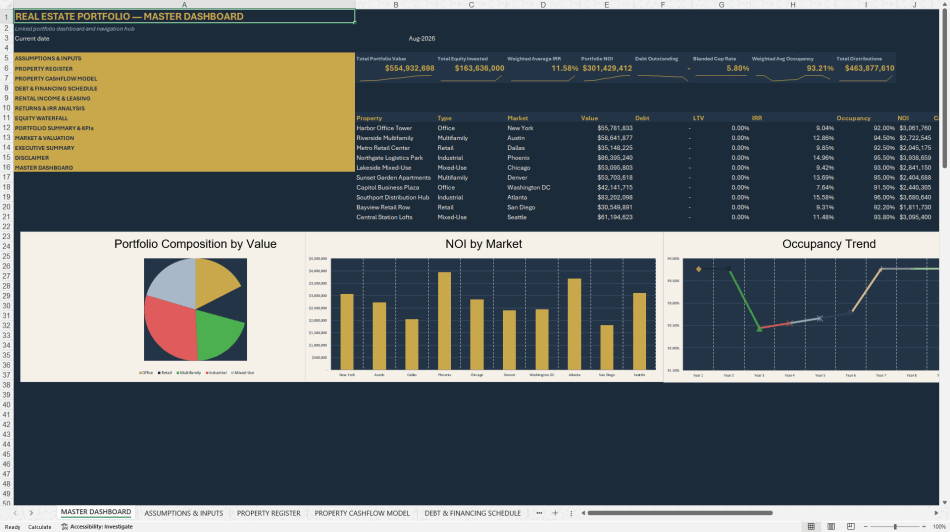
The dashboard presents the most important portfolio outputs, including total value, total equity invested, weighted average IRR, portfolio NOI, debt, blended cap rate, weighted occupancy and total distributions.
Supporting visuals show:
Portfolio composition by value.
NOI by market.
Occupancy trend.
Property-level returns.
Debt reduction.
Rental and cash-flow trends.
Equity waterfall allocation.
Valuation and KPI comparisons.
The Executive Summary converts the model into a concise investment-review page with deal strategy, investment highlights, key financial metrics and status indicators.
✅ Integrity checks and model governance
The workbook includes five visible model-integrity controls covering:
Waterfall reconciliation.
Completion of all property records.
Non-negative debt balances.
Availability of property IRR outputs.
Dashboard navigation coverage.
The illustrative workbook currently shows all five controls passing and contains no visible Excel formula errors.
🗂️ Workbook structure
The model contains 12 purpose-built worksheets:
Master Dashboard.
Assumptions & Inputs.
Property Register.
Property Cashflow Model.
Debt & Financing Schedule.
Rental Income & Leasing.
Returns & IRR Analysis.
Equity Waterfall.
Portfolio Summary & KPIs.
Market & Valuation.
Executive Summary.
Disclaimer and Model Checks.
🧭 How to work with the model
Save a separate working copy and review the disclaimer.
Update the portfolio-level operating, financing and waterfall assumptions.
Replace the 10 illustrative properties with validated investment data.
Review rental income and operating projections for each property.
Confirm debt terms, amortization and any refinancing assumptions.
Review property cash flows, exit proceeds and return calculations.
Evaluate the LP/GP waterfall and distribution allocation.
Review portfolio KPIs, valuation results and the executive summary.
Confirm every model-integrity check passes before using the outputs.
👥 Who should use this model?
Real estate private equity professionals.
Property investors and investment managers.
Asset and portfolio managers.
Real estate developers and operators.
Acquisition and underwriting analysts.
Corporate finance and FP&A teams.
Family offices and investment advisers.
Lenders, consultants and transaction advisers.
Business-school and real estate finance students.
💡 Why purchase this model?
Analysing a multi-property portfolio requires more than adding together standalone property models. The portfolio must preserve asset-specific assumptions while consolidating operating results, debt, exit values, cash flows and investor distributions.
This template provides an integrated structure that can save model-development time, improve consistency, support portfolio comparisons, increase traceability and make investment results easier to communicate.
Got a question about the product? Email us at support@flevy.com or ask the author directly by using the "Ask the Author a Question" form. If you cannot view the preview above this document description, go here to view the large preview instead.
Source: Best Practices in Real Estate, Integrated Financial Model Excel: Real Estate Portfolio Investment, Cash Flow, IRR, Waterfall Excel (XLSX) Spreadsheet, PDMM Financial Models
ABOUT THE AUTHOR

PDMM Financial Models develops professional, decision-ready Excel models for business owners, entrepreneurs, investors, consultants, analysts, and finance teams. Our objective is to transform complex business assumptions into clear, structured analysis that supports better planning and investment decisions.
Our models cover business planning, forecasting, budgeting, feasibility analysis,
... [read more]
Ask the Author a Question
You must be logged in to contact the author.




























