
 Click main image to view in full screen. Unlock all 15 preview images:
Real Estate Development Pro Forma – Excel XLSX
Excel (XLSX)


BENEFITS OF THIS DOWNLOADABLE EXCEL DOCUMENT
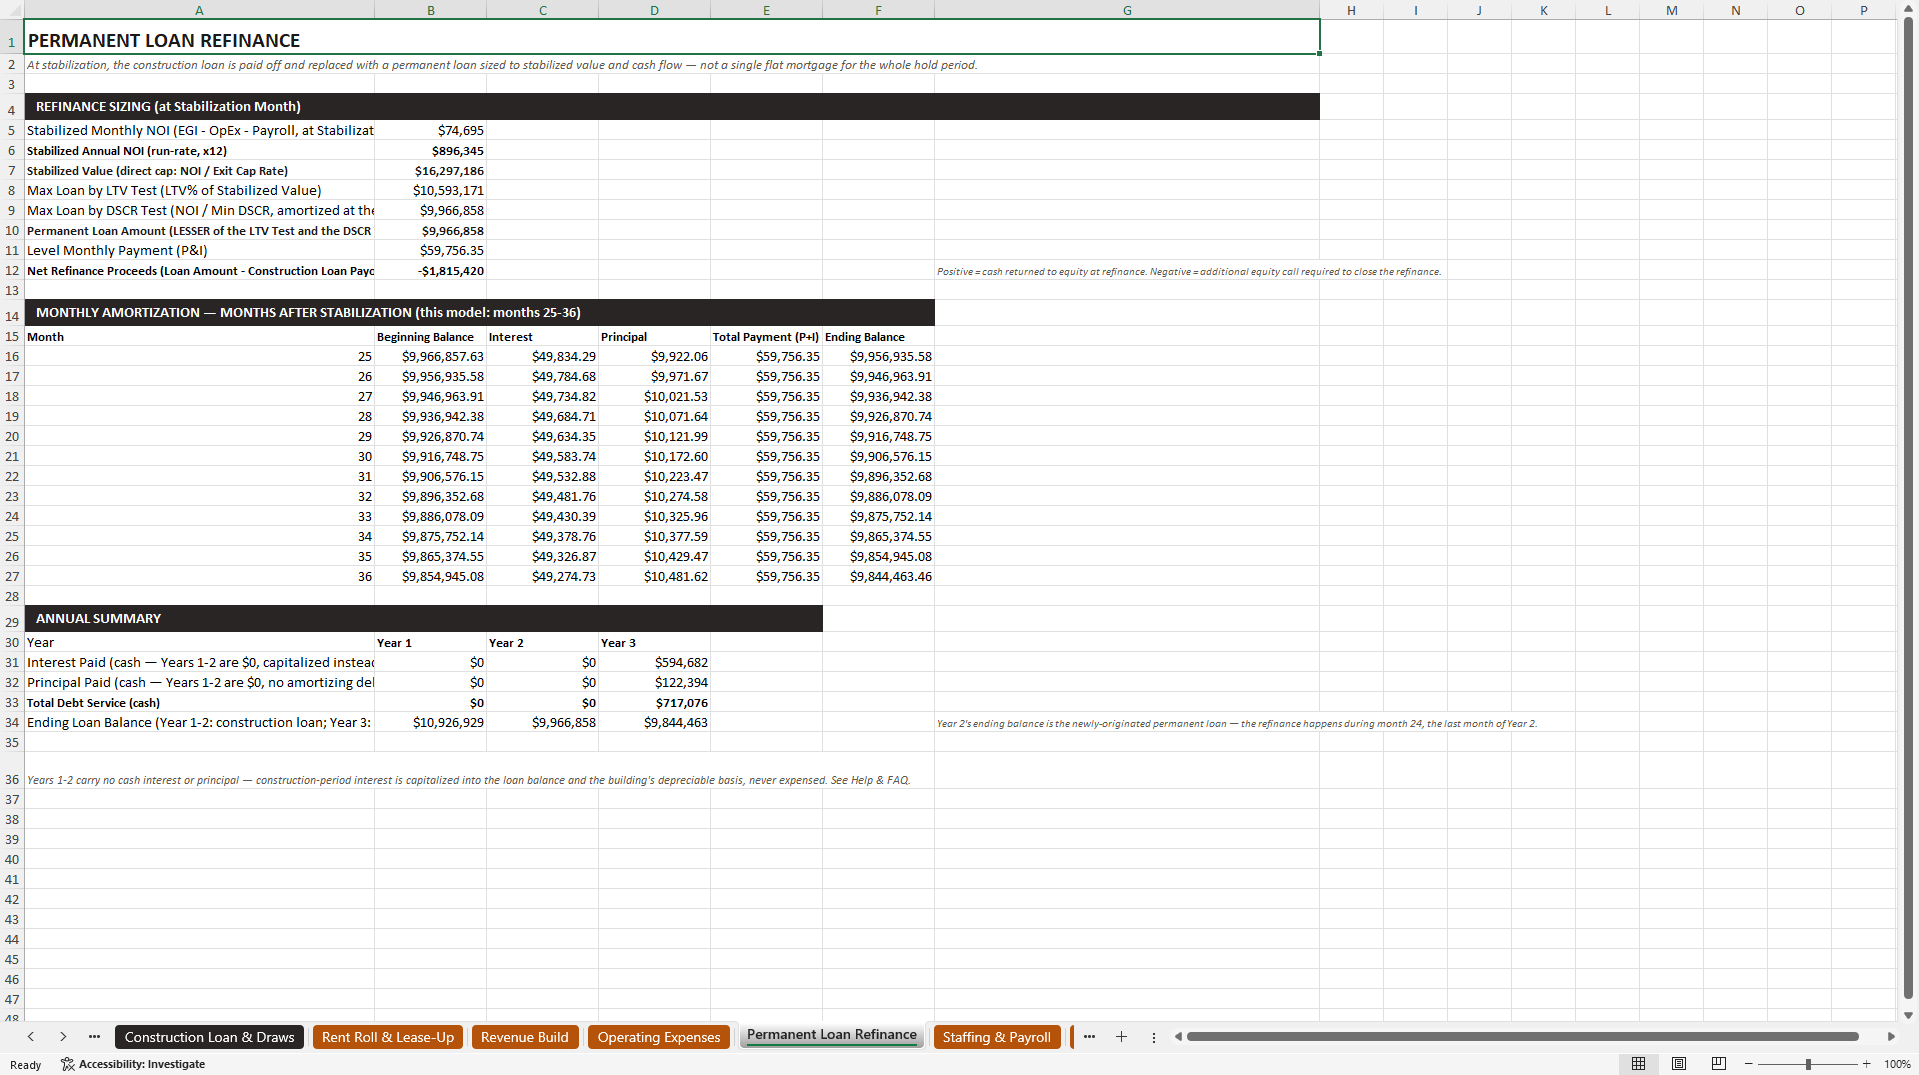
- Sizes the permanent refinance to the LESSER of an LTV test and a DSCR test, exactly how a real lender underwrites.
- Includes a genuine 2-tier LP/GP equity waterfall (8% preferred return, 80/20 promote) with separate LP/GP IRR and MOIC.
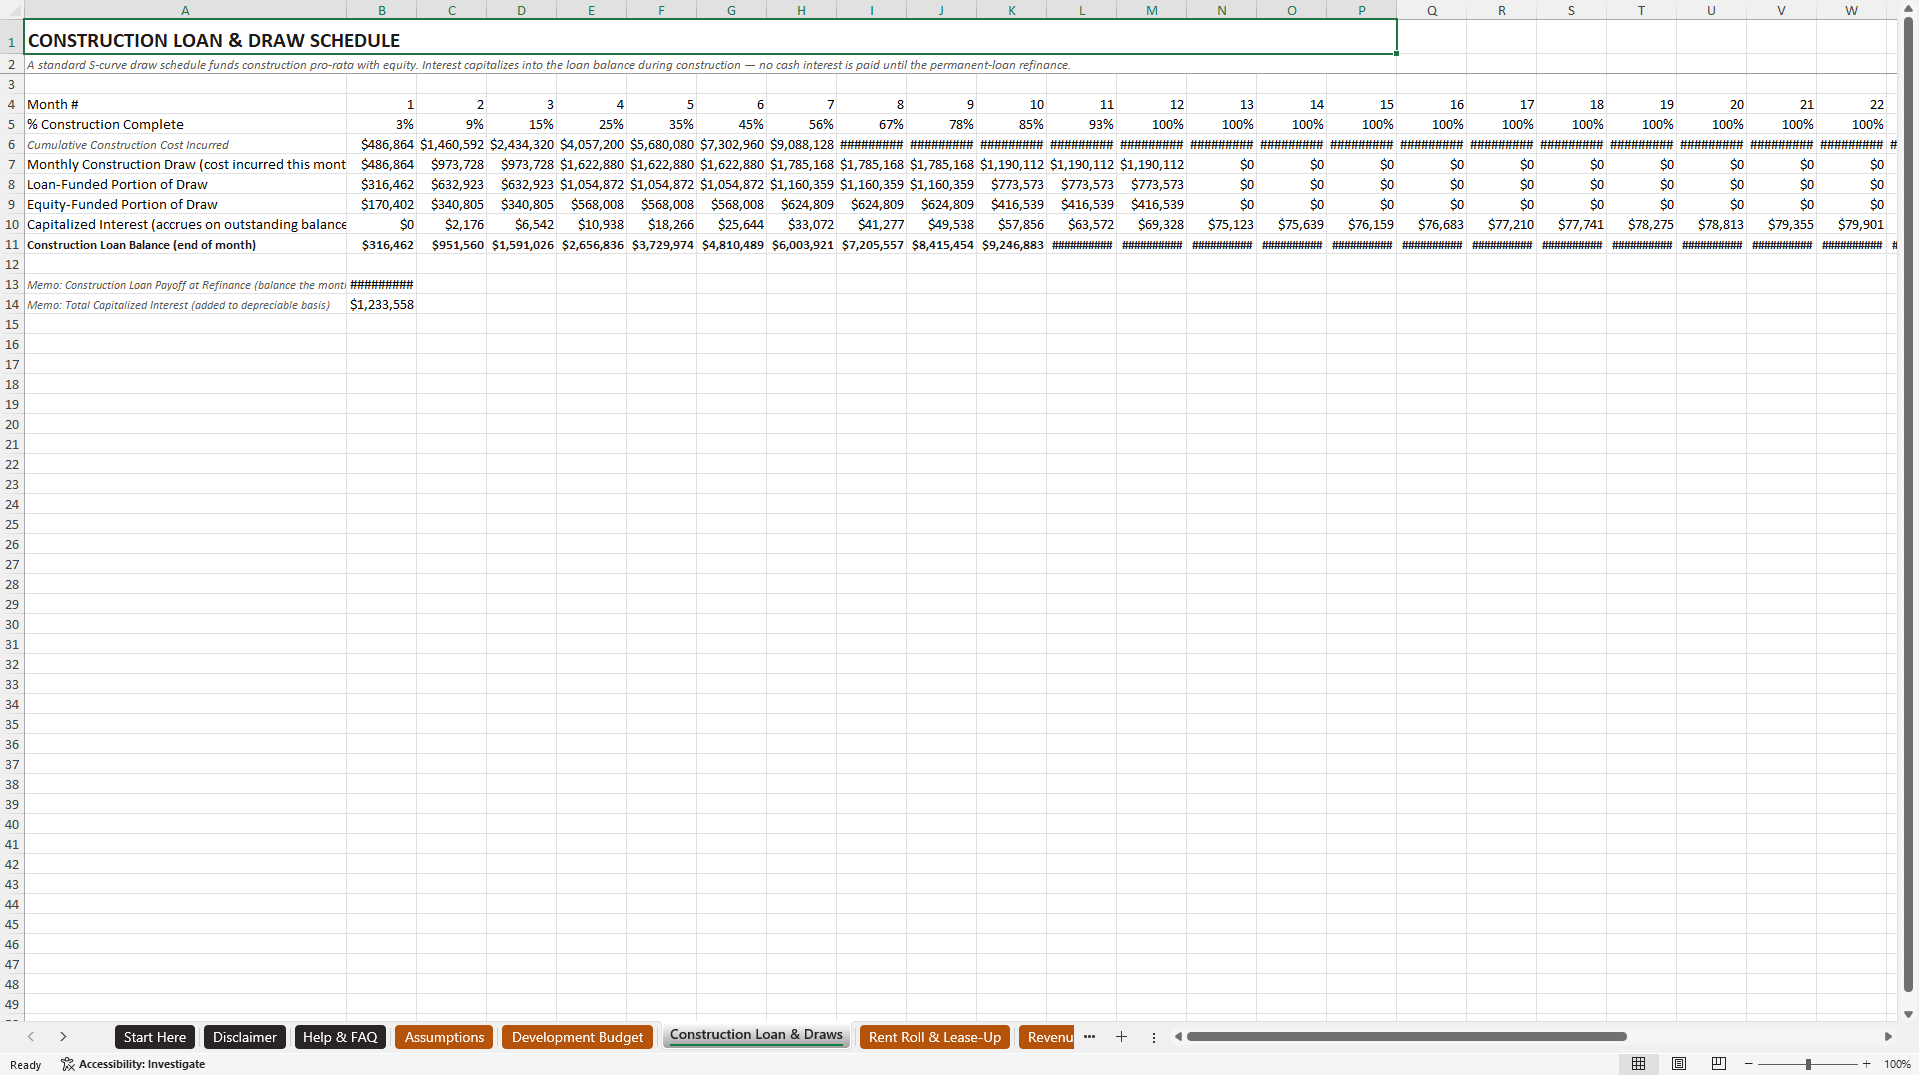
- Models a construction loan drawing in a real S-curve with capitalized interest, not a lump-sum assumption.
REAL ESTATE EXCEL DESCRIPTION
Most real estate pro forma templates stop at a static annual forecast and call it a development model. This one runs a continuous 36-month grid that actually models what happens during a ground-up development: a construction loan that draws in a real S-curve and capitalizes its own interest, a lease-up absorption curve with seasonality-adjusted leasing pace to stabilization, and a refinance into permanent debt sized the way a lender genuinely sizes it – to the LESSER of a loan-to-value test and a debt-service-coverage test, not a single assumed leverage ratio.
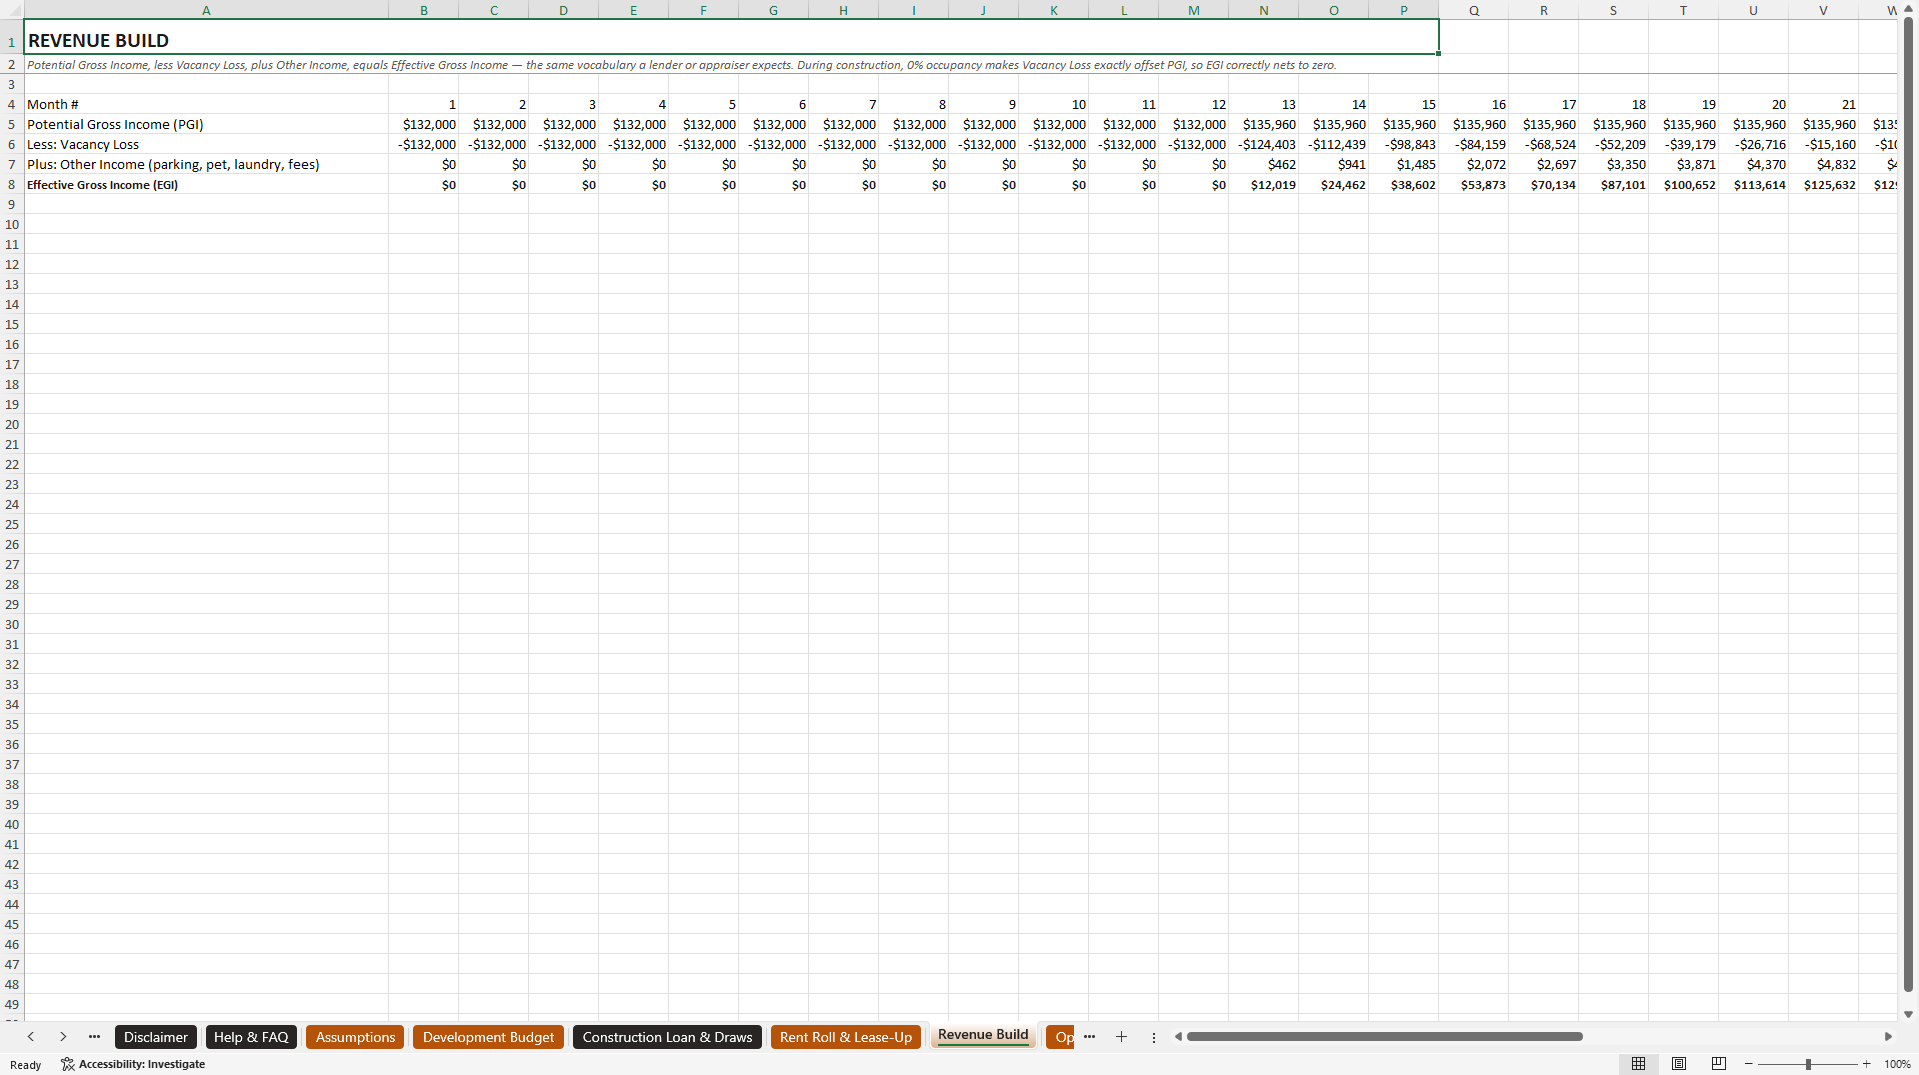
Revenue follows the classic institutional build: Potential Gross Income, less Vacancy Loss, plus Other Income, equals Effective Gross Income – the same structure an appraiser or acquisitions analyst would expect to see, not a simplified shortcut. On the equity side, a genuine 2-tier LP/GP waterfall – return of capital, then an 8% cumulative preferred return, then an 80/20 promote split above it – produces separate LP and GP IRR and MOIC, something almost no single-tab calculator actually attempts.
Year 3 DSCR clears the 1.25x lender minimum at 1.31x, sized directly from the permanent-loan mechanics described above rather than assumed. The Development Budget tab breaks out land, hard cost, soft cost, and contingency with a full sources-and-uses table, and CapEx & Depreciation applies the IRS's 27.5-year straight-line schedule starting the month construction actually completes.
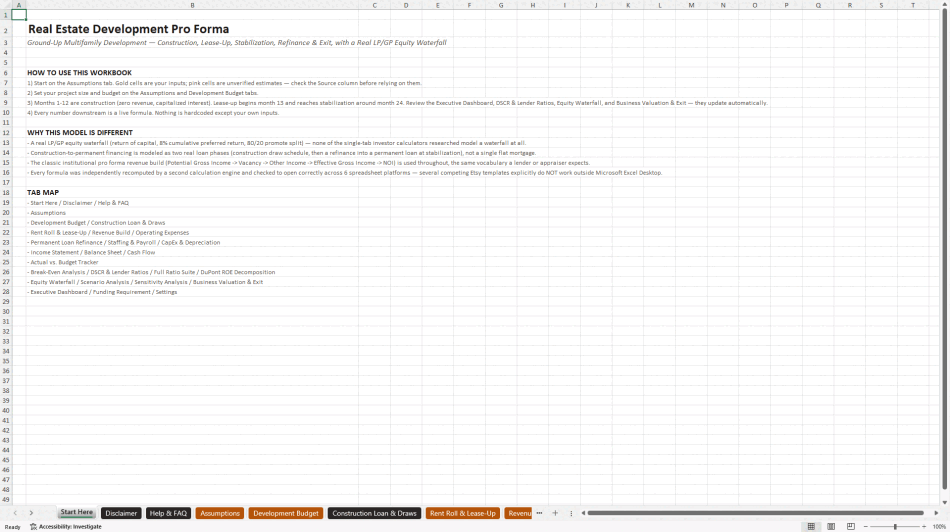
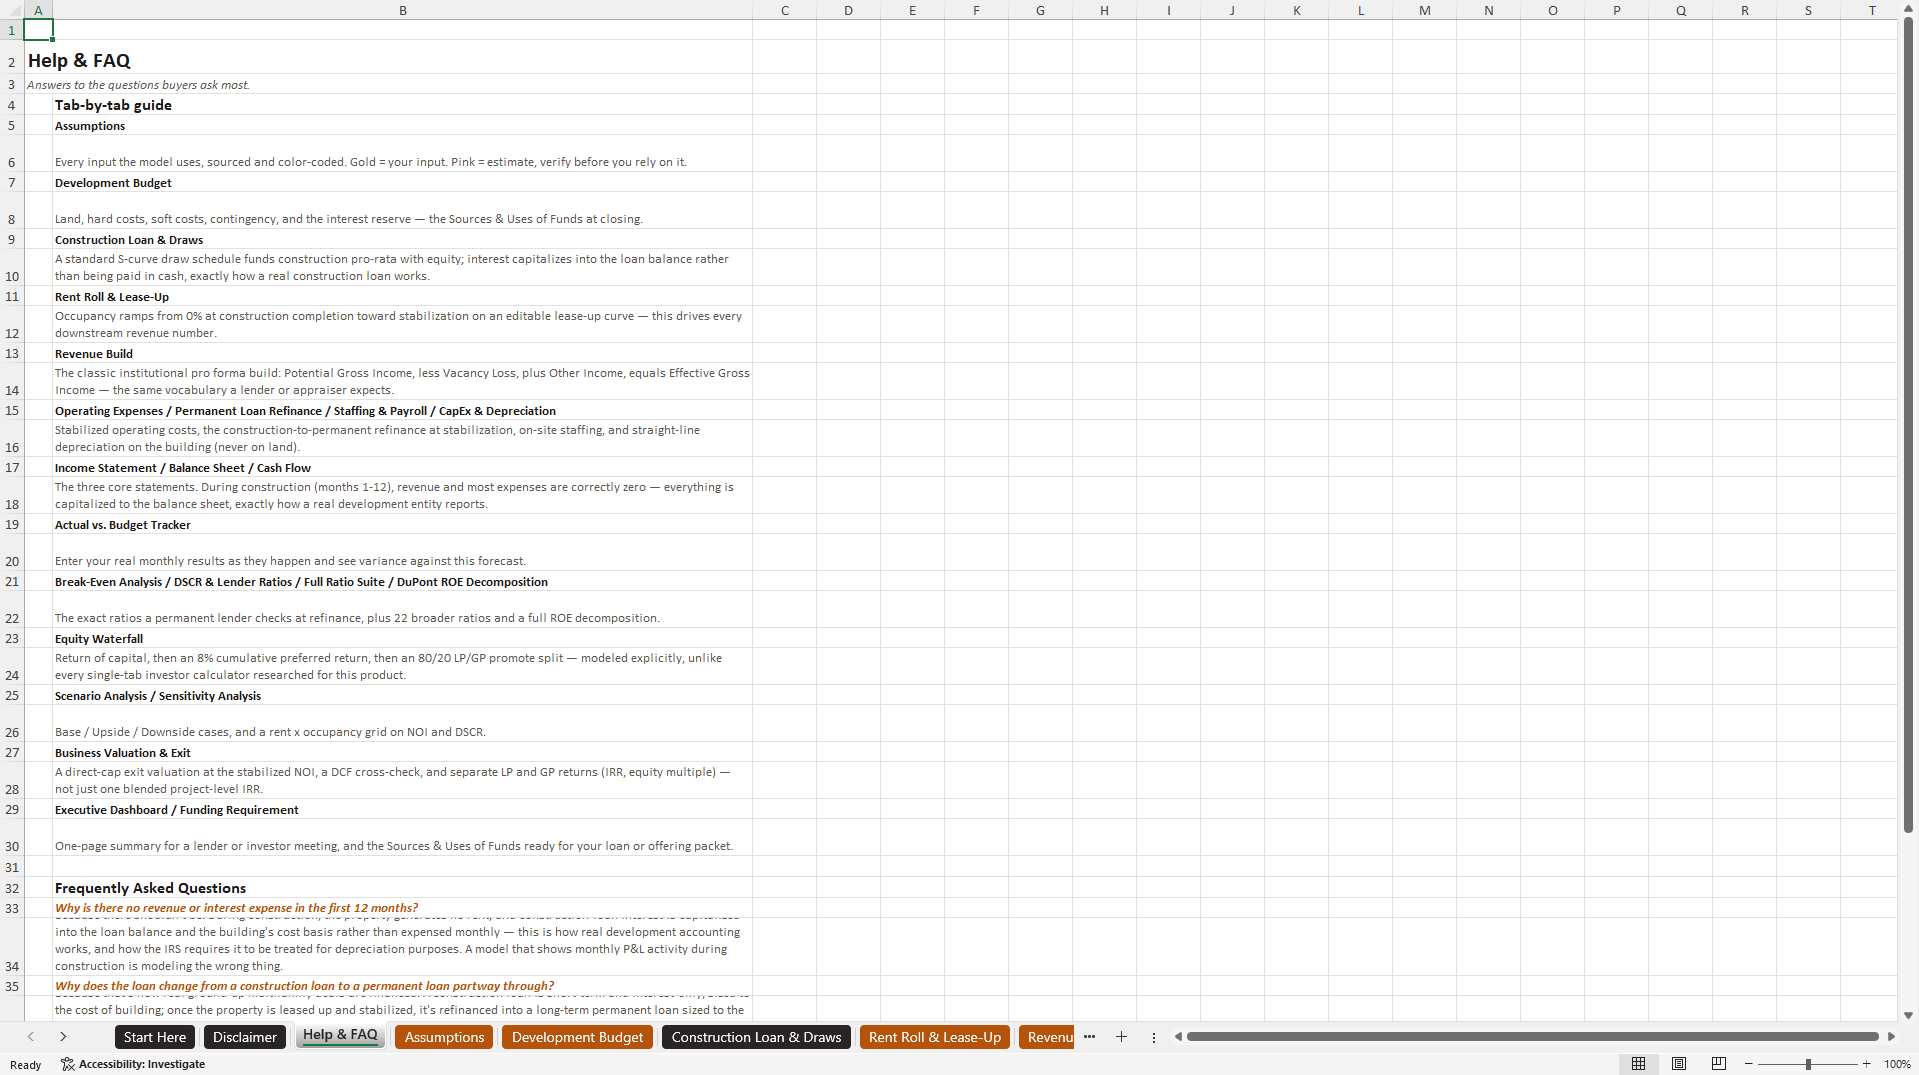
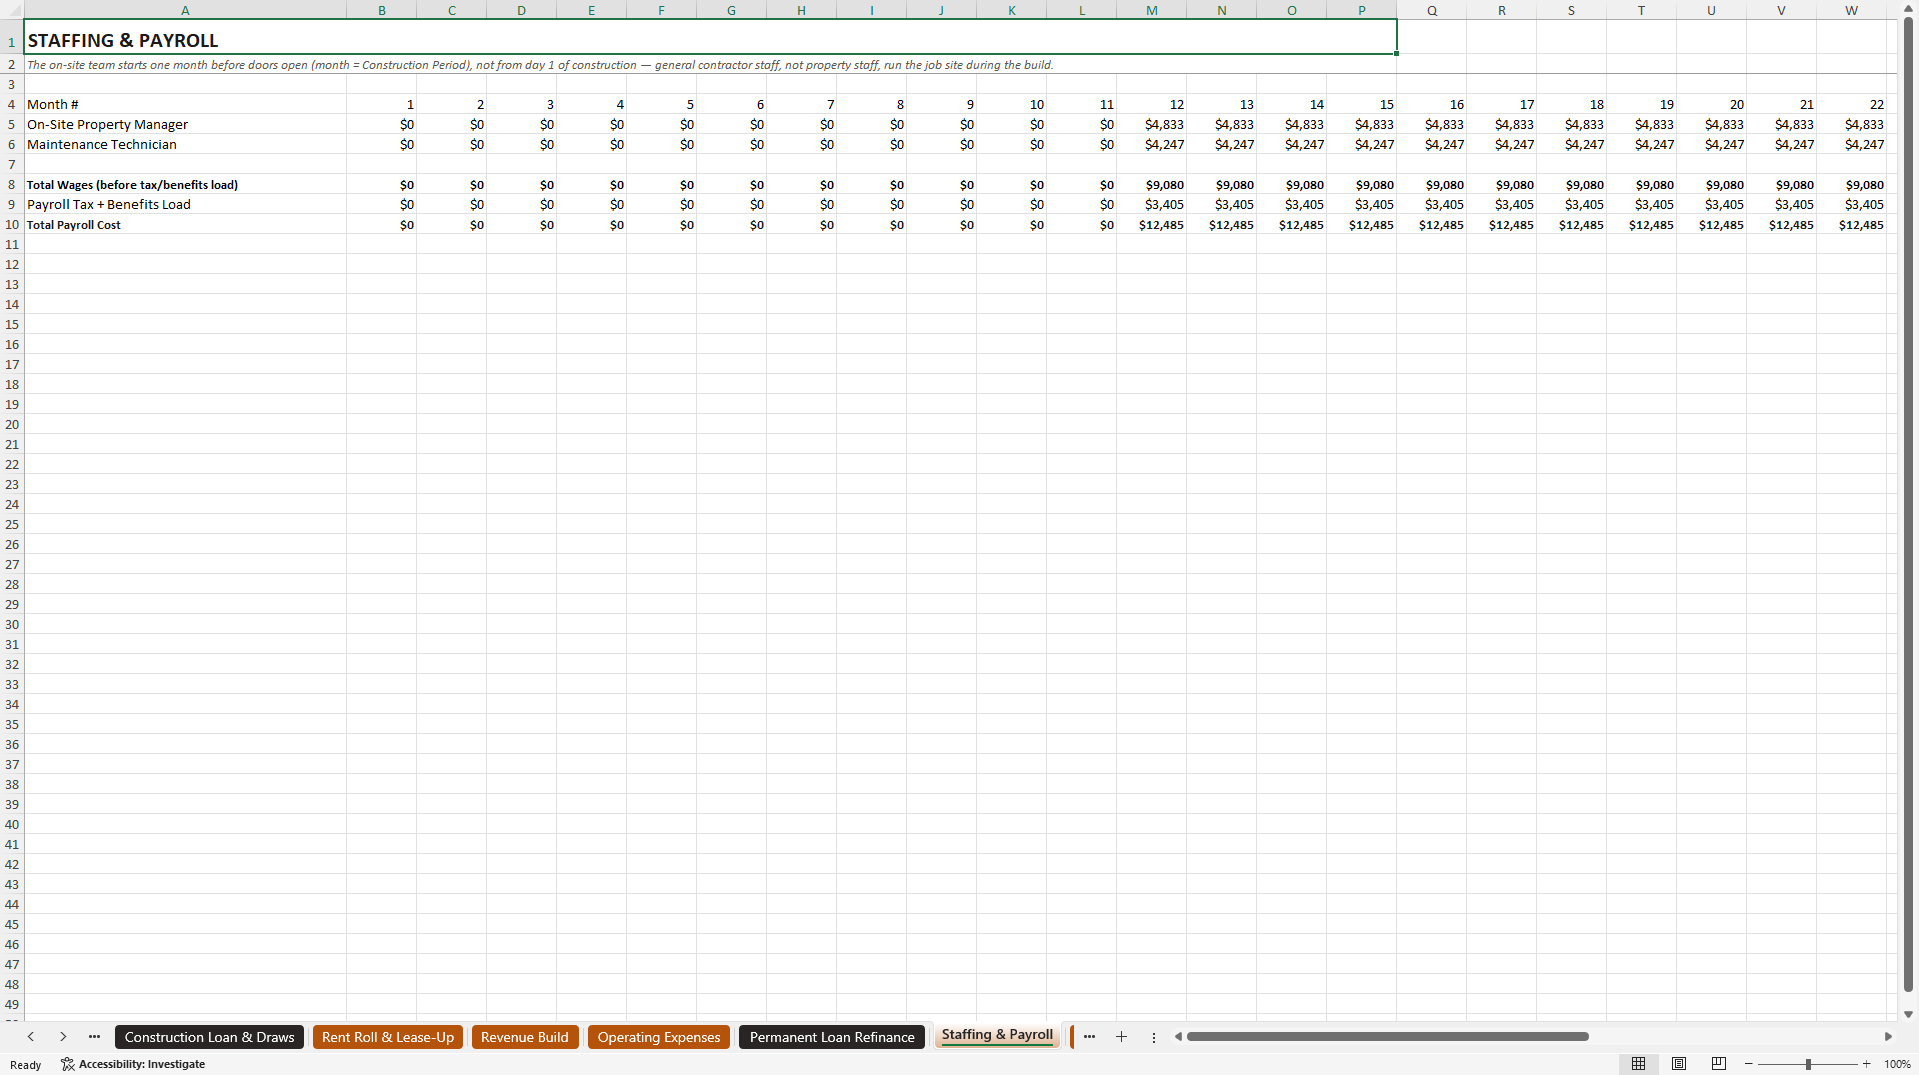
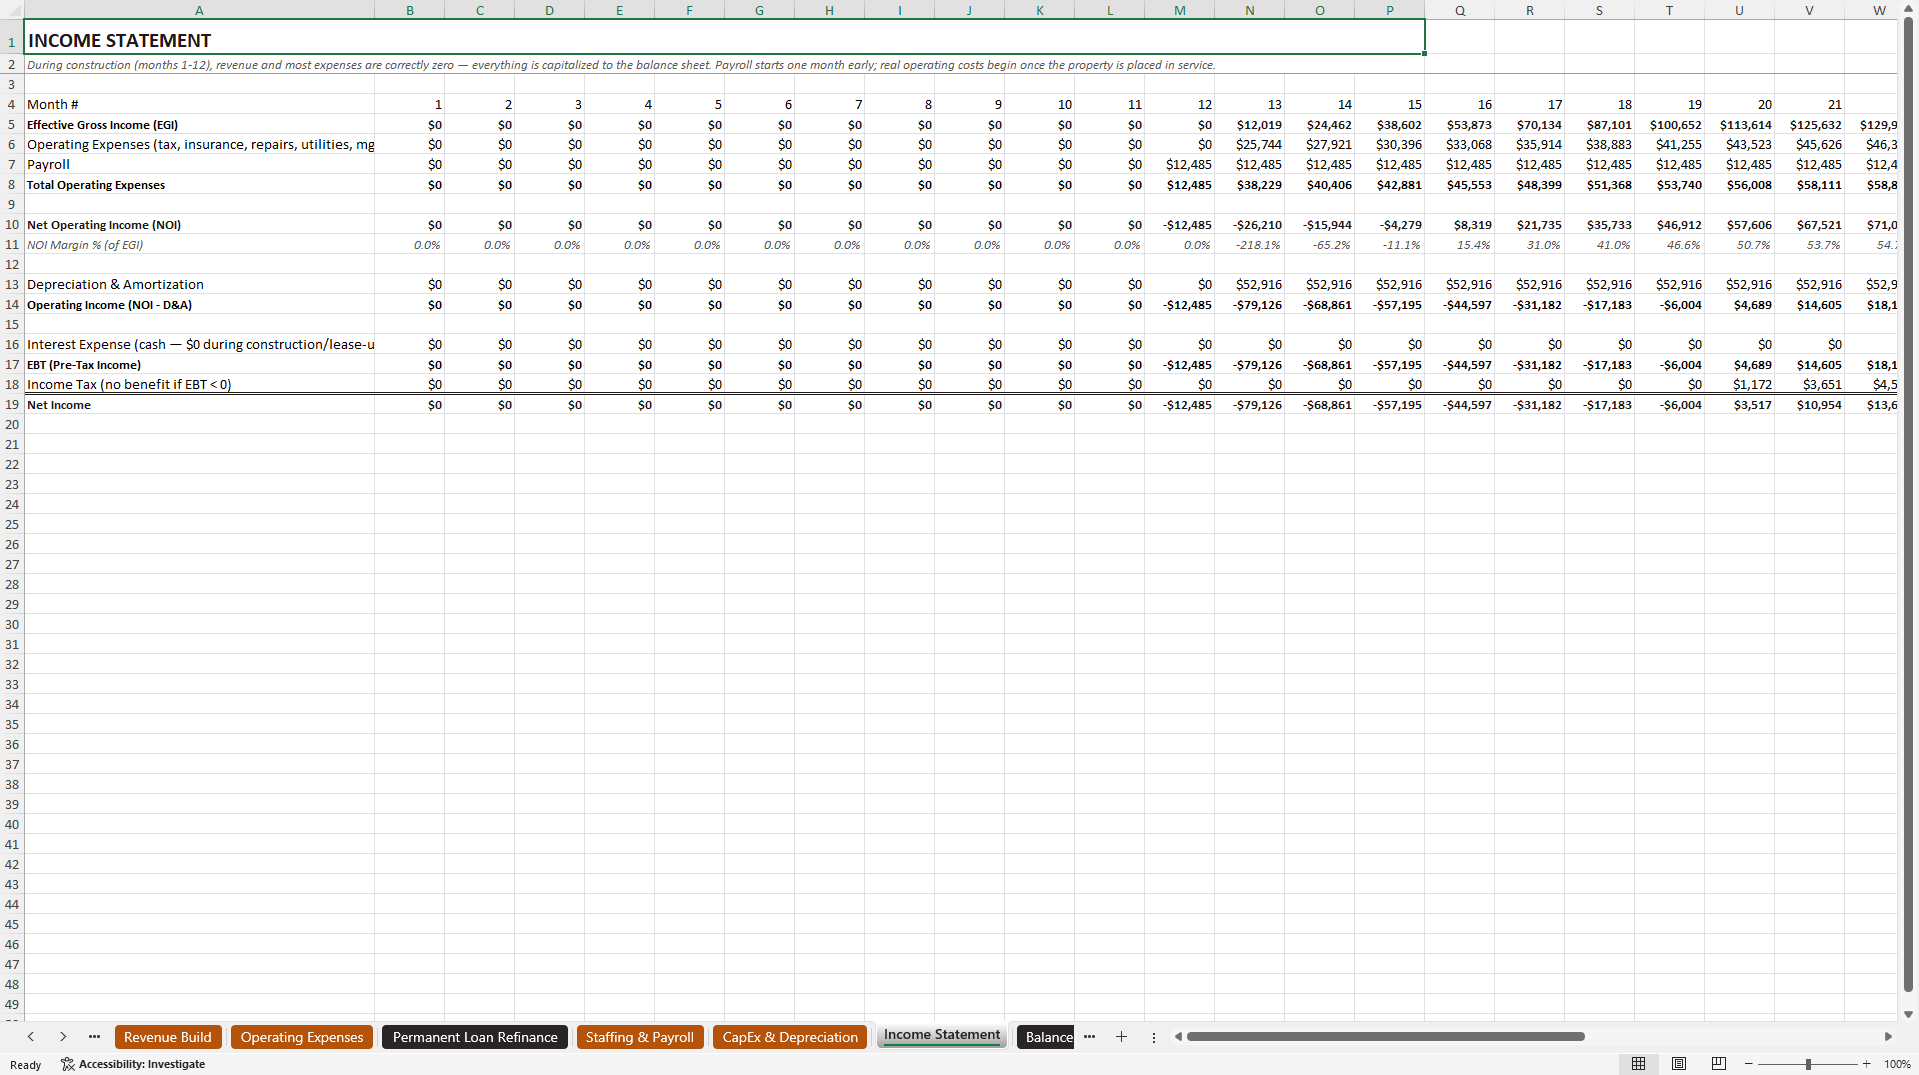
Twenty-seven tabs: Start Here, Disclaimer, Help & FAQ, Assumptions, Development Budget, Construction Loan & Draws, Rent Roll & Lease-Up, Revenue Build, Operating Expenses, Permanent Loan Refinance, Staffing & Payroll, CapEx & Depreciation, the three financial statements across all 36 months, an Actual vs. Budget Tracker, Break-Even Analysis, DSCR & Lender Ratios, a 22-ratio Full Ratio Suite, a DuPont ROE Decomposition, the Equity Waterfall, Scenario Analysis, Sensitivity Analysis (occupancy by rent, on both NOI and DSCR), a Business Valuation & Exit tab with a direct-cap exit value and a DCF cross-check, an Executive Dashboard, Funding Requirement, and Settings.
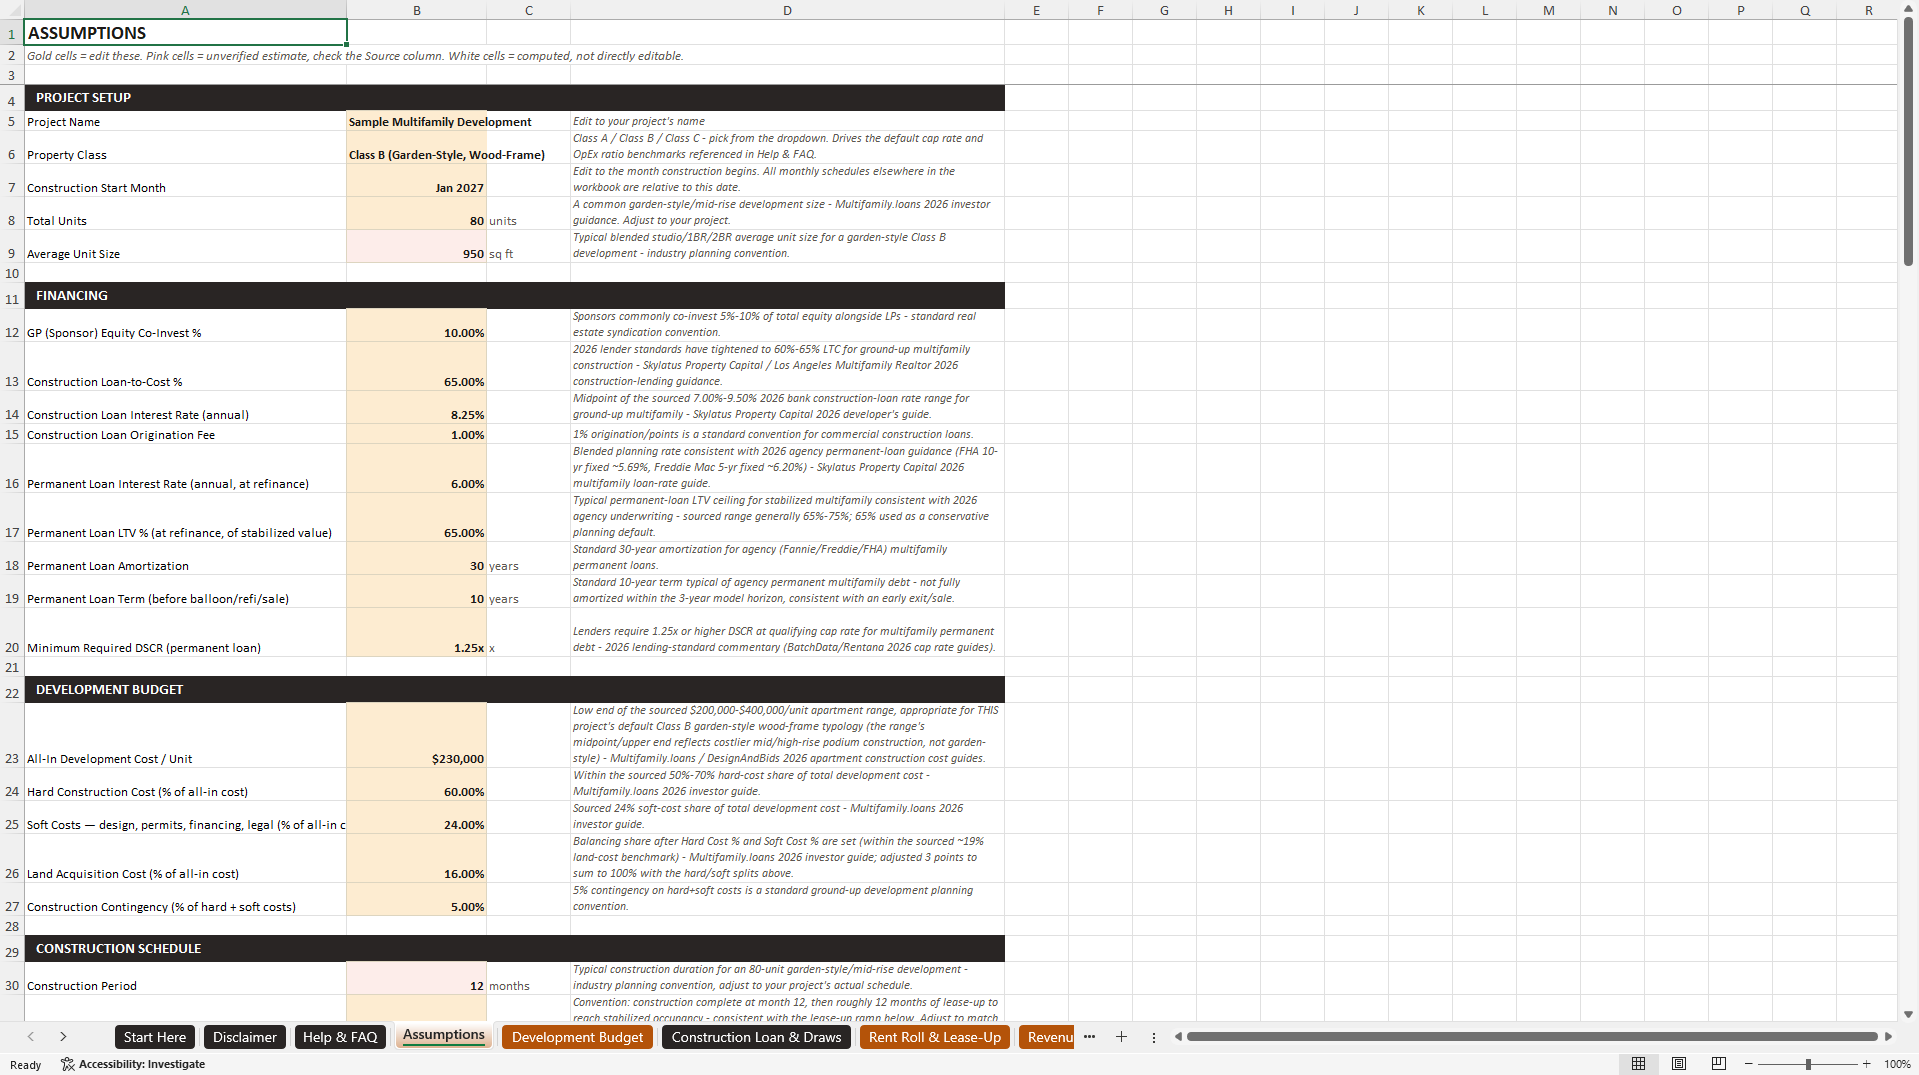
Every financing rate, cost benchmark, and staffing wage is sourced to 2026 data – construction and permanent loan rate ranges, loan-to-cost and loan-to-value standards, Class A/B/C cap rate and OpEx benchmarks, and BLS-sourced property management wages. Built as a native .xlsx, verified across Excel, Google Sheets, LibreOffice, and ONLYOFFICE. A planning tool, not financial, legal, or tax advice.
Got a question about the product? Email us at support@flevy.com or ask the author directly by using the "Ask the Author a Question" form. If you cannot view the preview above this document description, go here to view the large preview instead.
Source: Best Practices in Real Estate, Financial Modeling Excel: Real Estate Development Pro Forma Excel (XLSX) Spreadsheet, WebsiteGeek
ABOUT THE AUTHOR

WebsiteGeek offers free website tools, SEO suites, file converters, browser extensions, calculators, and image utilities built to supercharge your productivity.
We also builds practical digital tools and templates for small business owners -- real formulas and sourced data.
Ask the Author a Question
You must be logged in to contact the author.




























