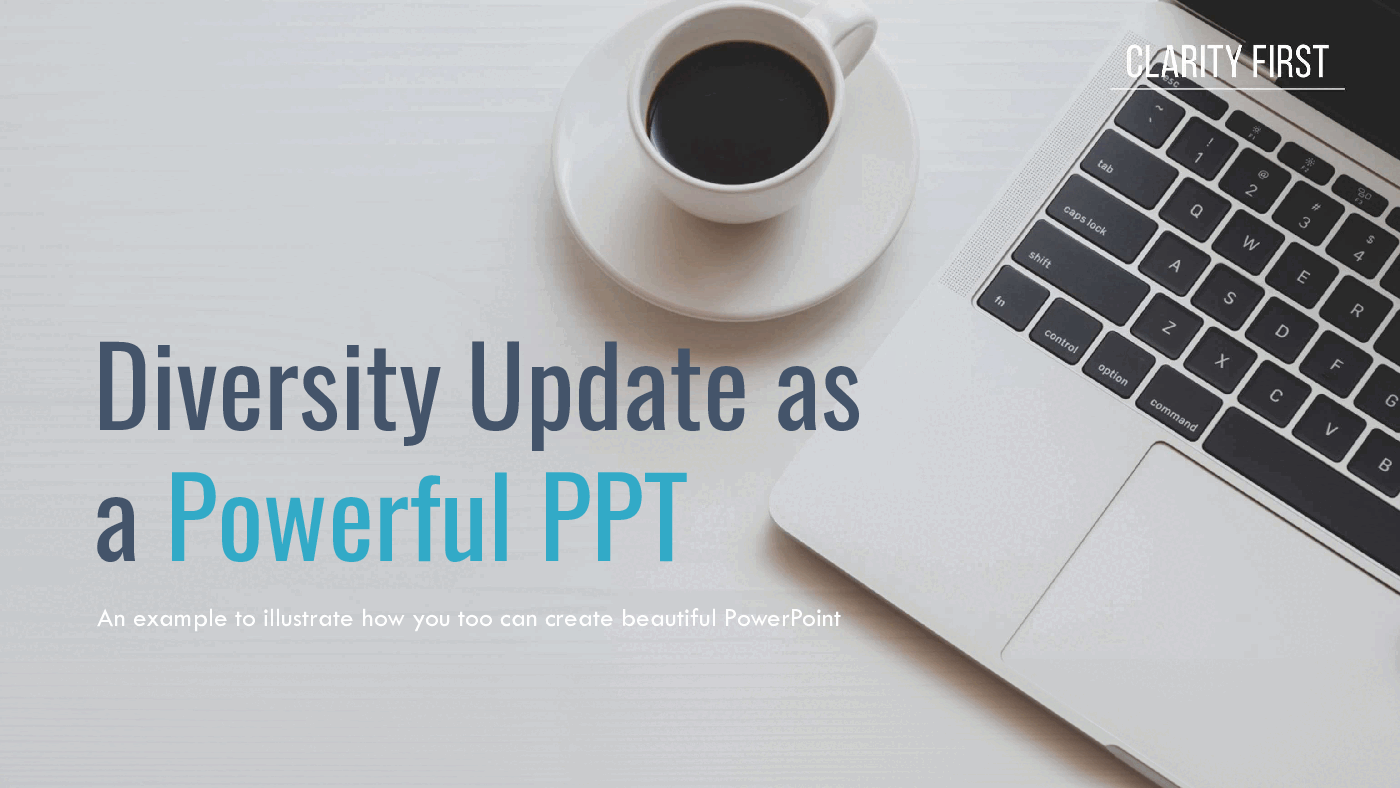
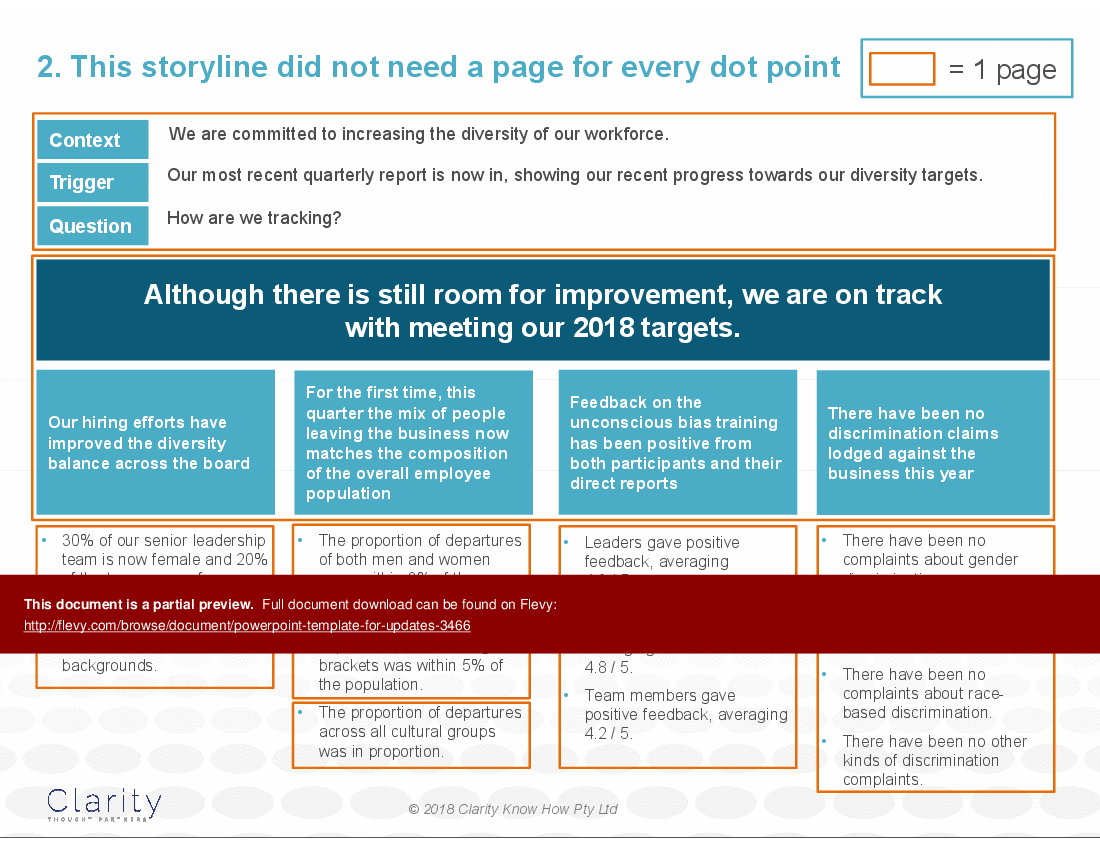
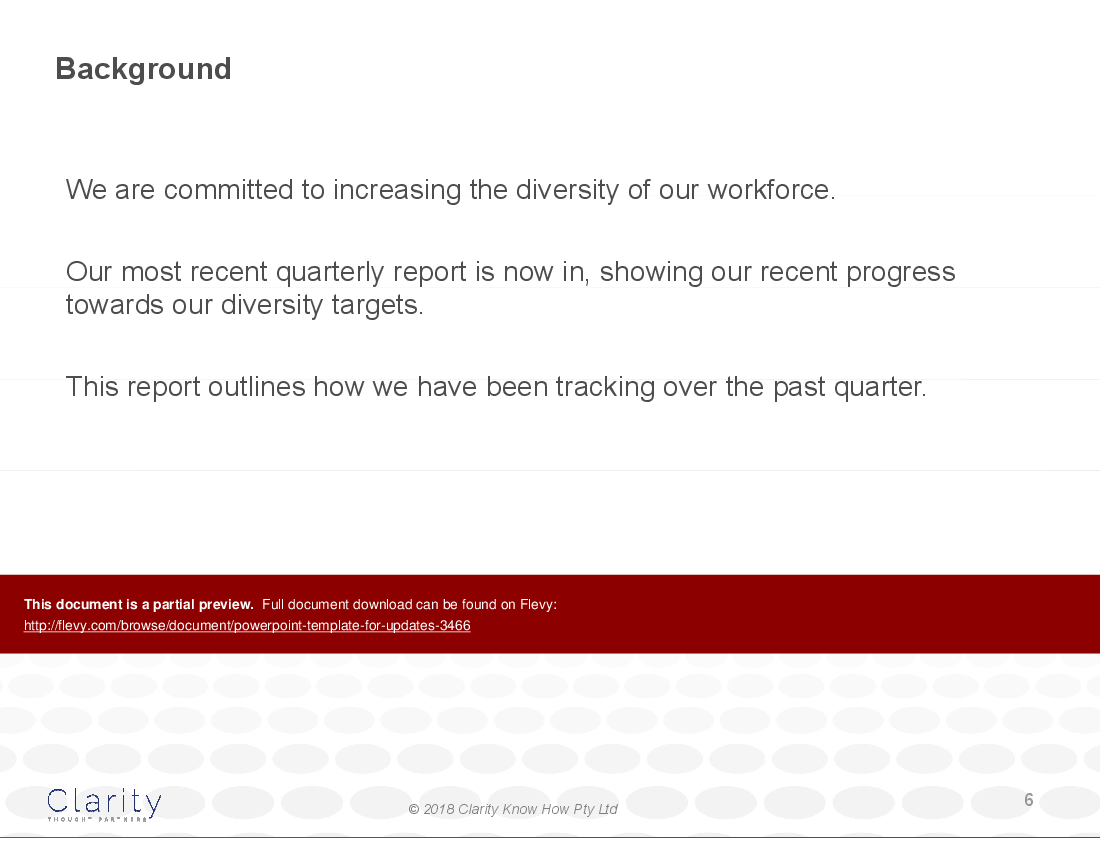
Everyone needs to update others on their progress at some point. When we do, no matter how complex the scenario, the main message can be boiled down to one of three words: the status of red, amber or green.
This pattern, illustrates how you can use the Pyramid Principle to explain your status when it is green or amber.
Here's what you need to know about what the deck offers, how to use it and who prepared it.
The deck offers three things to help you with your next green or amber update, where 'all is well':
• A one-page message map template as well as a case study using that template.
• A storyboard to show how the shape of the story drives the shape of the deck.
• A PowerPoint illustrating how to create an update that allows the messaging to be skimmed.
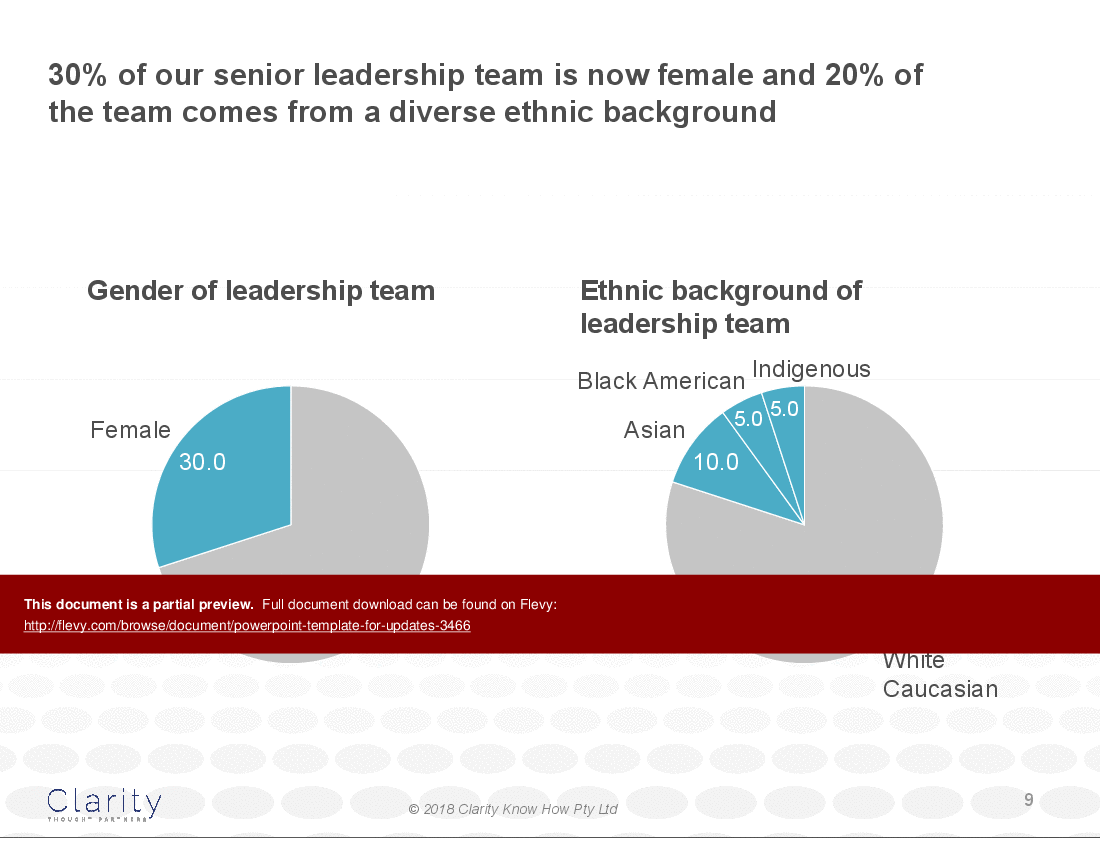
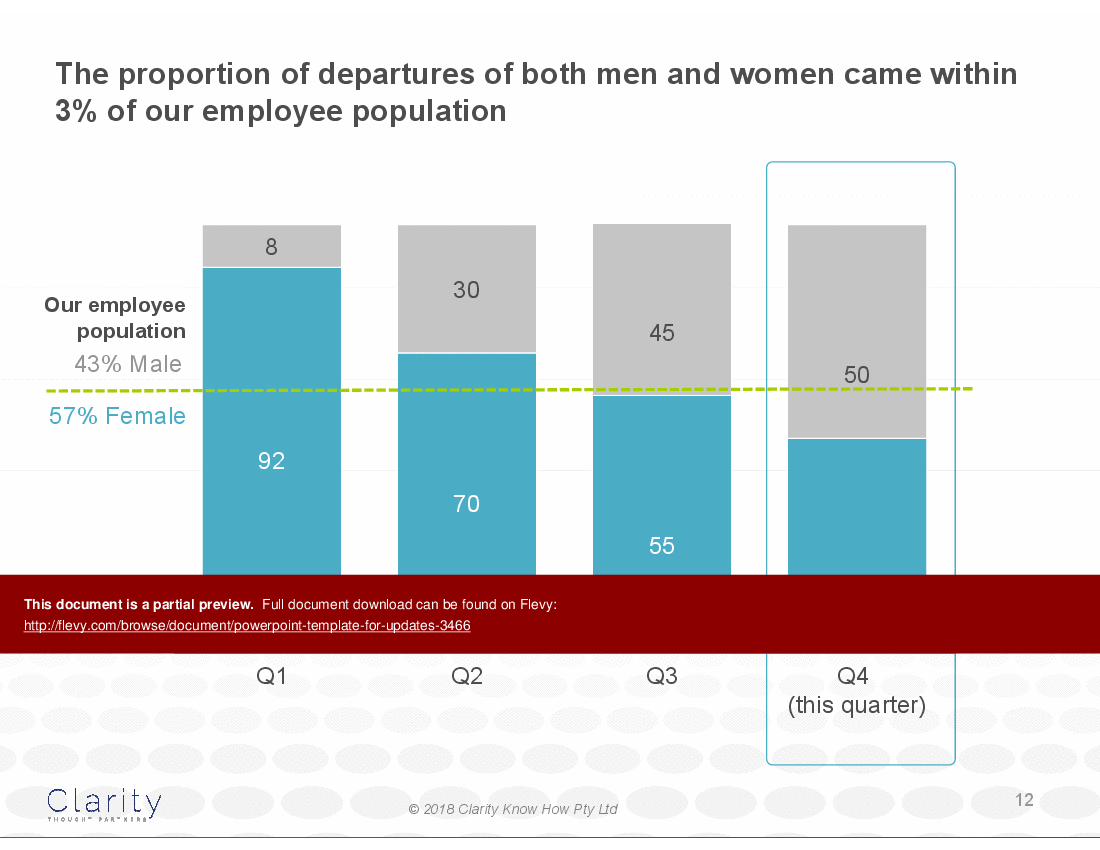
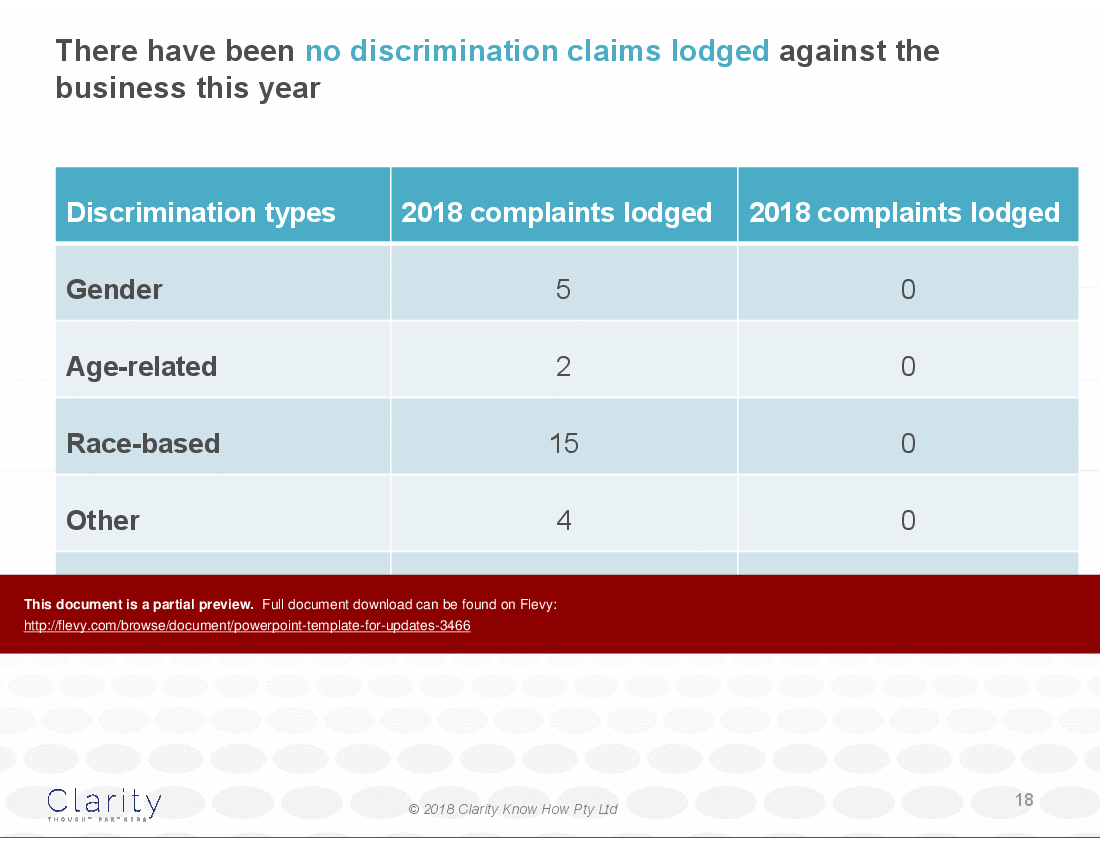
The case study updates senior leadership on the status of their diversity initiatives. It uses a data driven approach to present progress with confidence and transparency.
You can use this template three ways:
1 – Use the one-pager with instructions of what ideas to put where to clarify your thinking as you distil your message.
2 – Use the one-pager for the case study as reference to see how the instructions on the blank template play out.
3 – Cut and paste from the sample slides where the images could be adapted for your own deck.
With this template, you can efficiently communicate your achievements and areas for minor improvement. The structured layout helps you maintain focus and clarity, making it an invaluable tool for any professional tasked with delivering updates.
Whether you're reporting to stakeholders or team members, this template ensures your message is both impactful and professional.
This deck was prepared by Davina Stanley of Clarity First. Davina specialises in helping executives get to the point, using the Pyramid Principle. She learned the techniques at McKinsey. Barbara Minto reviewed and approved her training in 2009 and she has used them to help executives globally ever since.
Got a question about the product? Email us at support@flevy.com or ask the author directly by using the "Ask the Author a Question" form. If you cannot view the preview above this document description, go here to view the large preview instead.
Executive Summary
This PowerPoint template, titled "Diversity Update as a Powerful PPT," is designed to enhance your update presentations by effectively communicating diversity metrics. It employs a structured approach that integrates a one-page message map, a storyboard, and a visually engaging PowerPoint layout. This template allows users to present complex data in a clear and impactful manner, ensuring that the messaging remains strong and coherent throughout the presentation.
Who This Is For and When to Use
• Corporate executives focused on diversity and inclusion initiatives
• HR leaders responsible for workforce diversity reporting
• Team leaders conducting quarterly performance updates
• Consultants advising on diversity strategies and metrics
Best-fit moments to use this deck:
• Quarterly diversity updates to stakeholders
• Internal presentations on diversity initiatives and progress
• Workshops aimed at enhancing communication skills regarding diversity
Learning Objectives
• Define the key metrics for measuring diversity within an organization
• Build a compelling narrative around diversity data
• Establish a clear structure for presenting performance updates
• Create visually engaging slides that enhance audience understanding
• Develop a one-page message map to summarize key points
• Utilize storyboarding techniques to organize presentation flow
Table of Contents
• Introduction to Diversity Updates (page 1)
• One-Page Message Map (page 2)
• Storyboarding Techniques (page 5)
• PowerPoint Navigation Tips (page 8)
• Diversity Metrics Overview (page 10)
• Feedback and Improvement Areas (page 20)
• Appendix: Additional Resources (page 23)
Primary Topics Covered
• One-Page Message Map - A concise overview that summarizes key diversity metrics and their implications for the organization.
• Storyboarding Techniques - Methods for structuring presentations that allow the narrative to dictate the number of slides and their content.
• PowerPoint Navigation Tips - Strategies for creating a user-friendly navigation system within the presentation to enhance audience engagement.
• Diversity Metrics Overview - Detailed insights into the current status of diversity within the organization, including hiring and retention statistics.
• Feedback Mechanisms - Tools for gathering and analyzing feedback on diversity initiatives and training programs.
• Visual Communication Strategies - Techniques for effectively visualizing data to support the narrative and engage the audience.
Deliverables, Templates, and Tools
• One-page message map template for summarizing diversity metrics
• Storyboard template for planning presentation flow
• PowerPoint slide templates with navigation features
• Feedback survey templates for assessing training effectiveness
• Visual data representation templates for diversity metrics
• Guidelines for creating impactful presentations
Slide Highlights
• Title slide emphasizing the importance of diversity updates
• One-page message map summarizing key diversity metrics
• Storyboard layout illustrating the flow of the presentation
• Visual data representations showing diversity statistics
• Feedback summary slide highlighting participant responses
Potential Workshop Agenda
Diversity Update Presentation Workshop (90 minutes)
• Introduction to the importance of diversity updates
• Hands-on session to create a one-page message map
• Group activity to develop a storyboard for a diversity presentation
Feedback and Improvement Strategies (60 minutes)
• Discussion on gathering and analyzing feedback
• Interactive session on visualizing diversity metrics effectively
Customization Guidance
• Adjust the one-page message map to reflect your organization’s specific diversity goals and metrics
• Tailor the storyboard to align with your presentation style and audience needs
• Incorporate your organization's branding elements into the PowerPoint template
• Modify feedback survey questions to suit your training programs
Secondary Topics Covered
• Importance of diversity in organizational culture
• Strategies for improving workforce diversity
• Legal considerations surrounding diversity and inclusion
• Best practices for communicating diversity initiatives
Topic FAQ
Document FAQ
These are questions addressed within this presentation.
What is the purpose of the one-page message map?
The one-page message map serves as a concise summary of key diversity metrics, allowing presenters to communicate essential information quickly and effectively.
How can I customize the PowerPoint template?
You can customize the template by incorporating your organization's branding, adjusting the content to reflect your specific diversity goals, and modifying the visual elements to suit your style.
What are the benefits of using storyboarding techniques?
Storyboarding techniques help to organize the presentation flow, ensuring that each point is clearly articulated and that the narrative guides the audience through the data.
How do I gather feedback on diversity initiatives?
Utilize feedback surveys designed to assess participants' experiences with diversity training and initiatives, focusing on areas for improvement and success.
Can this template be used for other types of updates?
Yes, while designed for diversity updates, the principles and structure can be adapted for various performance updates across different organizational metrics.
What types of visual data representations are included?
The template includes various visual data representations such as charts and graphs that effectively convey diversity statistics and trends.
How do I ensure my presentation is engaging?
Incorporate visual elements, use clear and concise messaging, and maintain a logical flow throughout the presentation to keep the audience engaged.
What resources are available in the appendix?
The appendix includes additional tips, tools, and resources to enhance your presentation skills and improve communication quality.
Glossary
• Diversity Metrics - Quantitative measures used to assess the diversity of a workforce.
• Message Map - A visual tool that summarizes key points for effective communication.
• Storyboard - A planning tool that outlines the flow and structure of a presentation.
• Feedback Survey - A tool used to gather participant responses on training effectiveness.
• Visual Data Representation - Graphical formats used to present data clearly and engagingly.
• Engagement Techniques - Strategies used to maintain audience interest during presentations.
• Training Effectiveness - The measure of how well a training program achieves its intended outcomes.
• Workforce Diversity - The inclusion of individuals from various backgrounds within an organization.
• Presentation Flow - The logical sequence in which information is presented to an audience.
• Organizational Culture - The shared values, beliefs, and practices within an organization.
• Branding Elements - Visual components that represent an organization's identity.
• Performance Update - A report detailing the progress and outcomes of specific initiatives.
• Audience Engagement - The level of interaction and interest shown by an audience during a presentation.
• Legal Considerations - Regulations and laws that impact diversity and inclusion practices.
• Training Programs - Structured learning experiences designed to improve skills and knowledge.
• Quantitative Measures - Numerical data used to assess performance or outcomes.
• Visual Communication - The use of visual elements to convey information effectively.
• Cultural Background - The social and ethnic heritage of individuals within a workforce.
• Retention Statistics - Data reflecting the rate at which employees remain with an organization.
• Hiring Statistics - Data that indicates the demographics of new hires within an organization.
• Diversity Initiatives - Programs and strategies aimed at promoting diversity within a workforce.
• Organizational Goals - Objectives set by an organization to guide its operations and initiatives.
Source: Best Practices in Specialized PowerPoint Templates, Pyramid Principle, Progress Report PowerPoint Slides: PPT Template for Updates + Case Study PowerPoint (PPTX) Presentation Slide Deck, Clarity First
This document is available as part of the following discounted bundle(s):
Save %!
PPT Toolkit - How to Tell a Compelling Story
This bundle contains 7 total documents. See all the documents to the right.
|
Download our FREE Strategy & Transformation Framework Templates
Download our free compilation of 50+ Strategy & Transformation slides and templates. Frameworks include McKinsey 7-S, Balanced Scorecard, Disruptive Innovation, BCG Curve, and many more. |