

Pharmaceutical Manufacturer 10-Year Financial Model – Excel XLSX
Excel (XLSX)
BENEFITS OF THIS DOWNLOADABLE EXCEL DOCUMENT
- Provides a framework for modeling a pharmaceutical manufacturing company's full 10-year financial trajectory from clinical pipeline to commercial scale.
- Delivers an institutional-grade 3-statement financial model purpose-built for evaluating drug portfolios, manufacturing economics, and R&D investment returns.
- Enables precise forecasting of revenue growth, gross margin expansion, and pipeline progression across every stage of a pharmaceutical company's lifecycle.
HEALTHCARE EXCEL DESCRIPTION
Curated by McKinsey-trained Executives
⚕️ PHARMACEUTICAL MANUFACTURER FINANCIAL MODEL | Institutional-Grade 10-Year Integrated 3-Statement Forecast
Build the exact financial infrastructure that top-tier investment banks, private equity funds, venture capital firms, pharmaceutical investors, and corporate finance teams use to evaluate, pitch, and scale pharmaceutical manufacturing companies – modeled with the precision, depth, and professional structure that institutional investors and sophisticated stakeholders demand on day one.
Whether you're a fund manager evaluating a pharma acquisition, a biotech founder preparing your first institutional raise, a PE sponsor conducting commercial due diligence on a drug manufacturer, a CFO stress-testing your pipeline and capital deployment, a venture capitalist modeling a clinical-stage company's path to profitability, or an investment banker building a fairness opinion for a pharma transaction – this fully integrated 10-Year 3-Statement Financial Model gives you the exact financial engine to plan, pitch, manufacture, monitor, and exit with complete institutional credibility.
💡 What's Inside
This model covers every financial dimension of running and scaling a Pharmaceutical Manufacturing Company – from early-stage drug development and clinical trials through a decade of commercial launches, manufacturing scale-up, pipeline progression, and patent lifecycle management. Built on Financial Modeling World Cup best practices, it's fully dynamic, cross-linked across all tabs, and ready to customize for your specific drug portfolio, manufacturing strategy, and pipeline composition.
📥 Inputs
• 🏛️ Fund Architecture & Revenue Engine – Initial revenue base, long-term AUM target, annual drug adoption schedules, product launch timelines, patent exclusivity periods, and pricing assumptions – all individually configurable from a single Assumptions tab – plus a full drug revenue bridge rolling unit volumes forward through market penetration, price erosion, and generic competition to net revenue for every year of the forecast – the exact commercial architecture any institutional LP, pharmaceutical investor, or M&A advisor interrogates on page one of their due diligence checklist
• 📊 Multi-Drug Portfolio Revenue Model – A live, product-level revenue model spanning Branded Specialty Drugs, Oncology, Immunology, Cardiovascular, Generic Pharmaceuticals, Biologics, OTC Products, and Contract Manufacturing – each drug modeled with individual launch year, unit volumes, average selling price, market penetration ramp, price erosion curve, patent expiry, and generic competition impact – unrealized pipeline value, royalty income, milestone payments, and licensing revenue all calculated automatically at the portfolio level – the exact drug revenue schedule any operational due diligence team, pharmaceutical investor, or licensing partner needs to evaluate your commercial book
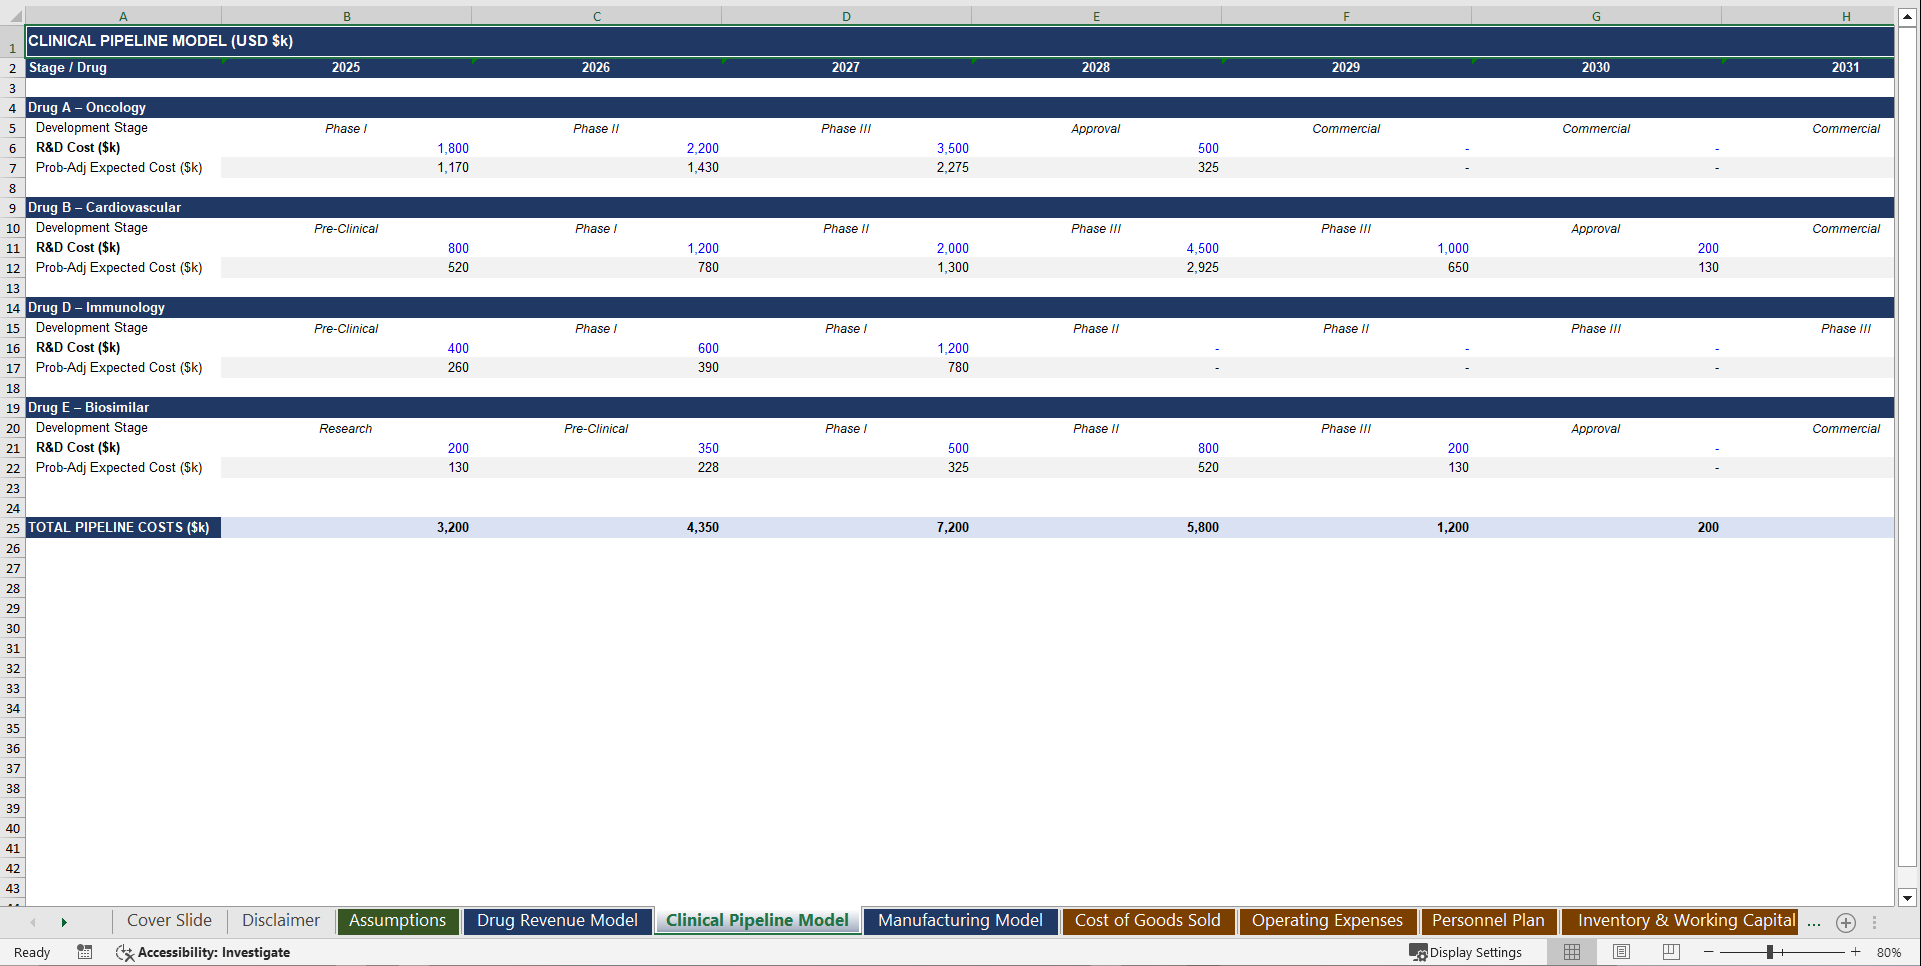
• 🎯 Clinical Development Pipeline with Probability-Weighted Costs – Phase I, Phase II, Phase III, and regulatory review modeled with individual cost schedules, success probabilities, development timelines, and expected launch years – cumulative pipeline investment, probability-weighted NPV of future launches, and a full Gantt-style development timeline – the exact pipeline intelligence every venture investor, licensing partner, and M&A advisor demands to verify disciplined R&D capital allocation
• 💸 Multi-Stream Revenue Model – Prescription Drug Sales by product, Generic Portfolio Revenue, CDMO and Contract Manufacturing, Royalties and Licensing, Milestone Payments, Over-the-Counter Sales, and International Distribution Revenue – every revenue stream individually modeled and fully flowing into the Income Statement – the complete revenue architecture any institutional investor, credit committee, or licensing partner needs to validate your commercial model and return profile
• 🏗️ Manufacturing Cost Model with Batch Production Planning – Per-drug cost of goods sold calculated from batch size, production yield, active pharmaceutical ingredient costs, formulation and filling costs, quality control expenses, and supply chain logistics – COGS improving with manufacturing efficiency gains over time – Days Inventory Outstanding, Days Sales Outstanding, and Days Payable Outstanding driving working capital balances – the exact manufacturing economics any operational due diligence team, pharmaceutical investor, or contract manufacturer interrogates during their factory assessment
• 👥 Multi-Role Personnel Plan with Full Compensation Architecture – Partners, Managing Directors, Chief Medical Officers, Research Scientists, Clinical Researchers, Lab Technicians, Regulatory Specialists, Manufacturing Technicians, QA Specialists, Pharmaceutical Sales Representatives, and Operations Staff – each role with individual headcount inputs ramping annually, base salary, target bonus, benefits load, and annual merit increases compounding throughout the forecast – total compensation, headcount trajectory, average comp per head, and revenue per headcount tracked across all years – the exact people economics every talent-intensive pharmaceutical company needs to underwrite its cost base with precision
• 🏢 Operating Expense Engine with Granular Line Items – Research & Development, Sales & Marketing, General & Administrative, Clinical Trial Costs, Regulatory Submission Expenses, Pharmacovigilance, and Quality Assurance – each scaling as a configurable percentage of revenue with phase-based step-downs as the company matures – plus D&A and CapEx modeled separately – Total Cash OpEx and Total OpEx including D&A tracked with full cost ratio analysis – every overhead dollar visible, defensible, and auditable
• 🏦 Debt Capital Structure with Full Roll-Forward – Term loan modeled with opening balance, scheduled amortization, and interest expense – interest calculated on beginning balance – ending debt balance, average balance, interest expense, and Interest Coverage Ratio tracked annually – plus net debt and leverage ratio – the exact liability management structure any fund-level lender, pharmaceutical debt provider, or royalty financing partner needs to evaluate your balance sheet risk
• 📦 Working Capital Architecture with Pharmaceutical-Specific Drivers – Accounts Receivable sized against configurable DSO days reflecting wholesaler payment terms, Inventory sized against DIO days reflecting finished goods and raw material safety stock, Accounts Payable sized against DPO days, Prepaid Expenses, Deferred Revenue, and Accrued Liabilities – Net Working Capital movement flowing directly into the Cash Flow Statement – every balance sheet line traceable to its operational driver
📤 Outputs
• 📈 10-Year Fully Integrated 3-Statement Financial Model – Income Statement, Balance Sheet, and Cash Flow Statement fully cross-linked and auto-balancing across all years – revenue growing steadily on realistic assumptions, gross margins expanding as manufacturing efficiency improves, EBITDA margin healthy and widening, and Free Cash Flow building through the forecast – every number traceable to its operational and clinical driver – the financial backbone any pharmaceutical company needs to present to an LP advisory board, debt provider, licensing partner, or institutional auditor with complete confidence
• 🎯 Multi-Drug Portfolio Dashboard with Asset Class Diversification – Individual revenue and margin forecasts for all drug products across multiple therapeutic areas – Total Net Revenue rolling forward annually – unrealized pipeline value, royalty income, milestone payments, and patent expiry impact calculated every year – therapeutic area breakdown for Oncology, Immunology, Cardiovascular, Generic, Biologic, and OTC – the exact drug portfolio transparency any LP quarterly report, licensing partner, or M&A buyer needs to evaluate your commercial book with confidence
• 🔁 Revenue Bridge with Full Roll-Forward Mechanics – Beginning drug revenues, new product launches, volume growth, price erosion, patent cliff impact, and Ending Net Revenue – revenue growth in absolute and percentage terms year-over-year – branded versus generic revenue mix and management fee revenue auto-calculated – the exact commercial intelligence any placement agent, pharmaceutical investor, or strategic acquirer needs to understand your revenue trajectory
• 💼 Multi-Stream Revenue Waterfall – From prescription drug sales and contract manufacturing through royalties, milestones, licensing, and OTC revenue – Total Product Revenue and Total Other Income tracked as separate blocks – year-over-year revenue growth rate, branded concentration percentage, and management fee as a percentage of revenue calculated annually – the full revenue architecture any institutional investor, credit committee, or licensing partner interrogates on page one of commercial due diligence
• 🏆 Fund Returns Intelligence – MOIC (Gross), Revenue CAGR, Gross Margin Expansion, and EBITDA Margin trajectory calculated for every year of the forecast – cumulative R&D investment versus cumulative product revenue versus residual pipeline value – a complete return performance picture any pharmaceutical investor, LP advisory board, or M&A buyer needs to evaluate company performance with institutional rigor
• 📐 Full Clinical Pipeline Waterfall – Phase I, Phase II, Phase III, and regulatory review cost schedules with probability-weighted success rates – expected launch years, development timelines, and cumulative pipeline investment crystallized year by year – the exact economics any fund manager needs to model their pipeline NPV, any LP needs to validate their R&D capital allocation, and any pharmaceutical auditor needs to confirm pipeline accounting compliance
• 🧮 Income Statement with Full Margin Analysis – From drug revenues through COGS, R&D, Sales & Marketing, G&A, D&A, interest expense, and tax – EBITDA, EBIT, Pre-Tax Income, and Net Income with full margin percentages – Gross Margin, EBITDA Margin, EBIT Margin, Net Margin, and Effective Tax Rate calculated annually – the complete P&L transparency any PE sponsor, credit committee, or LP advisory board demands from a pharmaceutical manufacturing company
• 📊 Balance Sheet with Full Line-Item Detail and Auto-Balancing Check – Cash tied to the Cash Flow Statement, Accounts Receivable, Inventory, Prepaid Expenses, PP&E Net Book Value, Intangible Assets and Capitalized R&D, Accounts Payable, Accrued Expenses, Deferred Revenue, Long-Term Debt, Paid-In Capital, and Retained Earnings – Assets = Liabilities + Equity confirmed for every year with a highlighted balance check row – the audit-ready balance sheet any fund administrator, institutional auditor, or debt provider needs to see
• 🔄 Cash Flow Statement – Full Indirect Method – Net Income, D&A add-back, multiple working capital adjustment lines, capital expenditures, debt repayment, and equity issuance – Operating Cash Flow, Investing Cash Flow, Financing Cash Flow, Net Change in Cash, and Ending Cash Balance tied directly to the Balance Sheet – Free Cash Flow tracked annually – the complete cash mechanics any fund-level lender, royalty finance provider, or institutional LP needs to validate your liquidity management
• 🎨 Executive Dashboard with Live Charts and KPI Summary – Revenue Growth bar chart, Drug Revenue Mix stacked bar chart, Gross and EBITDA Margin trend lines, EBITDA versus Net Income bar chart, and R&D Investment line chart – plus live KPI tiles covering Total Revenue, Gross Margin, EBITDA, EBITDA Margin, Net Income, and Net Margin for the final forecast year – all auto-updating the instant any assumption changes
• 📊 Multi-Table Sensitivity & Scenario Engine – Drug adoption rate sensitivity matrix across volume growth versus price change with color-coded green/amber/red heat map – plus a full scenario comparison table across Conservative, Base Case, and High Growth covering multiple KPIs including Revenue, Gross Margin, EBITDA Margin, Net Income, R&D Spend, Drug Revenue by product, Free Cash Flow, and Headcount – instant scenario data points giving you complete risk visibility without touching a single formula
🏆 Why This Model Stands Out
✅ Fully integrated across all tabs – change one assumption and formulas update instantly across every sheet – drug unit volumes flow to revenue, which flows to gross profit, which flows to EBITDA, which flows to retained earnings, which balances the equity stack
✅ LP and institutional investor-ready – structured and formatted to answer the exact questions pharmaceutical investors, venture capital firms, PE sponsors, and institutional LPs ask on day one: What is the stabilized gross margin at peak sales? What does the revenue trajectory look like over the forecast horizon? When does EBITDA turn positive? What is the management team's R&D return on investment? What does the pipeline look like under a stress scenario?
✅ Pharmaceutical industry-realistic – built around how drug companies actually generate and protect economics: management fees scaling with revenue maturity, gross margins improving as manufacturing scales, working capital building as receivables grow with commercial expansion, monitoring fees compounding as pipeline breadth expands, personnel costs scaling with clinical and commercial complexity – not generic manufacturing assumptions with a pharma label applied
✅ Institutional color-coding throughout – blue inputs, black formulas, green cross-sheet links – Financial Modeling World Cup color conventions used throughout so any pharmaceutical investor, fund auditor, debt provider, licensing partner, or M&A advisor can open it and immediately understand the logic, trace every number to its source, and audit every formula without a guide
✅ Fully unlocked – no protected sheets, no black-box formulas, no hidden logic – every assumption visible, every formula auditable – present it to any institutional LP, fund administrator, credit committee, licensing partner, or strategic acquirer with complete confidence
📋 Model Structure
• Executive Dashboard – Live charts plus KPI tiles covering all key revenue, margin, pipeline, and headcount metrics – auto-updating from a single Assumptions tab
• Assumptions – A comprehensive set of individually configurable drivers covering drug pricing, adoption rates, patent timelines, manufacturing costs, clinical trial budgets, personnel salaries, G&A costs, debt terms, tax rate, and scenario toggles – all color-coded for instant editing – the single source of truth for the entire model
• Drug Revenue Model – Unit volume and pricing drivers for every drug product, launch year mechanics, market penetration ramps, price erosion curves, patent expiry impact, and generic competition – the commercial engine feeding revenue, COGS, and working capital
• Clinical Pipeline – Phase I through regulatory approval with cost schedules, success probabilities, development timelines, and a Gantt-style launch timeline across all forecast years
• Manufacturing Model – Batch production planning, cost per unit, quality control costs, supply chain logistics, and pharmacovigilance expenses – the manufacturing cost engine feeding COGS and working capital
• COGS – Drug-level cost of goods sold with improving margin curves over time, generic and CDMO cost structures, and gross profit and gross margin percentage for every year
• Operating Expenses – R&D, Sales & Marketing, and G&A as configurable percentages of revenue with phase-based step-downs as the company scales
• Personnel Plan – Multiple roles across Executive, Scientific R&D, Manufacturing, Sales, and Corporate with individual headcount ramp, salary, bonus, benefits, and annual merit increases
• Inventory & Working Capital – DSO, DIO, and DPO drivers sizing Accounts Receivable, Inventory, and Accounts Payable – with net working capital changes flowing directly into the Cash Flow Statement
• CapEx Schedule – Manufacturing plants, lab equipment, bioreactors, packaging machinery, IT systems, and R&D laboratory infrastructure across all forecast years
• Depreciation Schedule – Straight-line depreciation by asset class with configurable useful lives – total D&A and PP&E net book value rolling forward annually
• Debt Schedule – Term loan roll-forward with beginning balance, repayments, ending balance, and interest expense tracked annually
• Income Statement – Comprehensive P&L from total revenue through gross profit, R&D, Sales & Marketing, G&A, EBITDA, D&A, EBIT, interest, tax, and net income – with full margin suite
• Balance Sheet – Full asset, liability, and equity stack with auto-balancing check – Cash tied to Cash Flow Statement, Inventory and Receivables tied to Working Capital model, Debt tied to Debt Schedule, Retained Earnings tied to cumulative Net Income
• Cash Flow Statement – Full indirect method with operating, investing, and financing sections – ending cash balance tied directly to the Balance Sheet
• Sensitivity Analysis – Drug adoption and pricing heat map, scenario comparison across Conservative, Base, and High Growth – instant scenario data points color-coded for at-a-glance risk intelligence
Key Words:
Strategy & Transformation, Growth Strategy, Strategic Planning, Strategy Frameworks, Innovation Management, Pricing Strategy, Core Competencies, Strategy Development, Business Transformation, Marketing Plan Development, Product Strategy, Breakout Strategy, Competitive Advantage, Mission, Vision, Values, Strategy Deployment & Execution, Innovation, Vision Statement, Core Competencies Analysis, Corporate Strategy, Product Launch Strategy, BMI, Blue Ocean Strategy, Breakthrough Strategy, Business Model Innovation, Business Strategy Example, Corporate Transformation, Critical Success Factors, Customer Segmentation, Customer Value Proposition, Distinctive Capabilities, Enterprise Performance Management, KPI, Key Performance Indicators, Market Analysis, Market Entry Example, Market Entry Plan, Market Intelligence, Market Research, Market Segmentation, Market Sizing, Marketing, Michael Porter's Value Chain, Organizational Transformation, Performance Management, Performance Measurement, Platform Strategy, Product Go-to-Market Strategy, Reorganization, Restructuring, SWOT, SWOT Analysis, Service 4.0, Service Strategy, Service Transformation, Strategic Analysis, Strategic Plan Example, Strategy Deployment, Strategy Execution, Strategy Frameworks Compilation, Strategy Methodologies, Strategy Report Example, Value Chain, Value Chain Analysis, Value Innovation, Value Proposition, Vision Statement, Corporate Strategy, Business Development, Business plan pdf, business plan, PDF, Business Plan DOC, Business Plan Template, PPT, Market strategy playbook, strategic market planning, competitive analysis tools, market segmentation frameworks, growth strategy templates, product positioning strategy, market execution toolkit, strategic alignment playbook, KPI and OKR frameworks, business growth strategy guide, cross-functional strategy templates, market risk management, market strategy PowerPoint doc, guide, ebook, e-book ,McKinsey Change Playbook, Organizational change management toolkit, Change management frameworks 2025, Influence model for change, Change leadership strategies, Behavioral change in organizations, Change management PowerPoint templates, Transformational leadership in change, supply chain KPIs, supply chain KPI toolkit, supply chain PowerPoint template, logistics KPIs, procurement KPIs, inventory management KPIs, supply chain performance metrics, manufacturing KPIs, supply chain dashboard, supply chain strategy KPIs, reverse logistics KPIs, sustainability KPIs in supply chain, financial supply chain KPIs, warehouse KPIs, digital supply chain KPIs, 1200 KPIs, supply chain scorecard, KPI examples, supply chain templates, Corporate Finance SOPs, Finance SOP Excel Template, CFO Toolkit, Finance Department Procedures, Financial Planning SOPs, Treasury SOPs, Accounts Payable SOPs, Accounts Receivable SOPs, General Ledger SOPs, Accounting Policies Template, Internal Controls SOPs, Finance Process Standardization, Finance Operating Procedures, Finance Department Excel Template, FP&A Process Documentation, Corporate Finance Template, Finance SOP Toolkit, CFO Process Templates, Accounting SOP Package, Tax Compliance SOPs, Financial Risk Management Procedures.
NOTE: Our digital products are sold on an "as is" basis, making returns and refunds unavailable post-download. Please preview and inquire before purchasing. Please contact us before purchasing if you have any questions! This policy aligns with the standard Flevy Terms of Usage.
Got a question about the product? Email us at support@flevy.com or ask the author directly by using the "Ask the Author a Question" form. If you cannot view the preview above this document description, go here to view the large preview instead.
Source: Best Practices in Healthcare, Pharma, Integrated Financial Model Excel: Pharmaceutical Manufacturer 10-Year Financial Model Excel (XLSX) Spreadsheet, SB Consulting
ABOUT THE AUTHOR
SB Consulting is dedicated to empowering businesses to communicate their ideas with impact. This consulting firm specializes in teaching organizations how to create effective corporate and management presentations. With training from top-tier global consulting firms, including McKinsey, BCG, and Porsche Consulting, extensive expertise in presentation design and ... [read more]
Ask the Author a Question
You must be logged in to contact the author.
