
BENEFITS OF THIS DOWNLOADABLE EXCEL DOCUMENT
- Records distinct operational problem categories, occurrence frequencies, and qualitative notes inside a standardized data entry workspace.
- Calculates mathematical rankings, percentage shares, cumulative frequencies, and percentage thresholds automatically using native formula rows.
- Isolates critical process failure modes from secondary defects by utilizing automated 80/20 rule classification logic.
PARETO PRINCIPLE EXCEL DESCRIPTION
Isolating the critical few operational failure modes from the trivial many and establishing data-driven prioritization loops is vital for efficient resource allocation. Across complex logistics hubs, customer service centers, and manufacturing plants, quality teams frequently face a high volume of miscellaneous operational problems daily. Without a standardized, mathematical framework to rank issues by frequency or impact, continuous improvement teams run the risk of spreading their efforts too thin, wasting capital on minor defects while leaving the core drivers of process inefficiency completely unaddressed.
The Pareto Analysis and 80 20 Rule Dashboard is an enterprise-grade quality management matrix and operational excellence framework engineered specifically for Lean Six Sigma Green and Black Belts, Quality Assurance Managers, Production Supervisors, and Operations Consultants. Rooted directly in the classical 80/20 rule, this interactive tool creates an automated environment to log operational disruptions, calculate frequency concentrations, and separate vital systemic issues from secondary operational noise. By linking raw defect counts directly with real-time analytical breakdowns, this workbook delivers immediate boardroom transparency to remediation cycles.
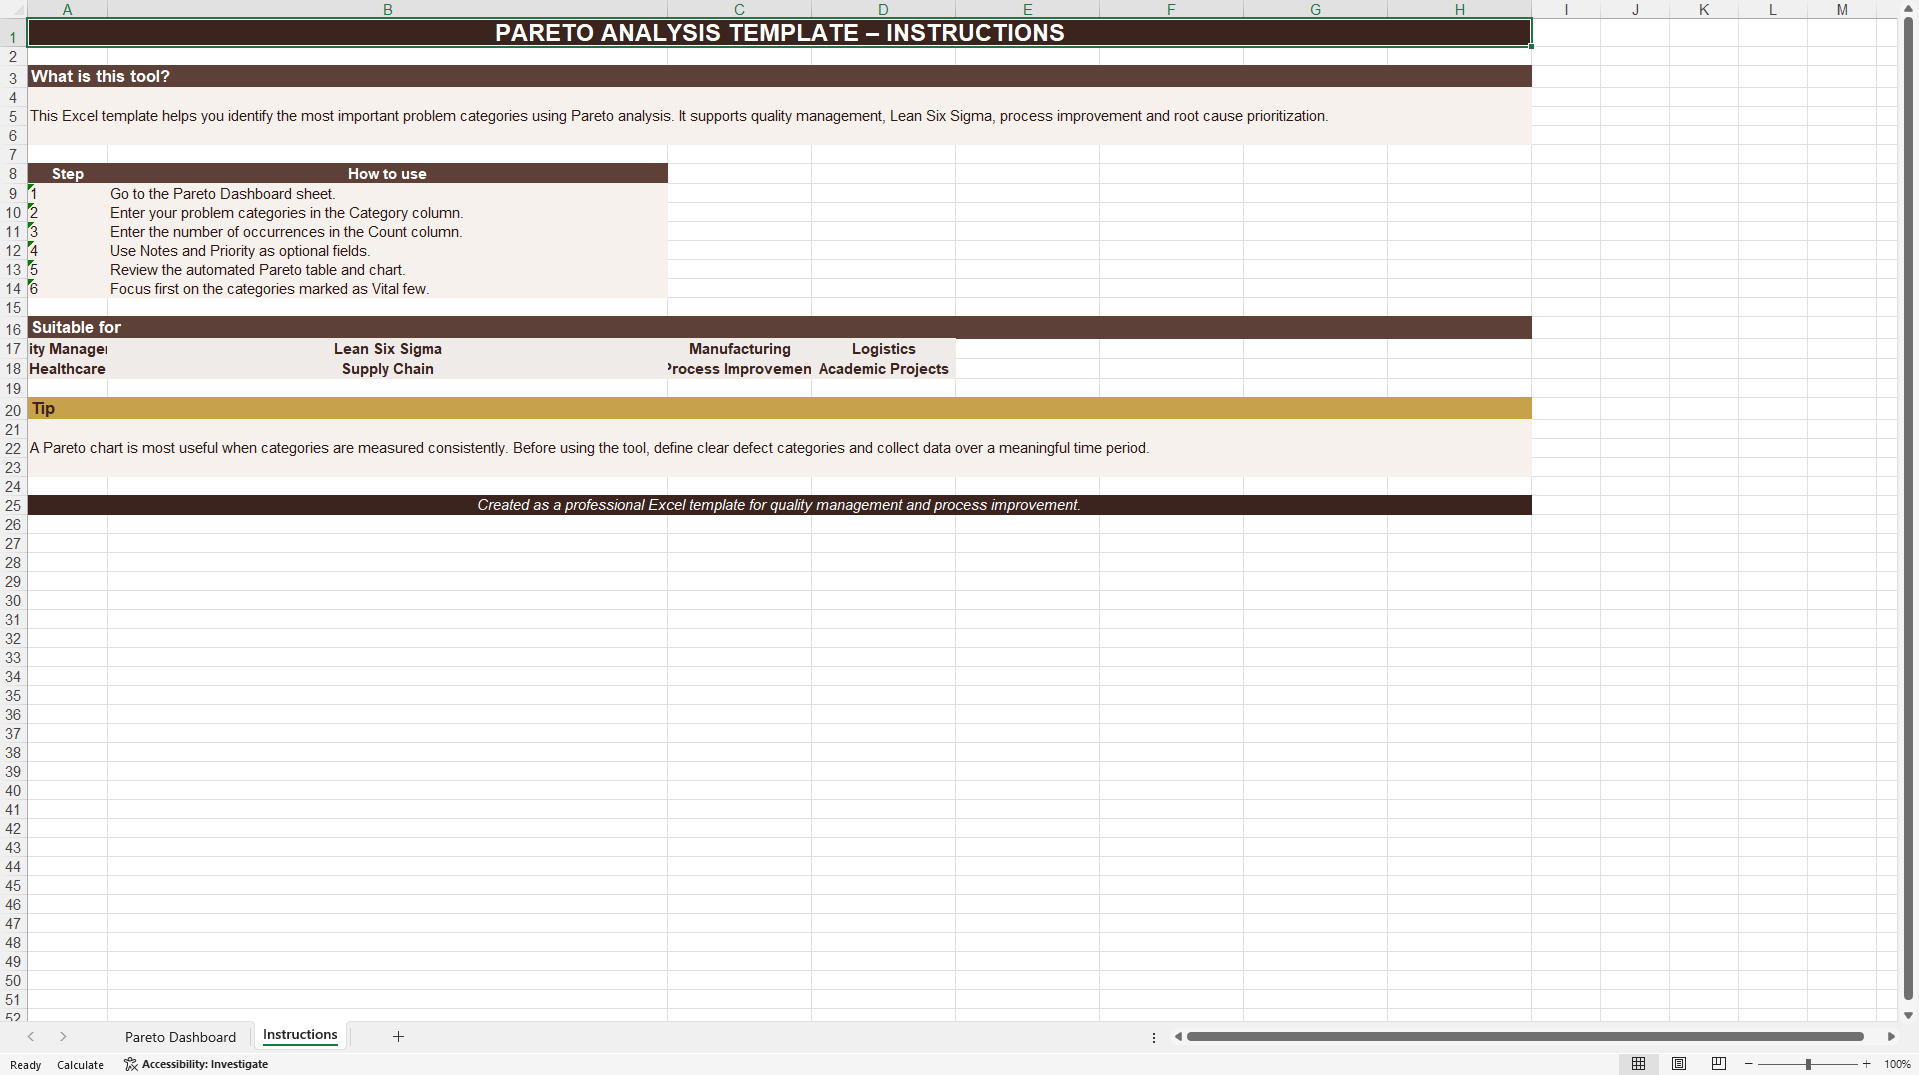
The functional layout coordinates data streams across two specialized worksheets designed for error-free execution. The user pipeline centers on the Pareto Dashboard sheet, which is split into a manual Input Area and an Automated Pareto Calculation matrix. In the input register, teams record distinct problem categories, total error counts, operational field notes, and assigned risk priorities.
The calculation engine instantly evaluates these rows, sorting data points to determine numerical ranks, percentage shares, cumulative defect counts, and cumulative percentages. Crucially, the model applies a mathematical threshold filter to classify each row into a definitive Focus column, explicitly tagging the "Vital few" core issues from the secondary process noise. Accompanied by a dedicated Instructions log for smooth corporate rollout, this tool operates entirely via native Excel formulas, ensuring total customization flexibility without complex macro barriers.
Got a question about the product? Email us at support@flevy.com or ask the author directly by using the "Ask the Author a Question" form. If you cannot view the preview above this document description, go here to view the large preview instead.
Source: Best Practices in Pareto Principle Excel: Pareto Analysis and 80/20 Rule Dashboard Excel (XLSX) Spreadsheet, g54219585o85
