
 Click main image to view in full screen. Unlock all 9 preview images:
Operating Solar Asset Acquisition & Tax Equity Flip Model – Excel XLSX
Excel (XLSX) + supplemental PDF


BENEFITS OF THIS DOWNLOADABLE EXCEL DOCUMENT
- Recalibrate the P50 from the plant own measured production record, weather-adjusted.
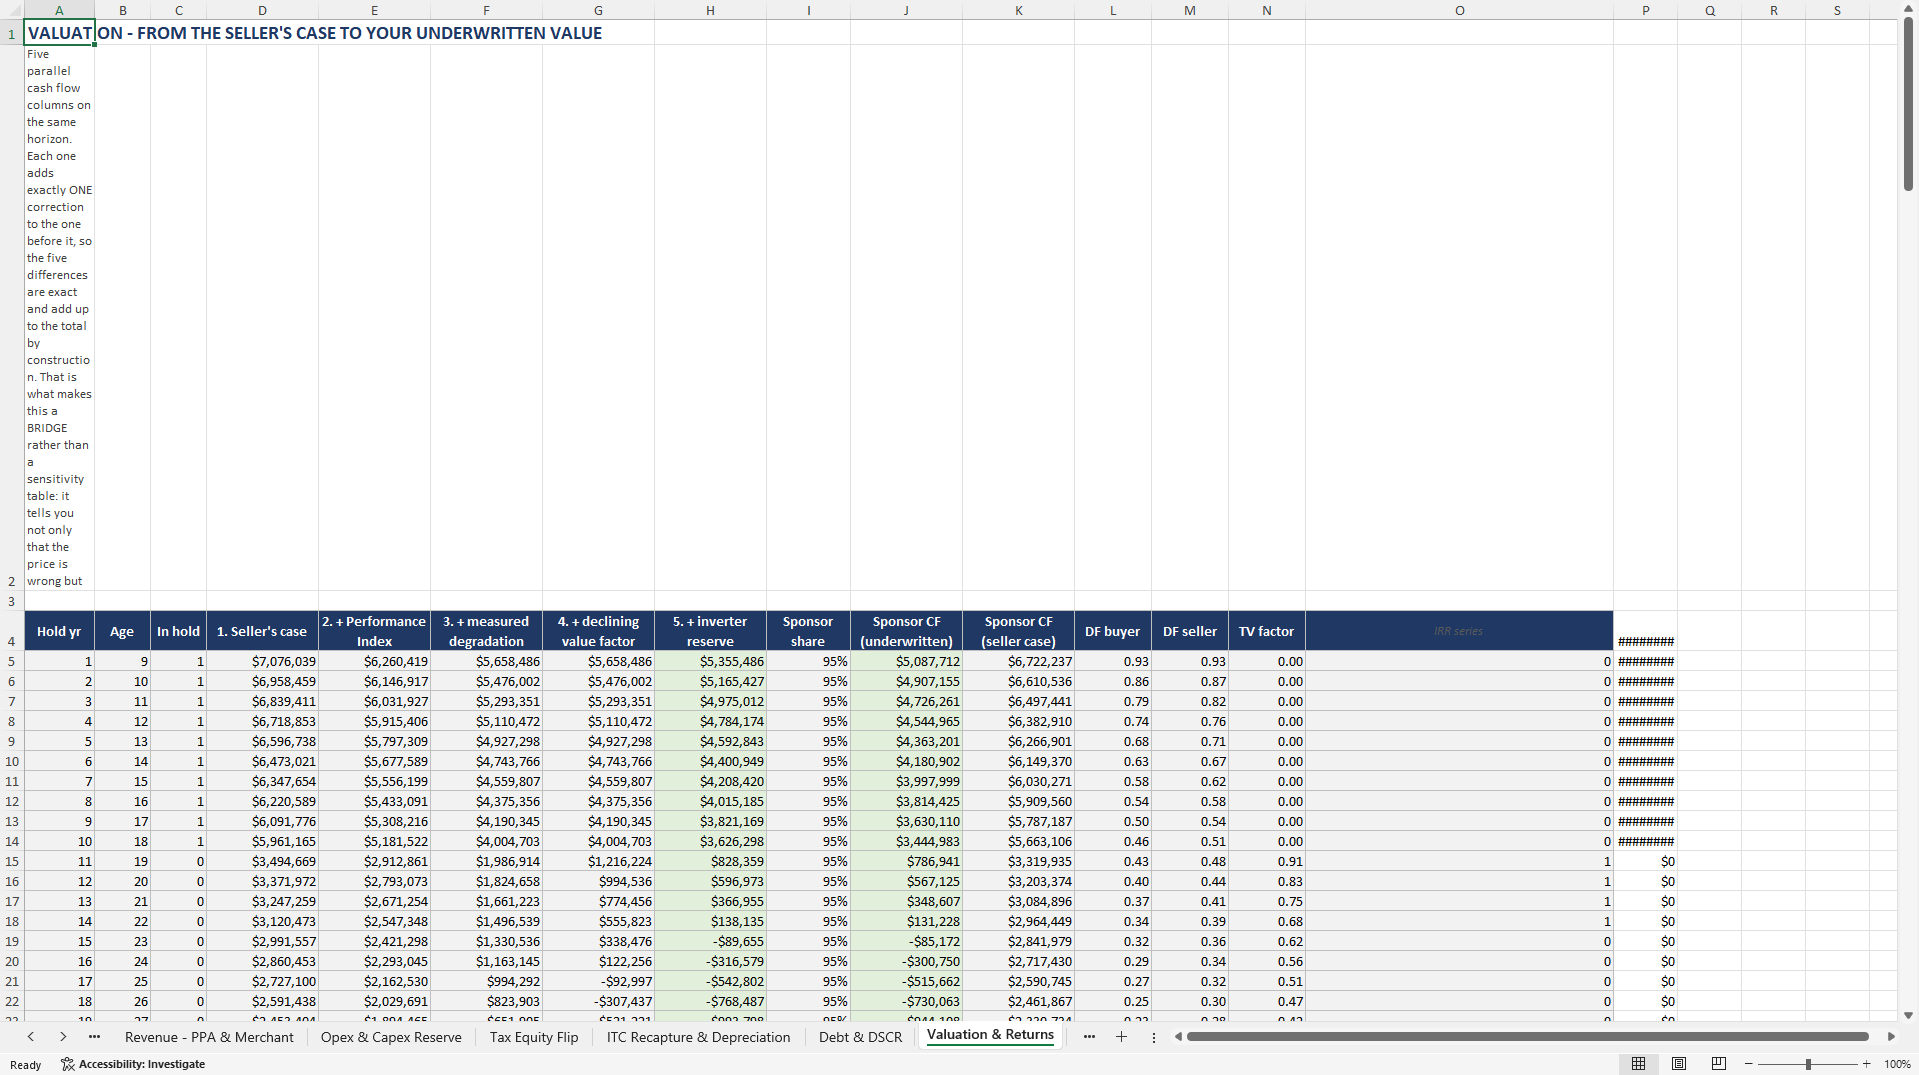
- See the valuation gap decomposed into five exact steps, so you know which assumption to negotiate.
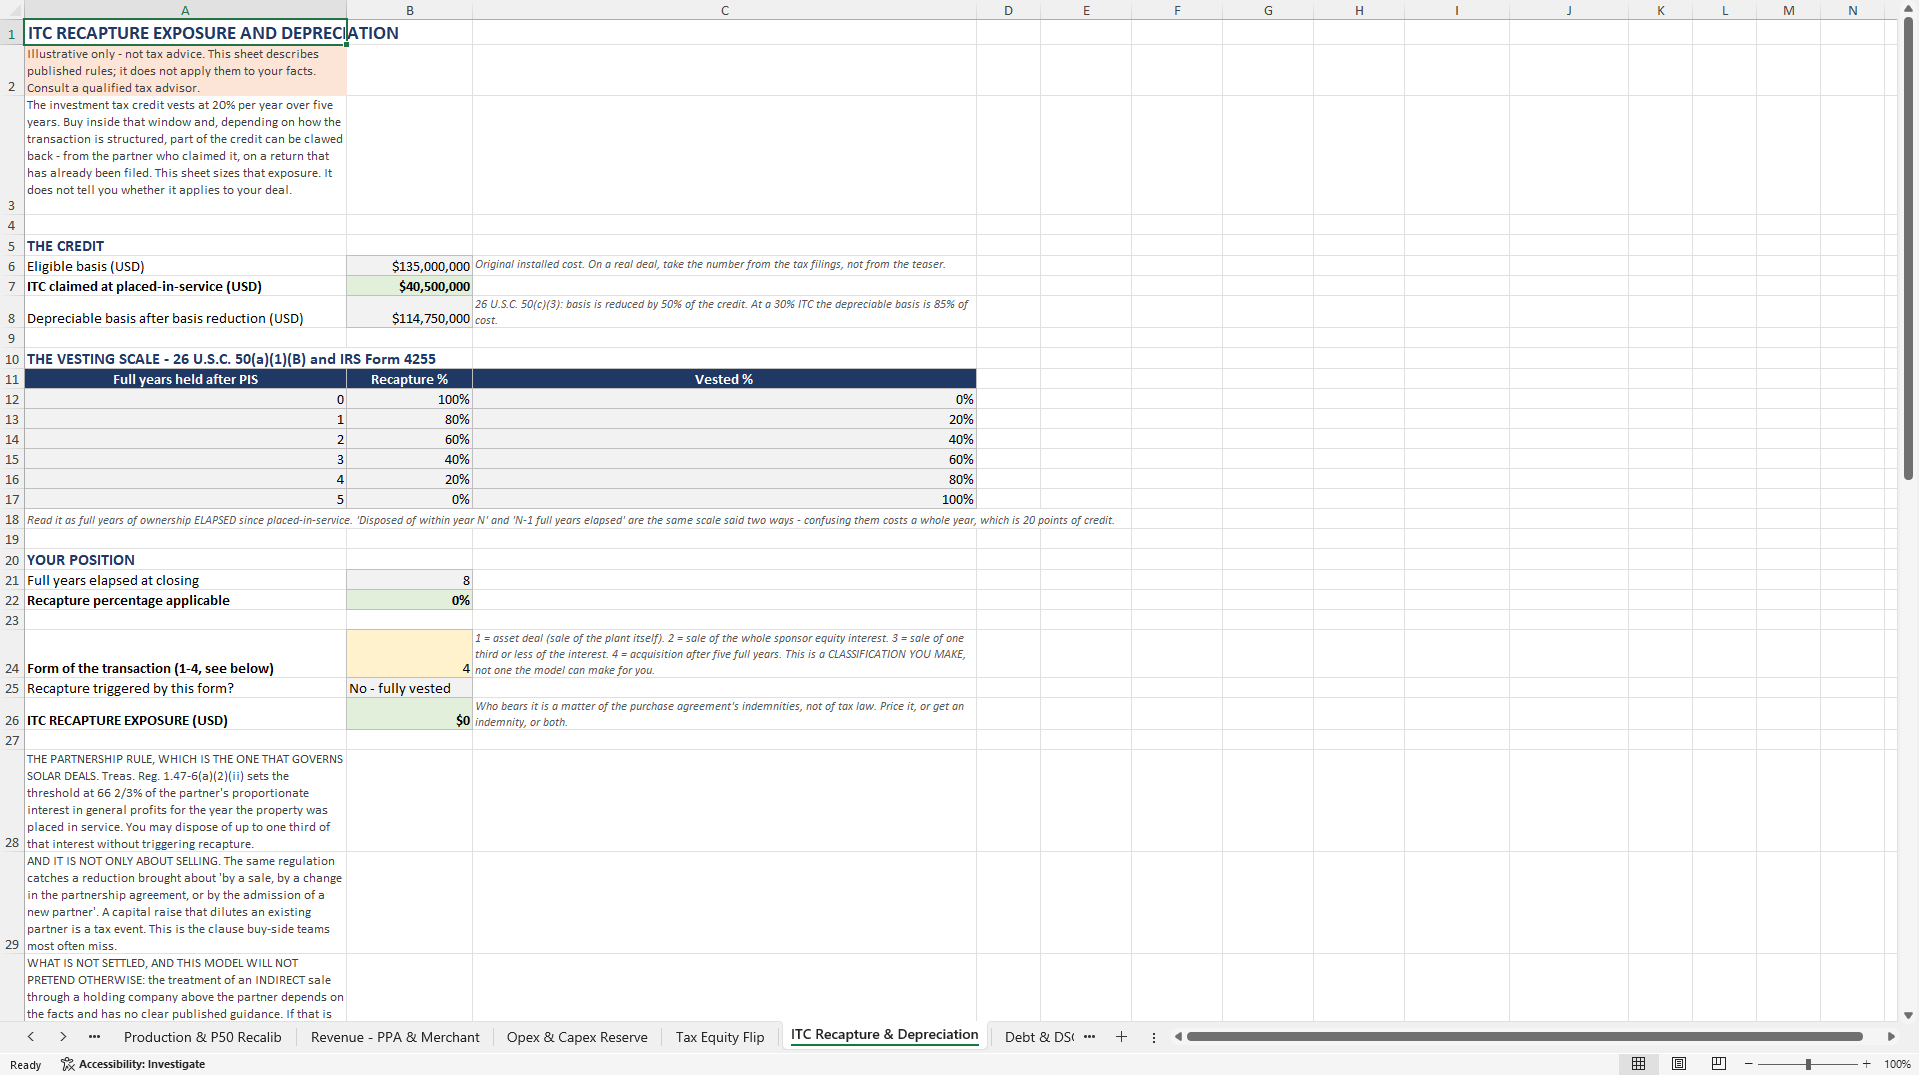
- Model the tax equity flip and size your ITC recapture exposure at a change of control.
SOLAR ENERGY EXCEL DESCRIPTION
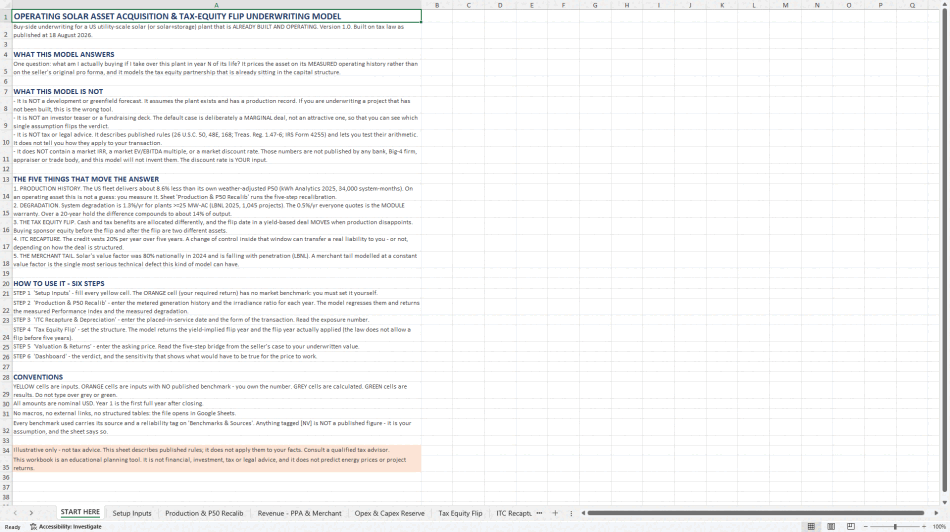
Most solar financial models forecast a plant that does not exist yet. This one underwrites a plant that does, and that changes everything, because an operating asset has a production record, and the record beats any forecast.
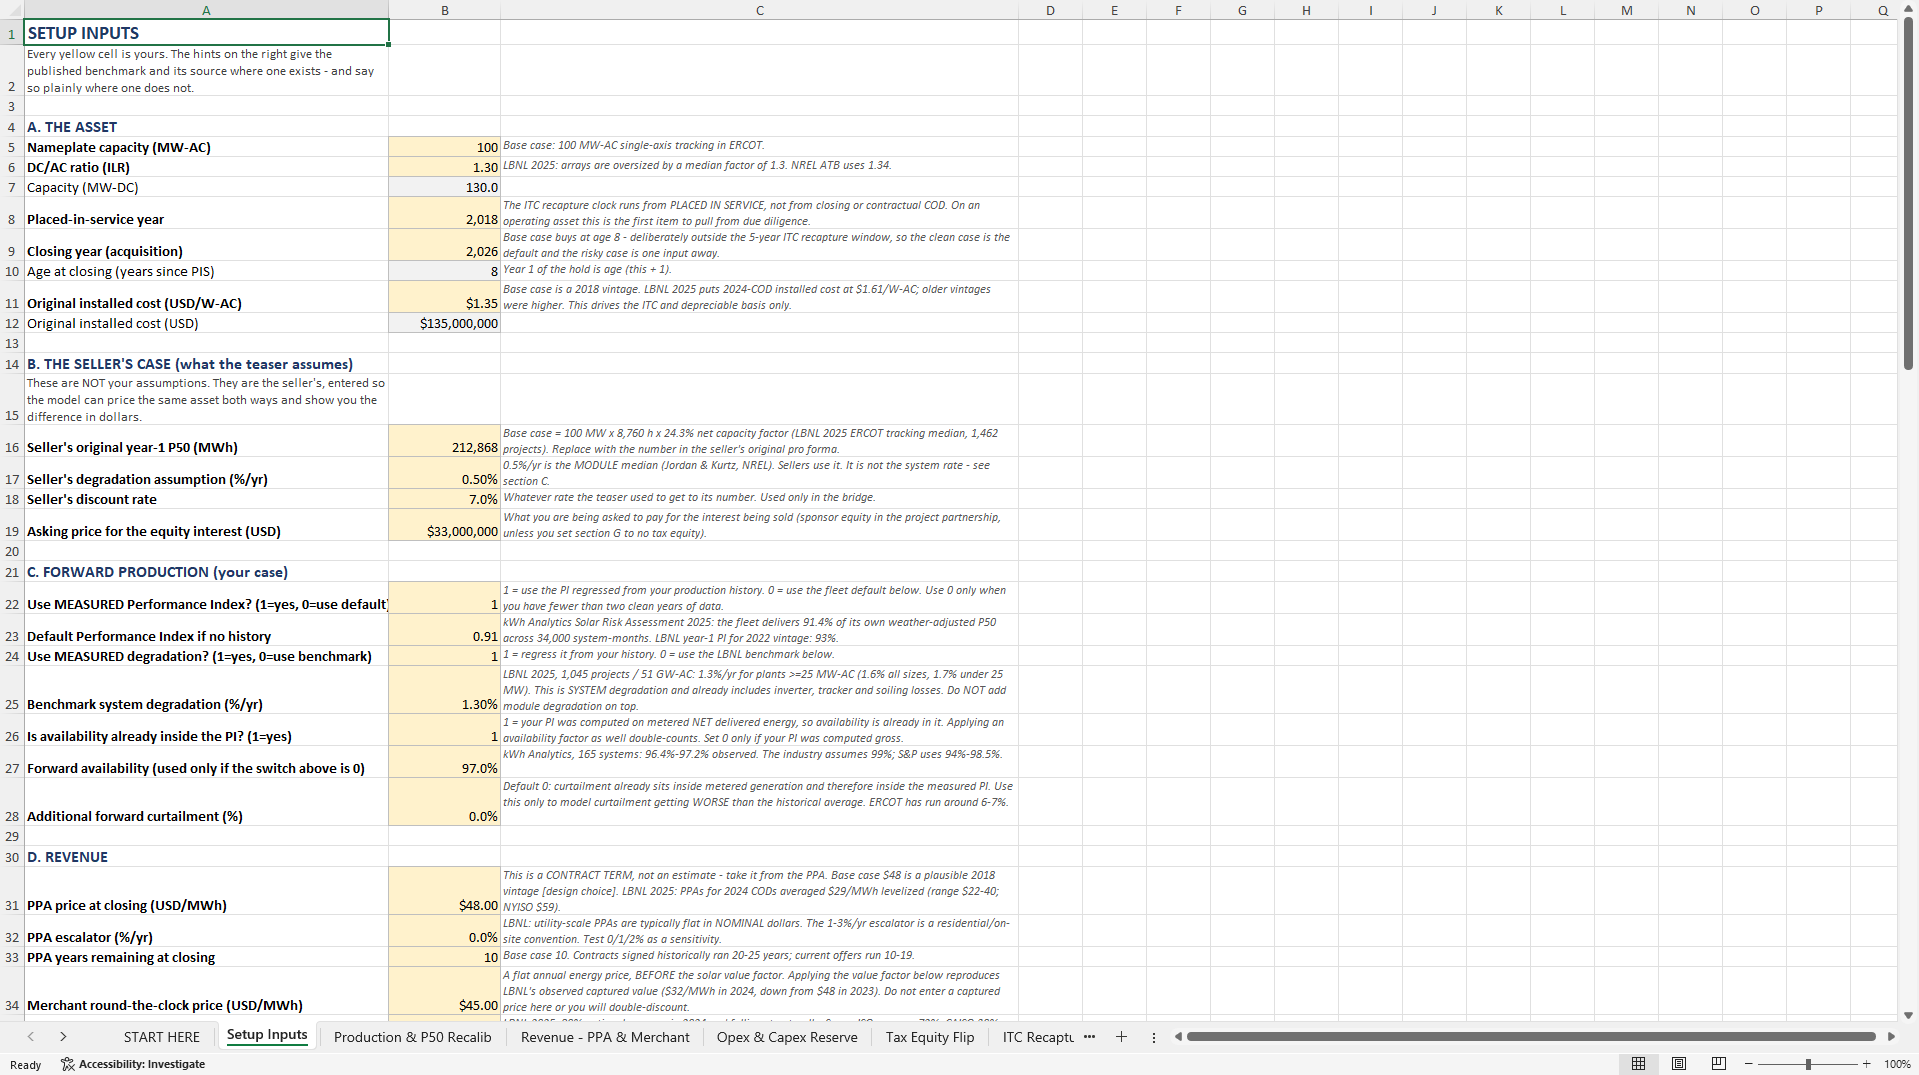
The model answers a single question: what are you actually buying if you take over this plant in year N of its life? It prices the same asset twice. The seller case runs on the assumptions in the teaser: the original P50 uncorrected, degradation at the module-warranty rate, a flat merchant value factor, no inverter reserve, and the discount rate the seller chose. The underwritten case runs on what survives diligence: the P50 recalibrated from the measured record, system degradation regressed from that same record, a merchant value factor that declines as solar penetration rises, a funded inverter reserve, and your required return. The distance between the two is decomposed into five exact steps, so you see not only that the price is wrong but what it is wrong about.
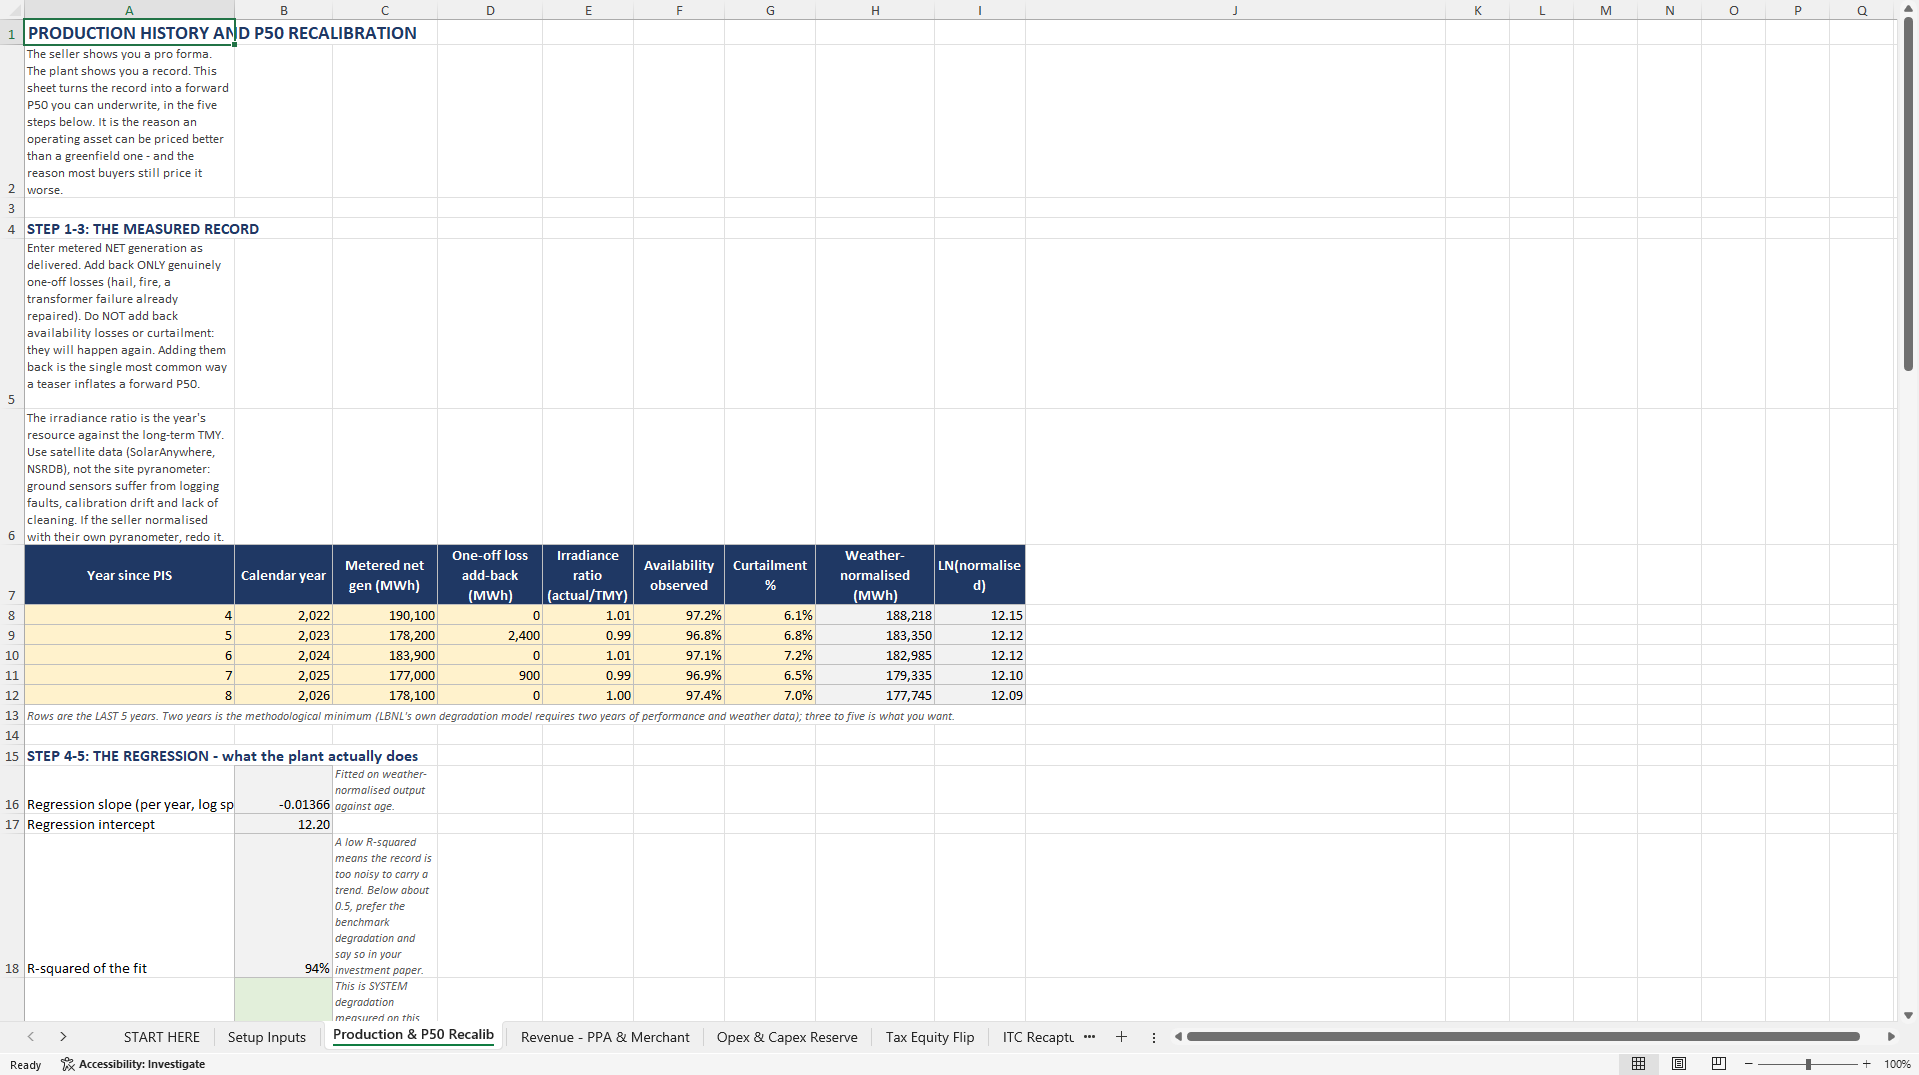
Three engines that competing models do not contain. First, a five-step P50 recalibration: weather-normalise the metered record against the typical meteorological year, separate recurring losses from genuine one-off events, and regress the log of normalised output against age. The slope gives you measured system degradation, the intercept gives you the Performance Index. The US fleet delivers roughly nine percent less than its own weather-adjusted P50; on an operating asset you do not have to assume that number, you can measure it.
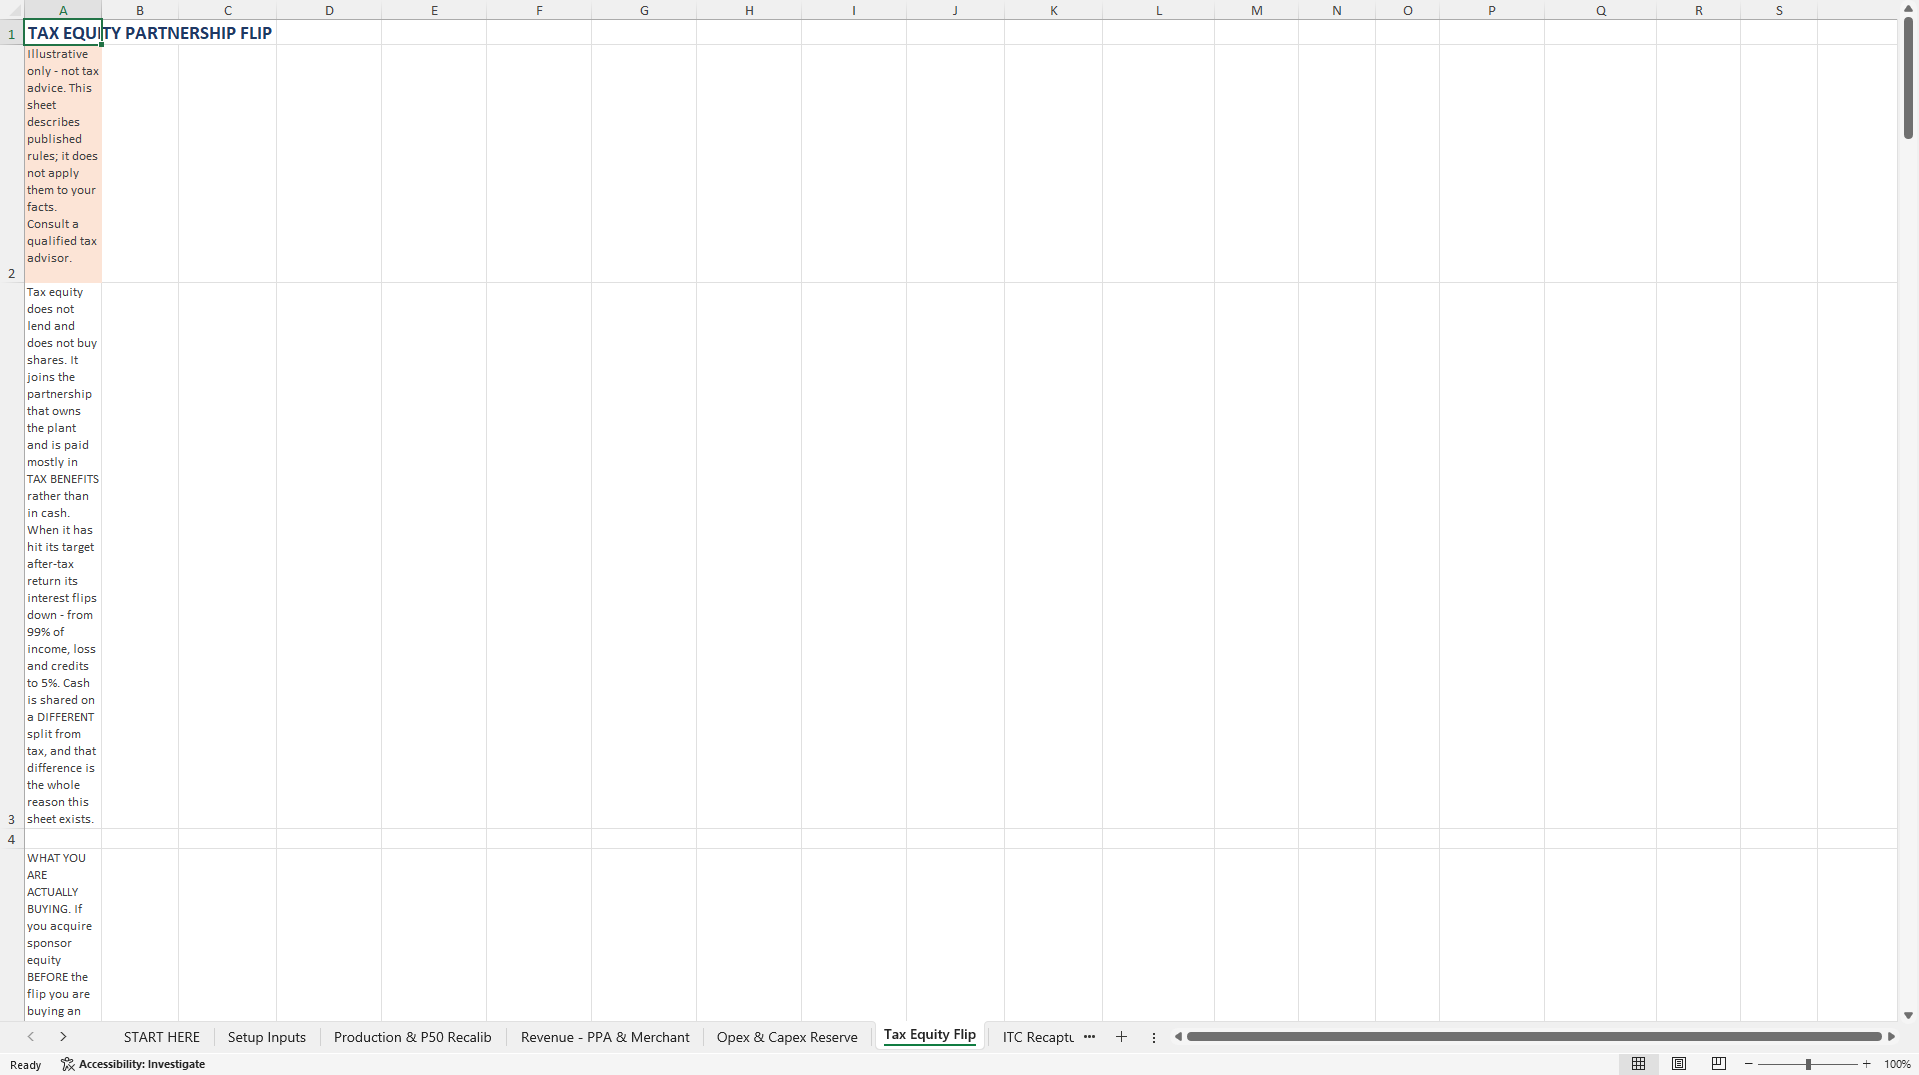
Second, a tax equity partnership flip waterfall. Pre-flip and post-flip allocations of cash and of tax benefits are held separately, the flip date is determined from the target after-tax return of the tax equity investor, and the statutory five-year minimum is enforced. Buying sponsor equity before the flip and after the flip are two different assets and they do not deserve the same discount rate.
Third, an investment tax credit recapture ladder: the twenty-percent-per-year vesting scale, the two-thirds partnership threshold, and the exposure sized by the form of your transaction.
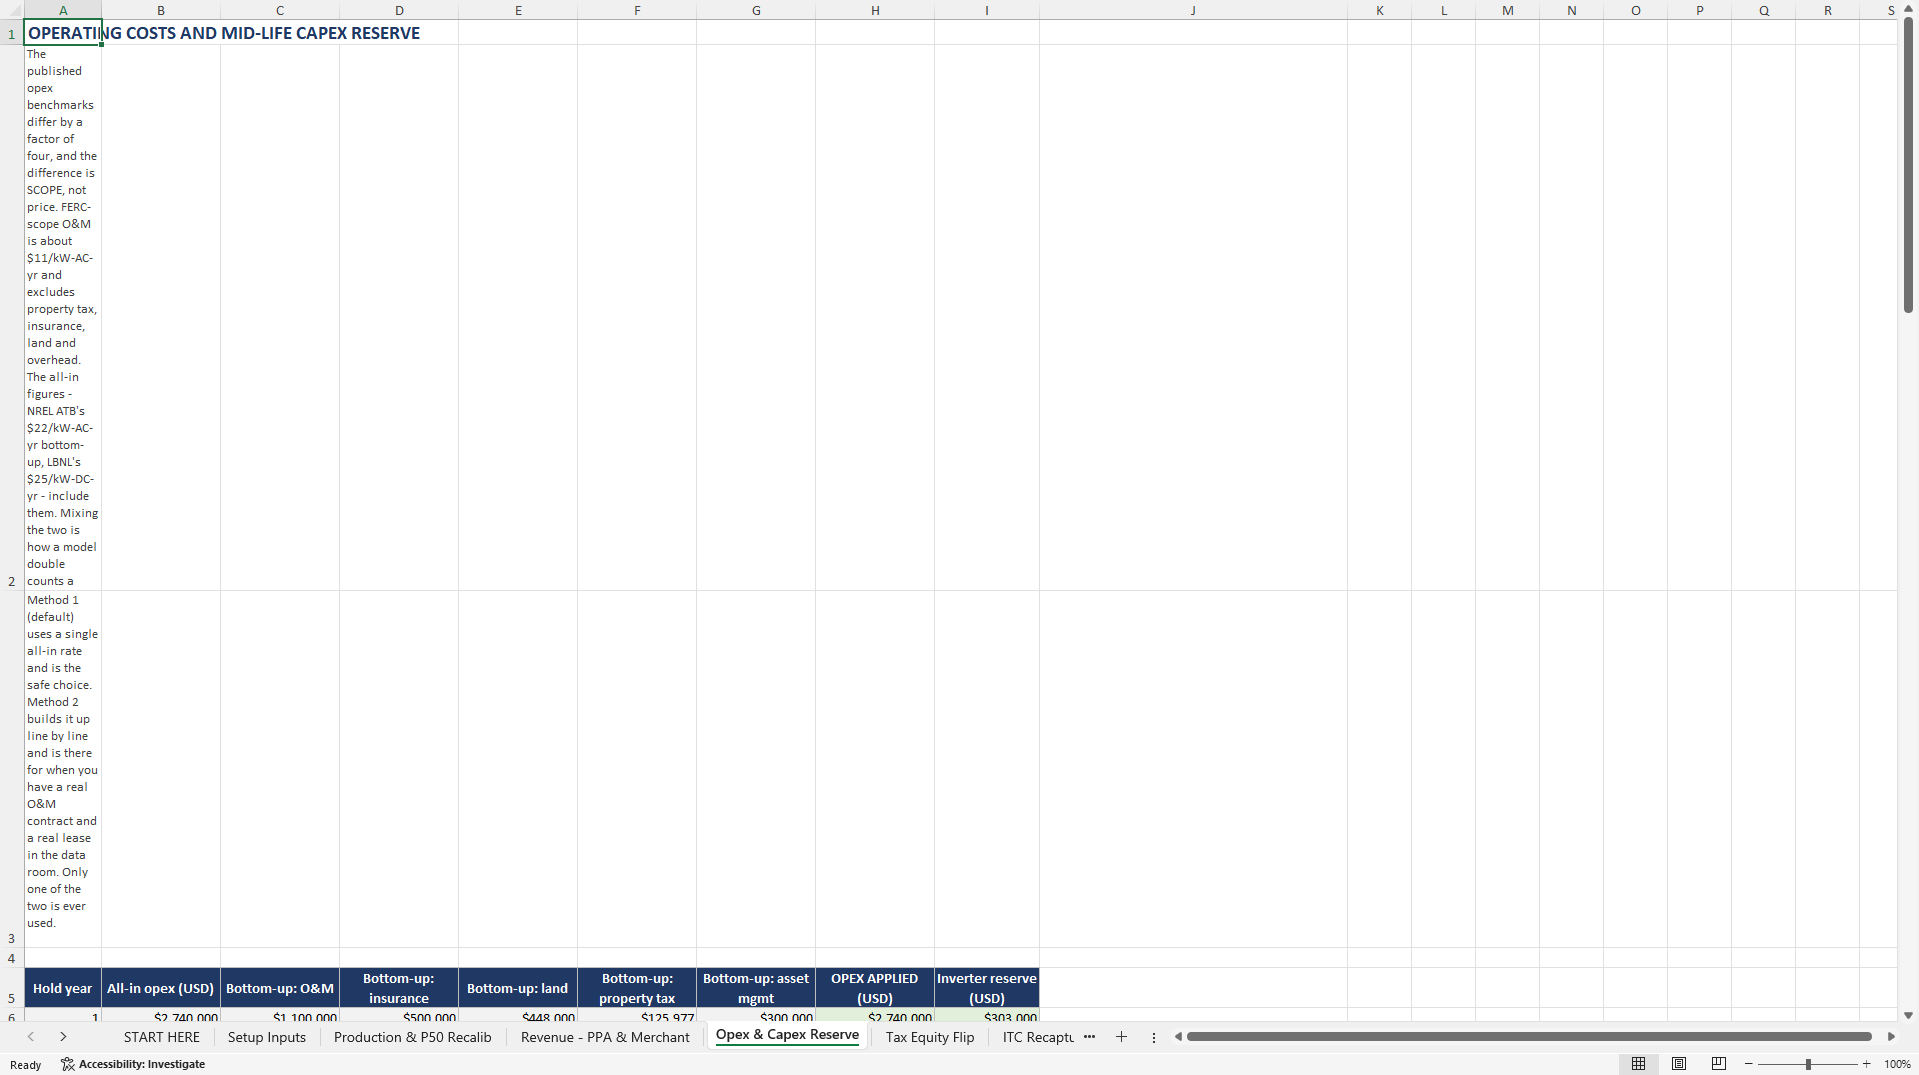
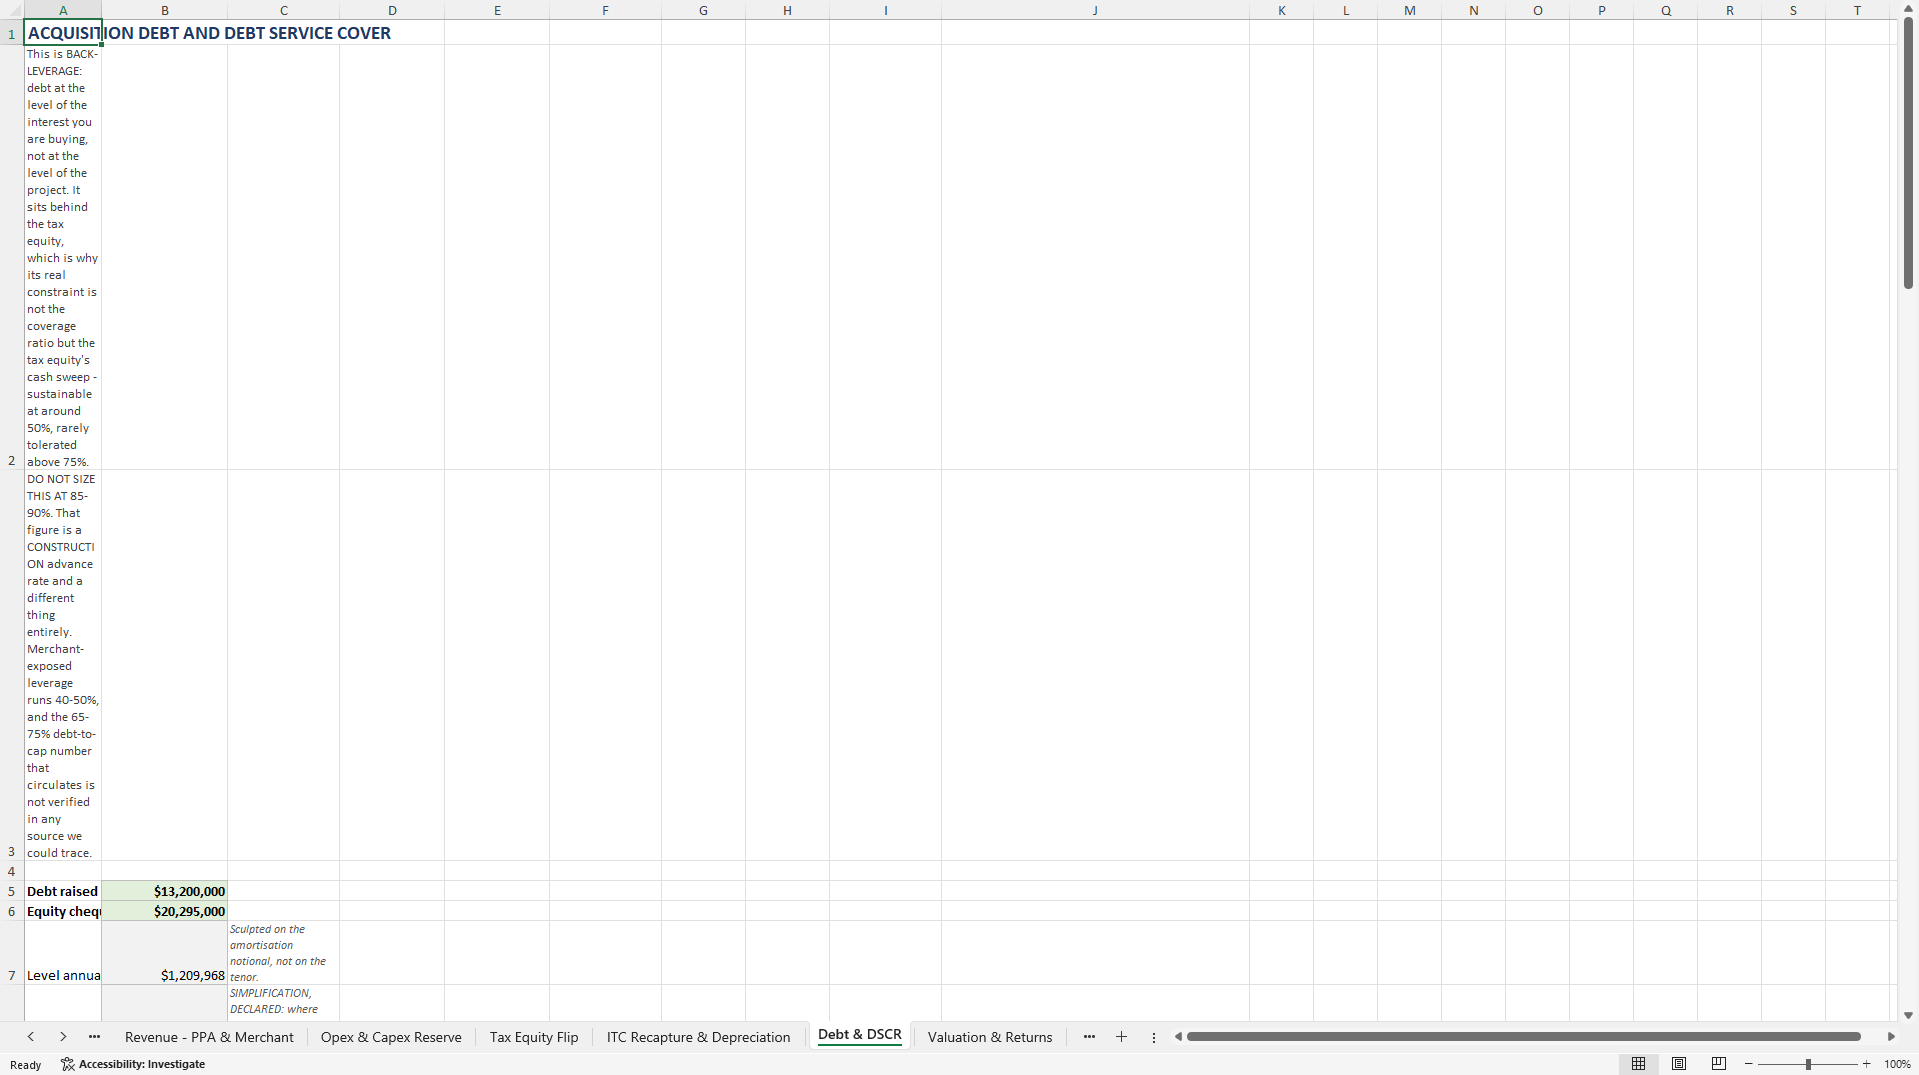
Also modelled: mark-to-market of the existing power purchase agreement, a merchant tail discounted separately at your rate plus an uplift, mid-life inverter reserve, back-leverage with separate contracted and merchant coverage tests, and the operating leverage of a mature asset, where operating costs run over a third of revenue rather than the twenty-two percent of a new plant.
Every benchmark carries its source and a reliability tag. Where no published benchmark exists, such as the discount rate, the value-factor decline rate, inverter replacement timing and transaction costs, the workbook says so instead of inventing one. The depreciation recovery period is deliberately an input, because the sources contradict each other and a model that asserts a contested tax position is worse than one that asks you to choose.
Eleven sheets and 1,752 formulas. Works in Excel and Google Sheets, with no macros and no external links. The accompanying PDF is a seven-page user guide that walks through the five-step recalibration, the flip mechanics, the recapture ladder and how to read the six-step valuation bridge. Educational planning tool, not financial, investment, tax or legal advice.
Got a question about the product? Email us at support@flevy.com or ask the author directly by using the "Ask the Author a Question" form. If you cannot view the preview above this document description, go here to view the large preview instead.
Source: Best Practices in Solar Energy, Integrated Financial Model Excel: Operating Solar Asset Acquisition & Tax Equity Flip Model Excel (XLSX) Spreadsheet, ProformaWorks
ABOUT THE AUTHOR

ProformaWorks builds acquisition-grade financial models for Main Street and lower-middle-market businesses - the kind of deal financed with an SBA 7(a) loan or a small commercial facility.
Every model answers one question: does this deal pencil at the bank? That means SDE or NOI rebuilt from the seller's own numbers, the add-backs a lender will and will not accept, a debt-service
... [read more]
Ask the Author a Question
You must be logged in to contact the author.




























