
Multi Sports Company (Complex) 10-Year Financial Model – Excel XLSX
Excel (XLSX)
BENEFITS OF THIS DOWNLOADABLE EXCEL DOCUMENT
- Provides a structured framework for building long-term financial forecasts for sports organizations.
- Helps analyze the financial impact of fan growth, events, and media revenue over time.
- Supports strategic planning and investment analysis for multi-sports organizations.
SPORT MANAGEMENT EXCEL DESCRIPTION
Curated by McKinsey-trained Executives
⚽ Multi-Sports Enterprise 3-Statement Financial Model (10-Year Forecast)
The Complete Financial Planning & Forecasting System for Sports Organizations, Clubs, and Multi-Sports Businesses 📊
The Multi-Sports Financial Model is a fully integrated 10-year financial forecasting Excel workbook designed for professional sports organizations and multi-sports companies.
Every revenue stream, operating cost, and cash flow projection is structured to reflect the core economic drivers of modern sports organizations – including fan growth, stadium attendance, ticket pricing, media rights, sponsorship agreements, and merchandise sales.
This model is designed to support strategic planning, investment analysis, and long-term financial forecasting for sports organizations.
If your business generates revenue from live sporting events, media rights, sponsorships, merchandising, and fan engagement, this financial model provides a structured system to project and analyze performance across a full decade.
✅ Fully structured Excel financial model
✅ Integrated Income Statement, Cash Flow Statement, and Balance Sheet
✅ 10-year strategic financial forecast
✅ Multiple sports revenue streams modeled
✅ Scenario analysis and executive dashboard included
✅ Built for sports executives, investors, analysts, and consultants
📊 Why This Sports Financial Model Is Different
Generic financial templates usually rely on simple revenue growth percentages.
Sports organizations operate differently.
Financial performance in sports is influenced by factors such as:
• growth of the global fan base
• stadium attendance and event scheduling
• ticket pricing and hospitality packages
• broadcast and streaming media agreements
• sponsorship partnerships
• merchandise and licensing sales
This model organizes those drivers into a structured forecasting system.
Change a key assumption – such as attendance rates, ticket pricing, or media revenue – and the financial projections update across the entire model.
👥 Fan & Audience Model – The Foundation of the Forecast
The model begins with fan and audience metrics, which influence several revenue streams.
The Fan & Attendance sheet models:
• total fan base growth over time
• digital audience expansion
• streaming subscribers
• attendance rates at sporting events
These metrics provide context for projecting revenue related to events, media reach, and merchandise demand.
🏟 Event & Stadium Operations Model
Live events are a core part of sports organization revenue.
The model includes operational assumptions such as:
• number of events per season
• stadium capacity
• attendance rates
• ticket pricing levels
• VIP and hospitality ticket pricing
• share of VIP ticket sales
These inputs generate forecasts for ticket revenue across all seasons in the 10-year projection.
💰 Revenue Model – Five Core Sports Revenue Streams
The financial model separates revenue into five major categories commonly used in sports financial reporting.
1. Ticket Sales Revenue
Ticket revenue includes multiple components:
• Standard ticket sales
• VIP and hospitality ticket sales
• Premium seating supplements
These components combine to generate Total Ticket Revenue for each forecast year.
2. Broadcast & Media Revenue
Media rights are a significant revenue source for many sports organizations.
The model includes:
• domestic broadcast rights
• international broadcast revenue
• streaming platform revenue
• digital content revenue
3. Sponsorship & Commercial Revenue
Corporate partnerships provide recurring commercial income.
Revenue includes:
• sponsorship agreements
• commercial partnerships
• brand collaborations associated with the organization.
4. Merchandise & Licensing Revenue
The model includes revenue from:
• fan merchandise sales
• branded apparel and products
• licensing agreements.
5. Other Sports Revenue
Additional revenue sources modeled include:
• player transfer income
• prize money
• youth academy training fees
• esports-related revenue.
Total Revenue
All revenue streams are aggregated into Total Revenue, calculated automatically across the full 10-year forecast period.
📉 Cost of Revenue – Game-Day and Production Costs
The model includes detailed operating costs directly related to revenue generation.
Cost categories include:
• event operations costs
• stadium operations expenses
• broadcast production costs
• league participation fees
• revenue sharing on ticket sales
• merchandise production costs
• game-day staffing and security
• athlete performance bonuses
These costs are used to calculate:
• Total Cost of Revenue
• Gross Profit
• Gross Margin
🧾 Operating Expenses – Sports Organization Structure
Operating expenses are grouped into three departments.
Sports Operations
Expenses associated with team and performance operations:
• athlete payroll
• coaching staff
• medical and sports science teams
• scouting and recruitment
• performance analytics staff
• training facility operations.
Marketing & Fan Engagement
Expenses related to growing and engaging the fan base:
• marketing campaigns
• digital marketing activities
• fan engagement programs.
General & Administrative
Corporate and administrative costs including:
• executive leadership
• finance and legal
• administrative operations
• insurance and professional services.
🏗 CapEx & Depreciation – Sports Infrastructure Investment
The model includes capital investments in areas such as:
• stadium improvements
• technology and digital infrastructure
• broadcasting equipment
• youth academy facilities.
A full PP&E roll-forward schedule tracks:
• capital expenditures
• depreciation
• net property, plant and equipment.
💼 Working Capital Schedule
The model tracks working capital components including:
Current Assets
• accounts receivable
• merchandise inventory
• prepaid expenses
Current Liabilities
• accounts payable
• accrued expenses
• deferred revenue.
This produces Net Working Capital and changes that flow into the cash flow statement.
💳 Debt & Equity Structure
The model includes a financing schedule covering:
• opening debt balances
• new debt issued
• principal repayments
• interest expense
• paid-in capital
• dividend payments.
This allows users to model different financing structures across the forecast period.
📊 Fully Integrated 3-Statement Financial Model
All worksheets are connected into a fully integrated system.
Assumptions flow into:
• the revenue model
• operating cost schedules
• capital expenditure planning
• financing structure
These flows automatically generate:
📑 Income Statement
💰 Cash Flow Statement
🧾 Balance Sheet
for every year of the forecast.
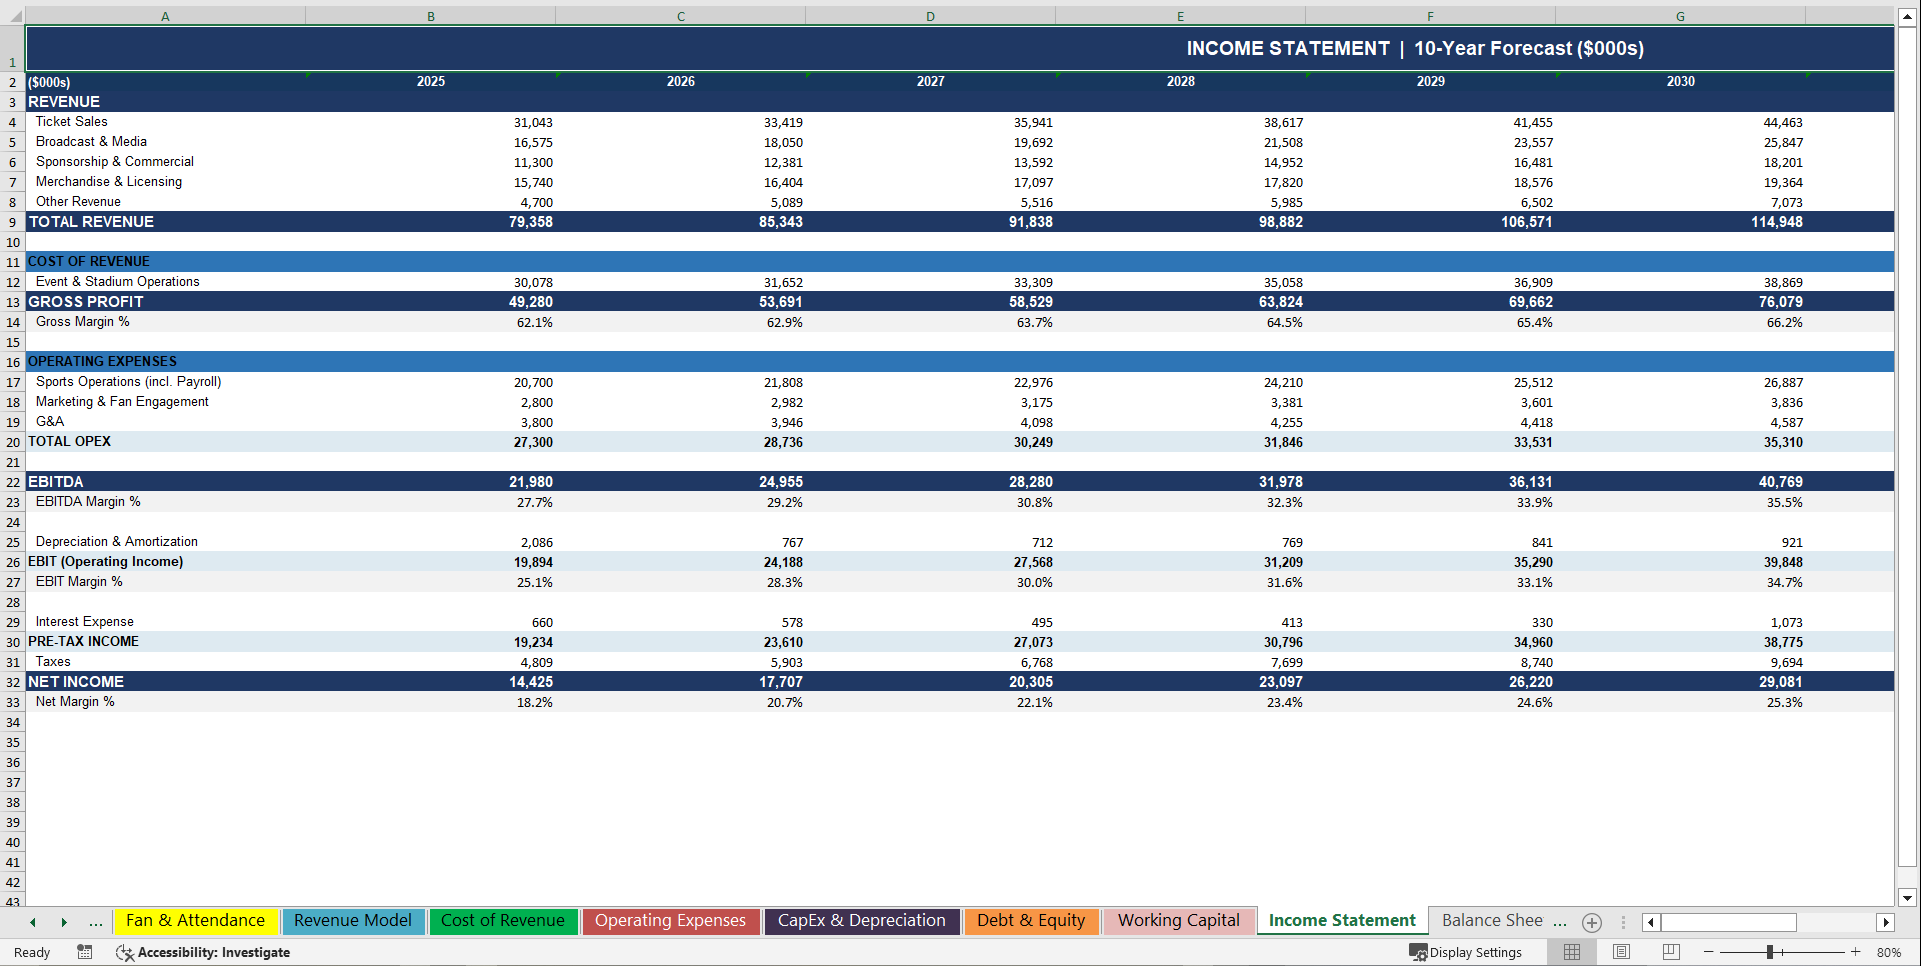
📑 Income Statement – 10-Year Sports P&L
The model calculates:
• total revenue
• cost of revenue
• gross profit
• operating expenses
• EBITDA
• depreciation and amortization
• interest expense
• income taxes
• net income.
💰 Cash Flow Statement – Indirect Method
The cash flow statement includes:
Operating activities
Net income
depreciation and amortization
± working capital changes
Investing activities
• capital expenditures
• player transfer payments.
Financing activities
• debt issuance
• debt repayments
• dividend payments.
🧾 Balance Sheet – Fully Linked Financial Position
The balance sheet tracks:
Assets
• cash and equivalents
• accounts receivable
• inventory
• prepaid expenses
• property, plant & equipment
• intangible assets such as player contracts.
Liabilities
• accounts payable
• accrued expenses
• deferred revenue
• short-term and long-term debt.
Equity
• paid-in capital
• retained earnings.
📊 Sensitivity & Scenario Analysis
The workbook includes a scenario analysis sheet that allows users to evaluate how different assumptions affect key results such as:
• total revenue
• EBITDA
• net income
• cash balance
• ticket revenue
• sponsorship revenue.
📈 Executive Dashboard
The model includes a dedicated executive dashboard that visualizes key performance metrics and financial projections.
Charts and indicators provide a clear overview of:
• revenue trends
• profitability performance
• operational growth
• financial position across the forecast period.
🎯 Who This Sports Financial Model Is Built For
✔ professional sports teams and clubs
✔ multi-sports organizations
✔ sports franchise investors
✔ sports media companies
✔ sports consultants and advisors
✔ financial analysts evaluating sports businesses
✔ investors assessing sports assets.
🚀 The Complete Sports Financial Forecasting System
This model connects:
⚽ event and attendance projections
👥 fan base growth
📺 media and broadcasting revenue
🤝 sponsorship and commercial income
👕 merchandise and licensing sales
🏟 stadium operations
🏗 infrastructure investment
💳 financing structure
💰 working capital dynamics
…into a single integrated 10-year financial forecasting system for sports organizations.
Key Words:
Strategy & Transformation, Growth Strategy, Strategic Planning, Strategy Frameworks, Innovation Management, Pricing Strategy, Core Competencies, Strategy Development, Business Transformation, Marketing Plan Development, Product Strategy, Breakout Strategy, Competitive Advantage, Mission, Vision, Values, Strategy Deployment & Execution, Innovation, Vision Statement, Core Competencies Analysis, Corporate Strategy, Product Launch Strategy, BMI, Blue Ocean Strategy, Breakthrough Strategy, Business Model Innovation, Business Strategy Example, Corporate Transformation, Critical Success Factors, Customer Segmentation, Customer Value Proposition, Distinctive Capabilities, Enterprise Performance Management, KPI, Key Performance Indicators, Market Analysis, Market Entry Example, Market Entry Plan, Market Intelligence, Market Research, Market Segmentation, Market Sizing, Marketing, Michael Porter's Value Chain, Organizational Transformation, Performance Management, Performance Measurement, Platform Strategy, Product Go-to-Market Strategy, Reorganization, Restructuring, SWOT, SWOT Analysis, Service 4.0, Service Strategy, Service Transformation, Strategic Analysis, Strategic Plan Example, Strategy Deployment, Strategy Execution, Strategy Frameworks Compilation, Strategy Methodologies, Strategy Report Example, Value Chain, Value Chain Analysis, Value Innovation, Value Proposition, Vision Statement, Corporate Strategy, Business Development, Business plan pdf, business plan, PDF, Business Plan DOC, Business Plan Template, PPT, Market strategy playbook, strategic market planning, competitive analysis tools, market segmentation frameworks, growth strategy templates, product positioning strategy, market execution toolkit, strategic alignment playbook, KPI and OKR frameworks, business growth strategy guide, cross-functional strategy templates, market risk management, market strategy PowerPoint doc, guide, ebook, e-book ,McKinsey Change Playbook, Organizational change management toolkit, Change management frameworks 2025, Influence model for change, Change leadership strategies, Behavioral change in organizations, Change management PowerPoint templates, Transformational leadership in change, supply chain KPIs, supply chain KPI toolkit, supply chain PowerPoint template, logistics KPIs, procurement KPIs, inventory management KPIs, supply chain performance metrics, manufacturing KPIs, supply chain dashboard, supply chain strategy KPIs, reverse logistics KPIs, sustainability KPIs in supply chain, financial supply chain KPIs, warehouse KPIs, digital supply chain KPIs, 1200 KPIs, supply chain scorecard, KPI examples, supply chain templates, Corporate Finance SOPs, Finance SOP Excel Template, CFO Toolkit, Finance Department Procedures, Financial Planning SOPs, Treasury SOPs, Accounts Payable SOPs, Accounts Receivable SOPs, General Ledger SOPs, Accounting Policies Template, Internal Controls SOPs, Finance Process Standardization, Finance Operating Procedures, Finance Department Excel Template, FP&A Process Documentation, Corporate Finance Template, Finance SOP Toolkit, CFO Process Templates, Accounting SOP Package, Tax Compliance SOPs, Financial Risk Management Procedures.
NOTE: Our digital products are sold on an "as is" basis, making returns and refunds unavailable post-download. Please preview and inquire before purchasing. Please contact us before purchasing if you have any questions! This policy aligns with the standard Flevy Terms of Usage.
Got a question about the product? Email us at support@flevy.com or ask the author directly by using the "Ask the Author a Question" form. If you cannot view the preview above this document description, go here to view the large preview instead.
Source: Best Practices in Sport Management, Integrated Financial Model Excel: Multi Sports Company (Complex) 10-Year Financial Model Excel (XLSX) Spreadsheet, SB Consulting
ABOUT THE AUTHOR
SB Consulting is dedicated to empowering businesses to communicate their ideas with impact. This consulting firm specializes in teaching organizations how to create effective corporate and management presentations. With training from top-tier global consulting firms, including McKinsey, BCG, and Porsche Consulting, extensive expertise in presentation design and ... [read more]
Ask the Author a Question
You must be logged in to contact the author.
