
 Click main image to view in full screen. Unlock all 18 preview images:
MSP / MSSP 60-Month Financial Model & Valuation – Excel XLSX
Excel (XLSX) + supplemental PDF


BENEFITS OF THIS DOWNLOADABLE EXCEL DOCUMENT
- Integrates MSP/MSSP recurring revenue, service-delivery capacity, security-stack economics, costs, three statements and valuation in one 60-month Excel model.
- Supports pricing, churn, staffing, SLA, cloud-resale, client-margin, concentration, pipeline and cash-flow decisions from a centralized driver set.
- Provides DCF and revenue-multiple valuation cross-checks, discount-rate/exit-multiple sensitivity, and executive, sales and technical dashboards.
INFORMATION TECHNOLOGY EXCEL DESCRIPTION
MSP / MSSP 60-Month Financial Model & Valuation
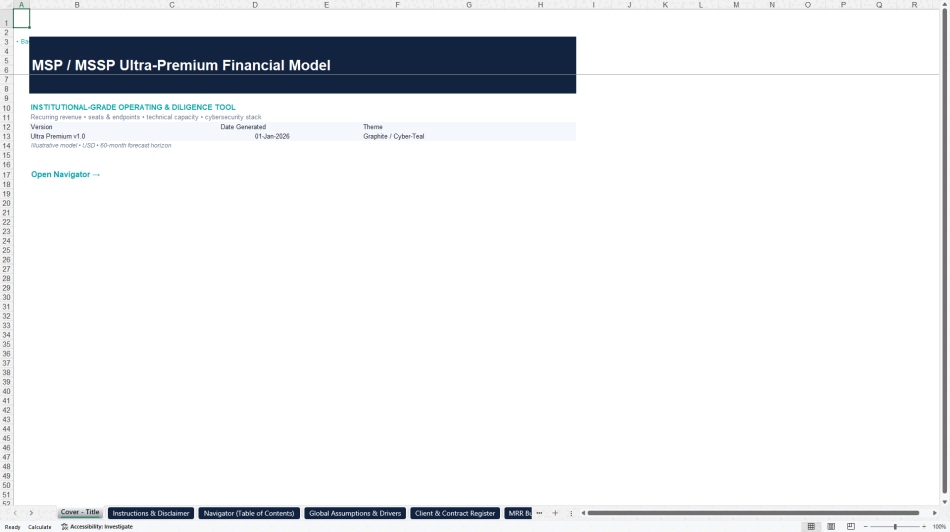
This Excel model is built for managed service providers, managed security service providers, IT-services operators, finance teams, founders, advisors, and acquisition buyers who need one connected view of recurring revenue, client economics, service-delivery capacity, cybersecurity-stack margins, financial statements, and valuation.
Seller-supplied and already tested; no Studio workbook audit was performed.
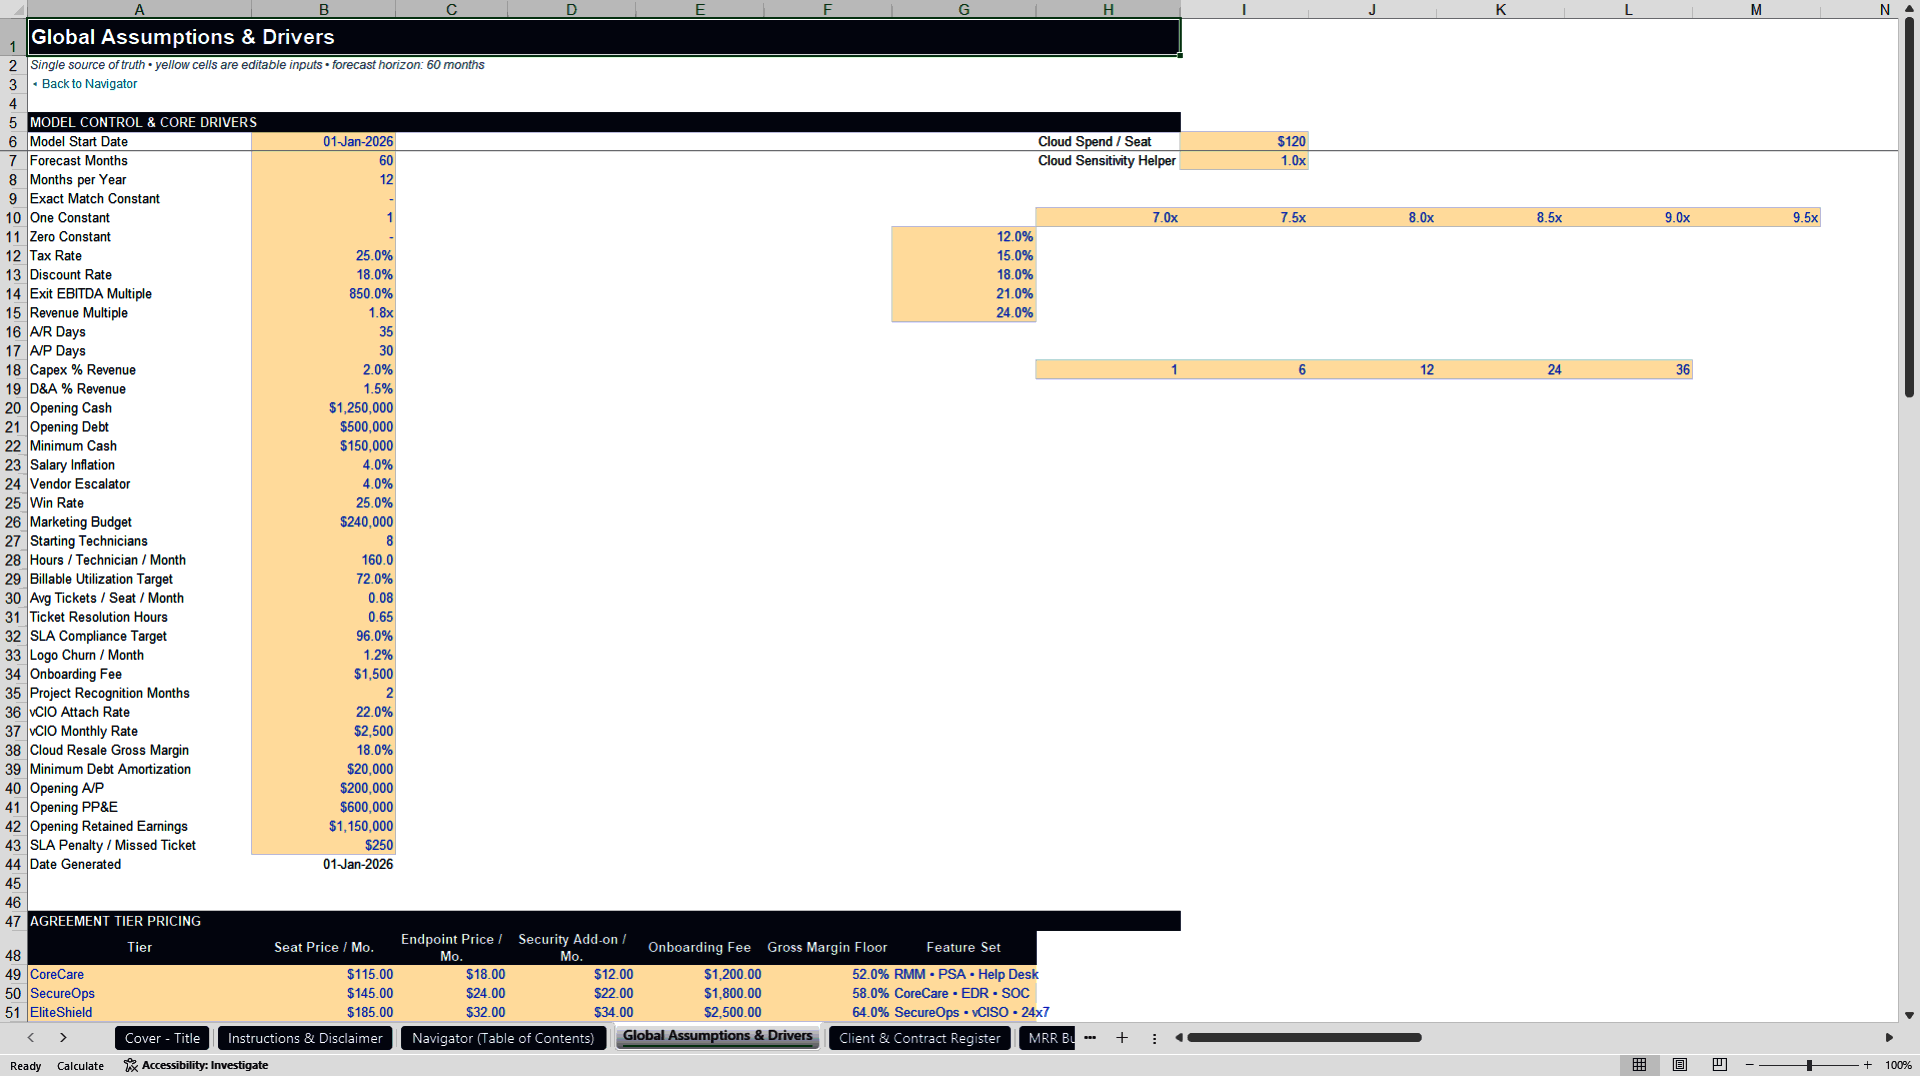
The workbook uses a 60-month monthly forecast and starts with a centralized Global Assumptions & Drivers sheet. Editable operating assumptions cover pricing, churn, tax and valuation inputs, accounts-receivable and accounts-payable days, capex and depreciation, opening cash and debt, salary inflation, vendor escalation, marketing, technician capacity, ticket demand, resolution hours, SLA targets, onboarding fees, vCIO attachment, cloud-resale margin, debt amortization, client data, headcount, tool-stack economics, operating expenses, and sales-pipeline assumptions.
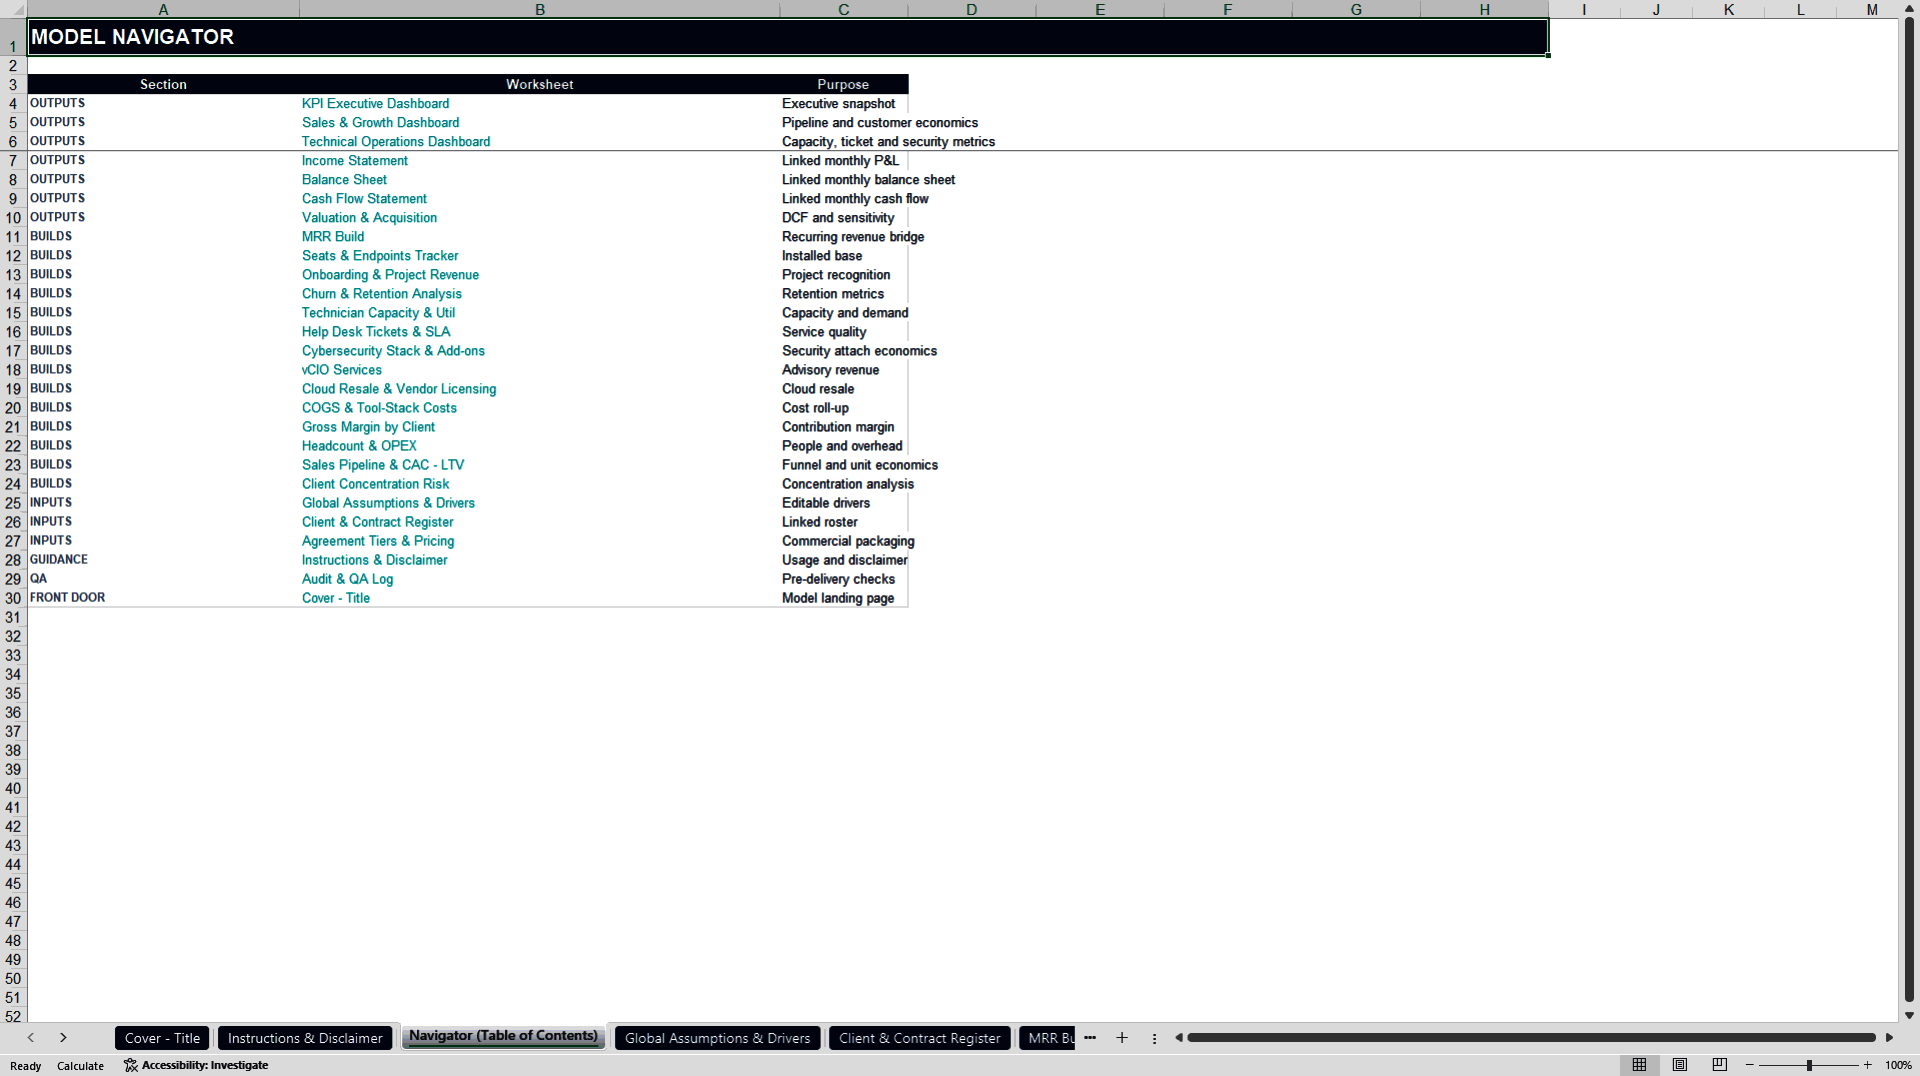
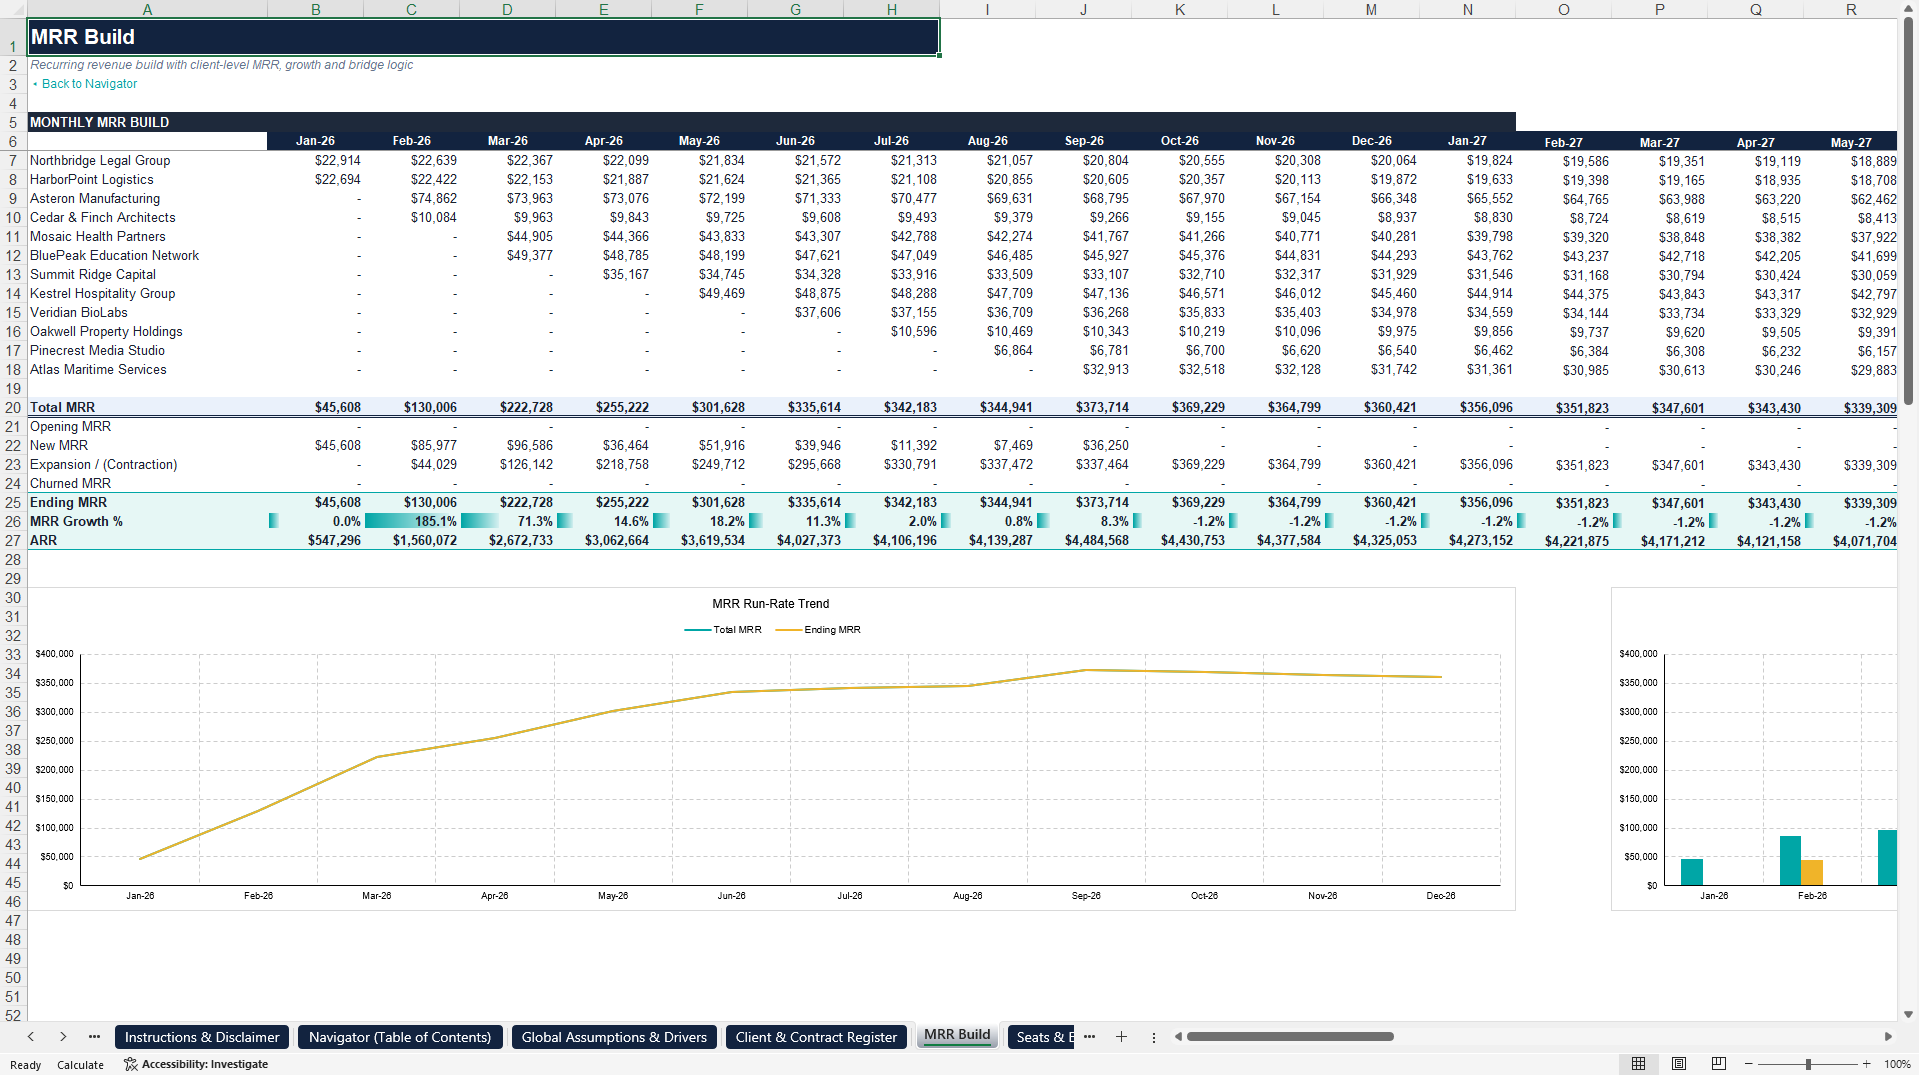
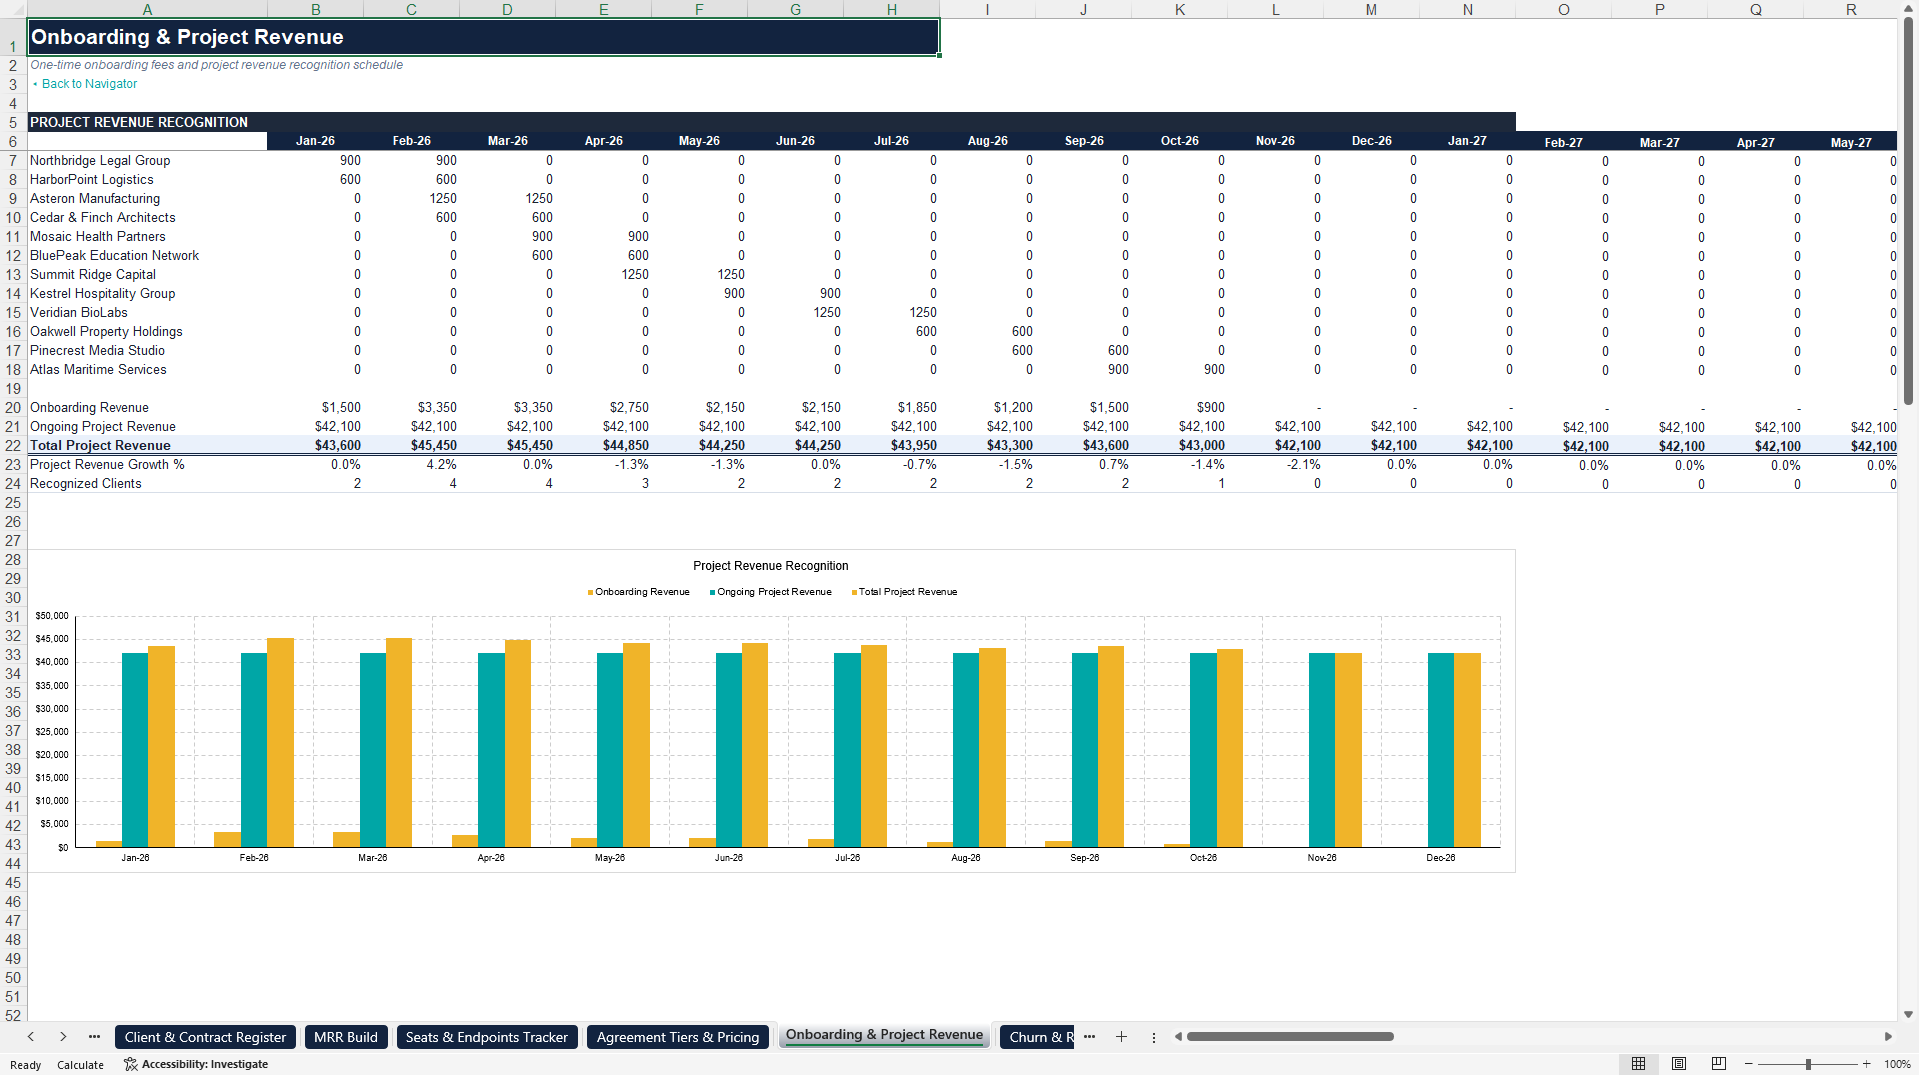
Commercial schedules connect client tier, seats, endpoints, contract timing, project fees, advisory fees, service tickets, and security attachment to recurring and non-recurring revenue. The MRR Build and Seats & Endpoints Tracker provide the recurring-revenue and installed-base foundation. Onboarding & Project Revenue, vCIO Services, Cloud Resale & Vendor Licensing, and Cybersecurity Stack & Add-ons extend the model across additional MSP/MSSP revenue streams.
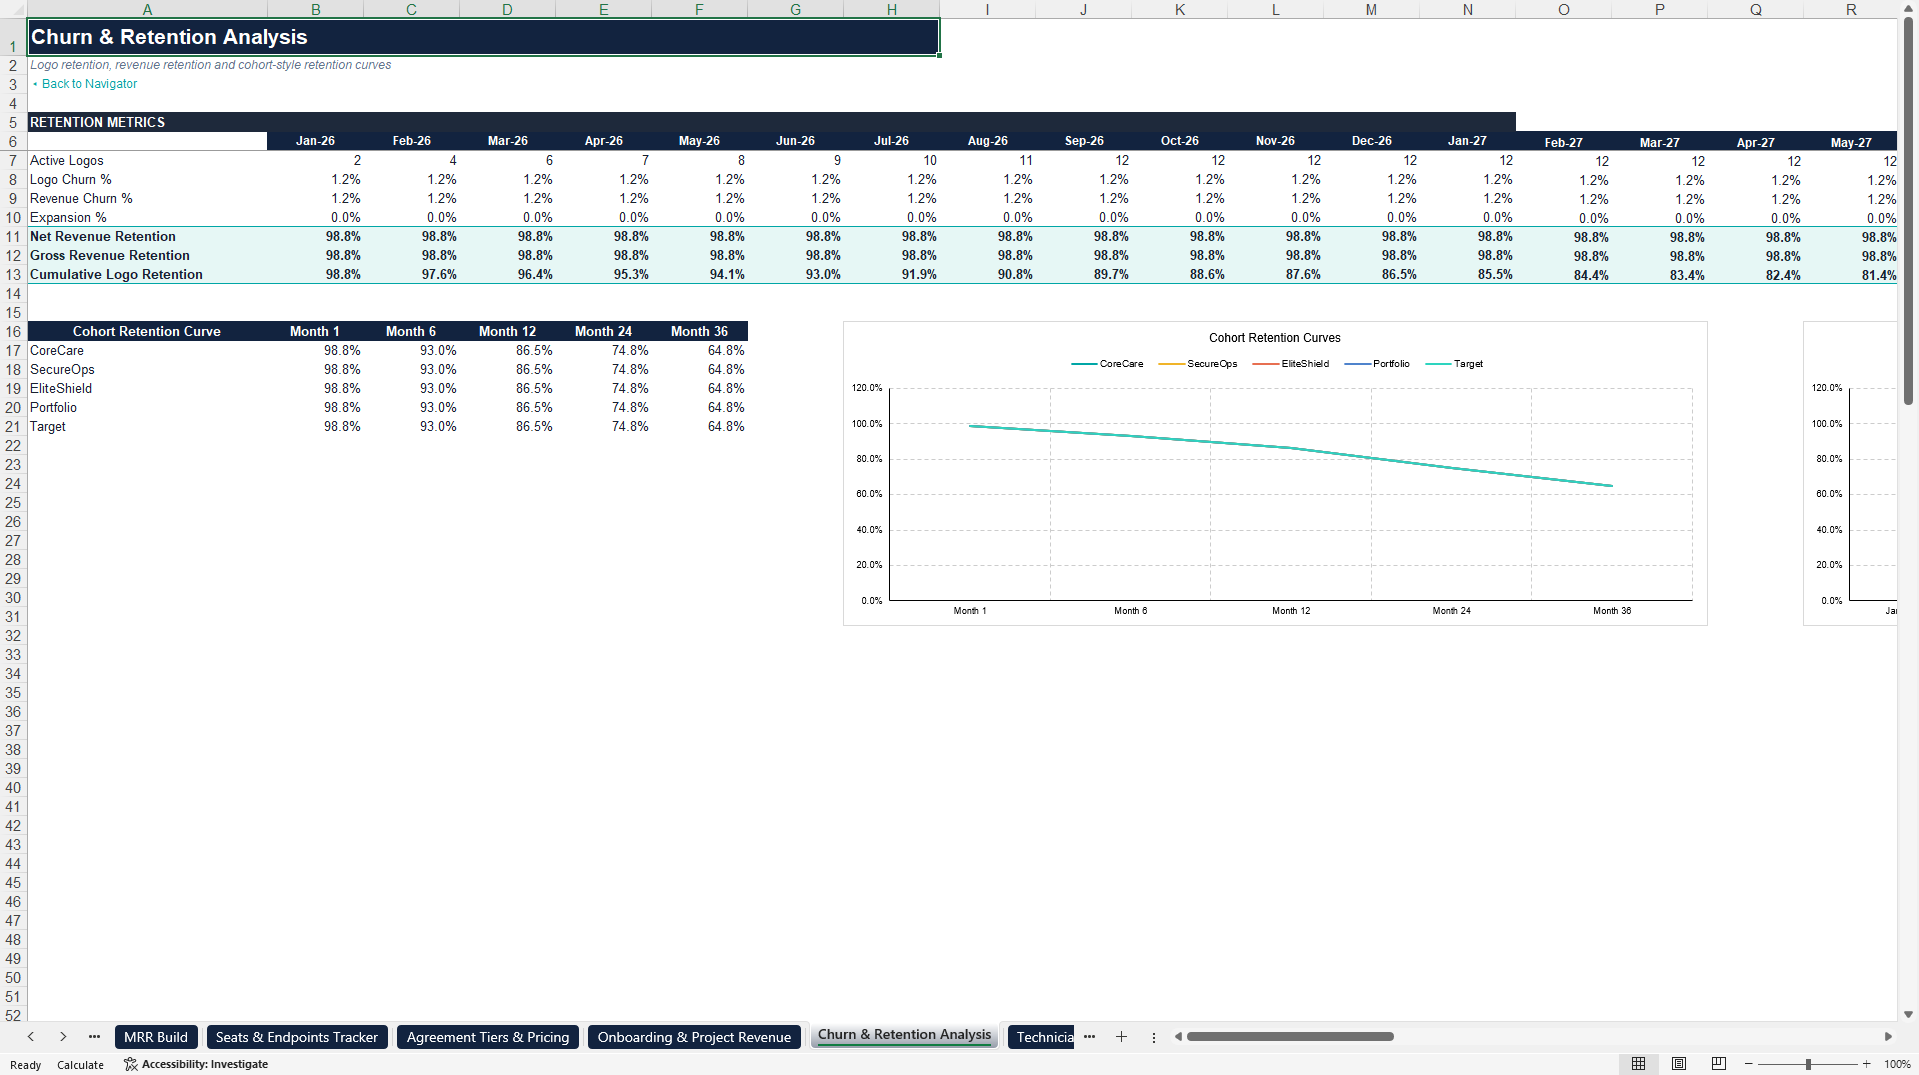
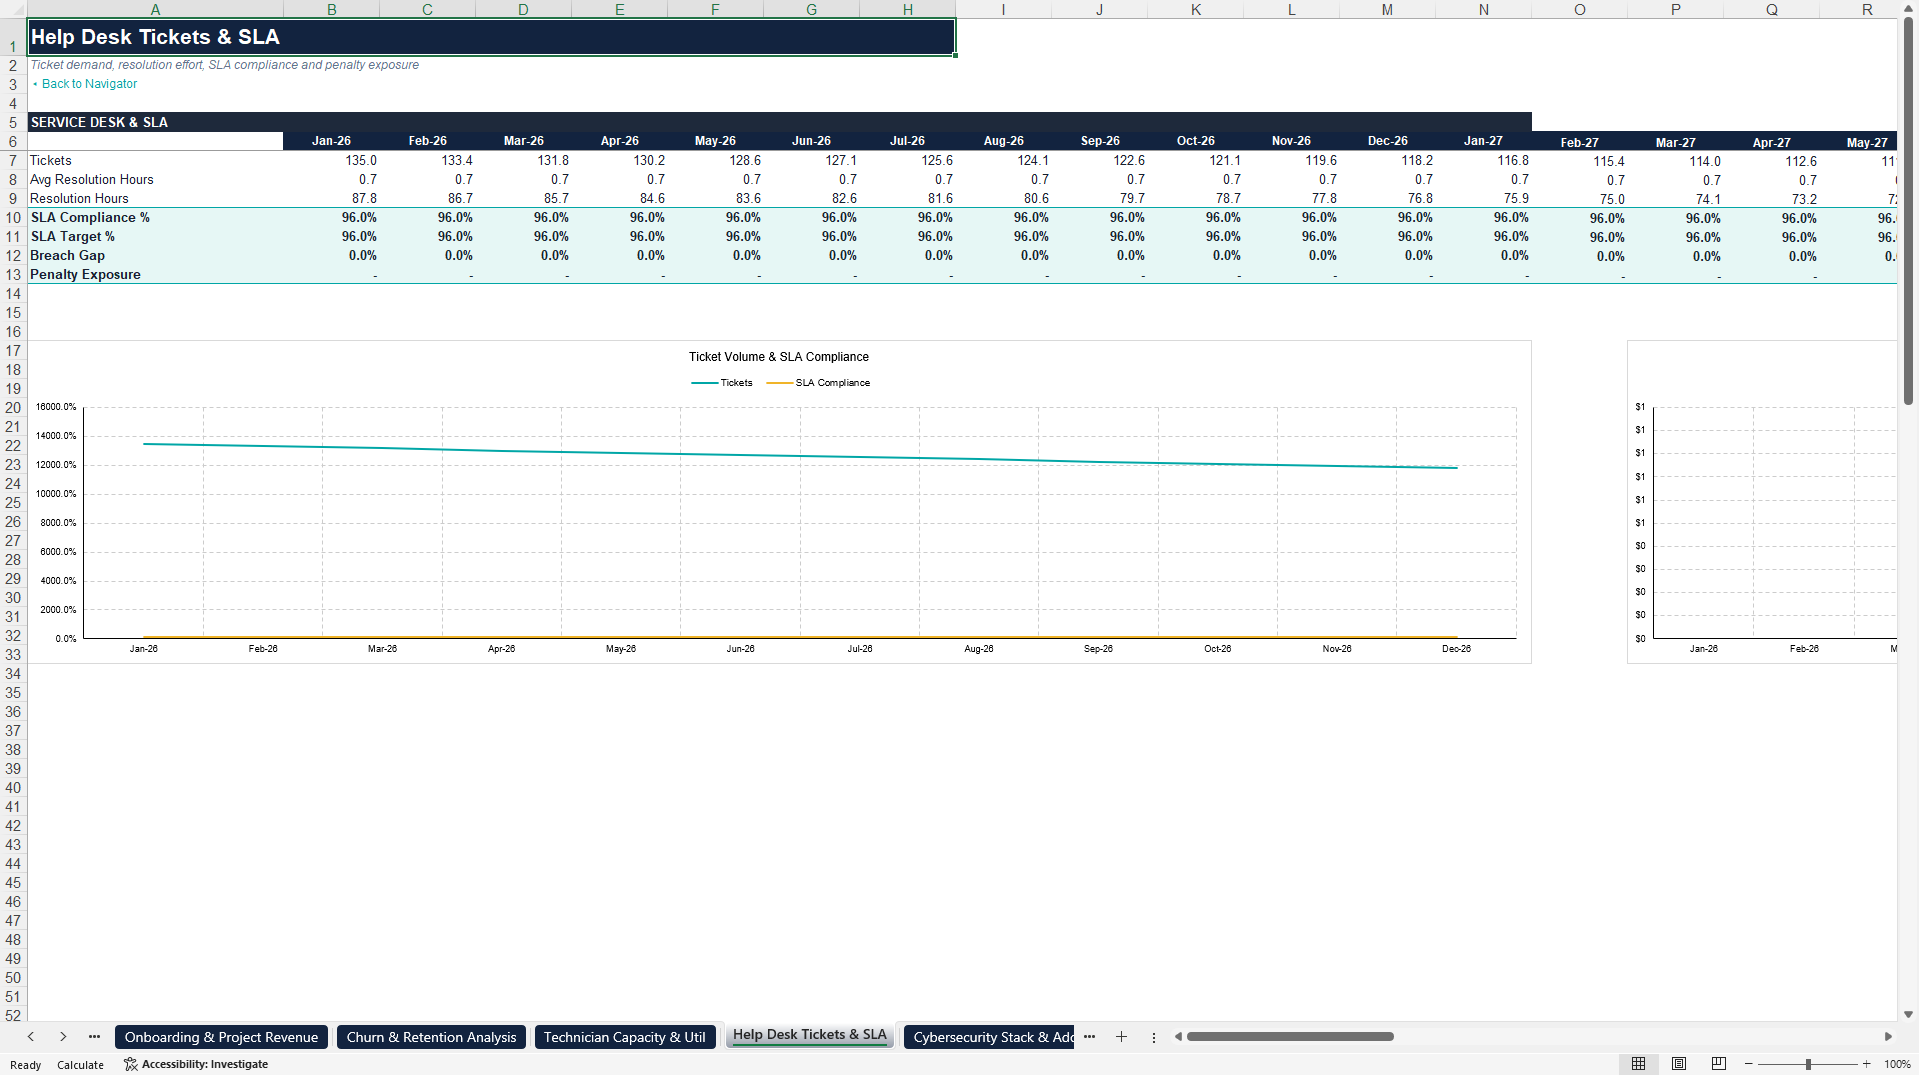
Operational schedules translate the client base into service-delivery requirements. Technician Capacity & Util tracks available hours, demand hours, utilization and headroom. Help Desk Tickets & SLA links tickets, resolution effort, SLA performance and penalty exposure. Churn & Retention Analysis tracks logo churn, revenue churn, net revenue retention, gross revenue retention and cumulative retention.
The cost and profitability section includes tool-stack and cloud COGS, technical payroll, headcount and operating expenses, client-level gross-margin analysis, and client concentration risk. Sales Pipeline & CAC – LTV converts pipeline stages into expected wins and bookings and includes customer-acquisition economics such as CAC, LTV:CAC and payback.
The model includes linked monthly Income Statement, Balance Sheet and Cash Flow Statement schedules. These statements connect revenue, COGS, gross profit, EBITDA, working capital, debt, retained earnings, operating cash flow, investing cash flow, financing cash flow and ending cash.
For transaction and strategic analysis, the Valuation & Acquisition worksheet converts annual outputs into DCF and revenue-multiple cross-checks. It also contains a two-dimensional equity-value sensitivity analysis across discount rates and exit EBITDA multiples. The workbook does not use a separate named scenario switch; scenario-style analysis is performed by changing editable assumptions and following the linked schedules and outputs.
Three dashboards provide management views. The KPI Executive Dashboard summarizes recurring revenue, gross margin, EBITDA, retention, cash and multi-year trends. The Sales & Growth Dashboard focuses on pipeline bookings, CAC, LTV:CAC, payback, MRR growth and logo count. The Technical Operations Dashboard focuses on utilization, SLA compliance, capacity headroom, security revenue and gross margin, ticket volume, and endpoint-to-seat metrics.
Typical uses include building an MSP/MSSP budget, forecasting MRR and ARR, testing pricing tiers, analyzing client profitability, planning technician capacity, evaluating security add-ons and vendor costs, modeling cloud-resale economics, managing churn and retention assumptions, assessing working-capital and cash-flow needs, reviewing sales-funnel economics, monitoring customer concentration, and supporting acquisition or valuation discussions.
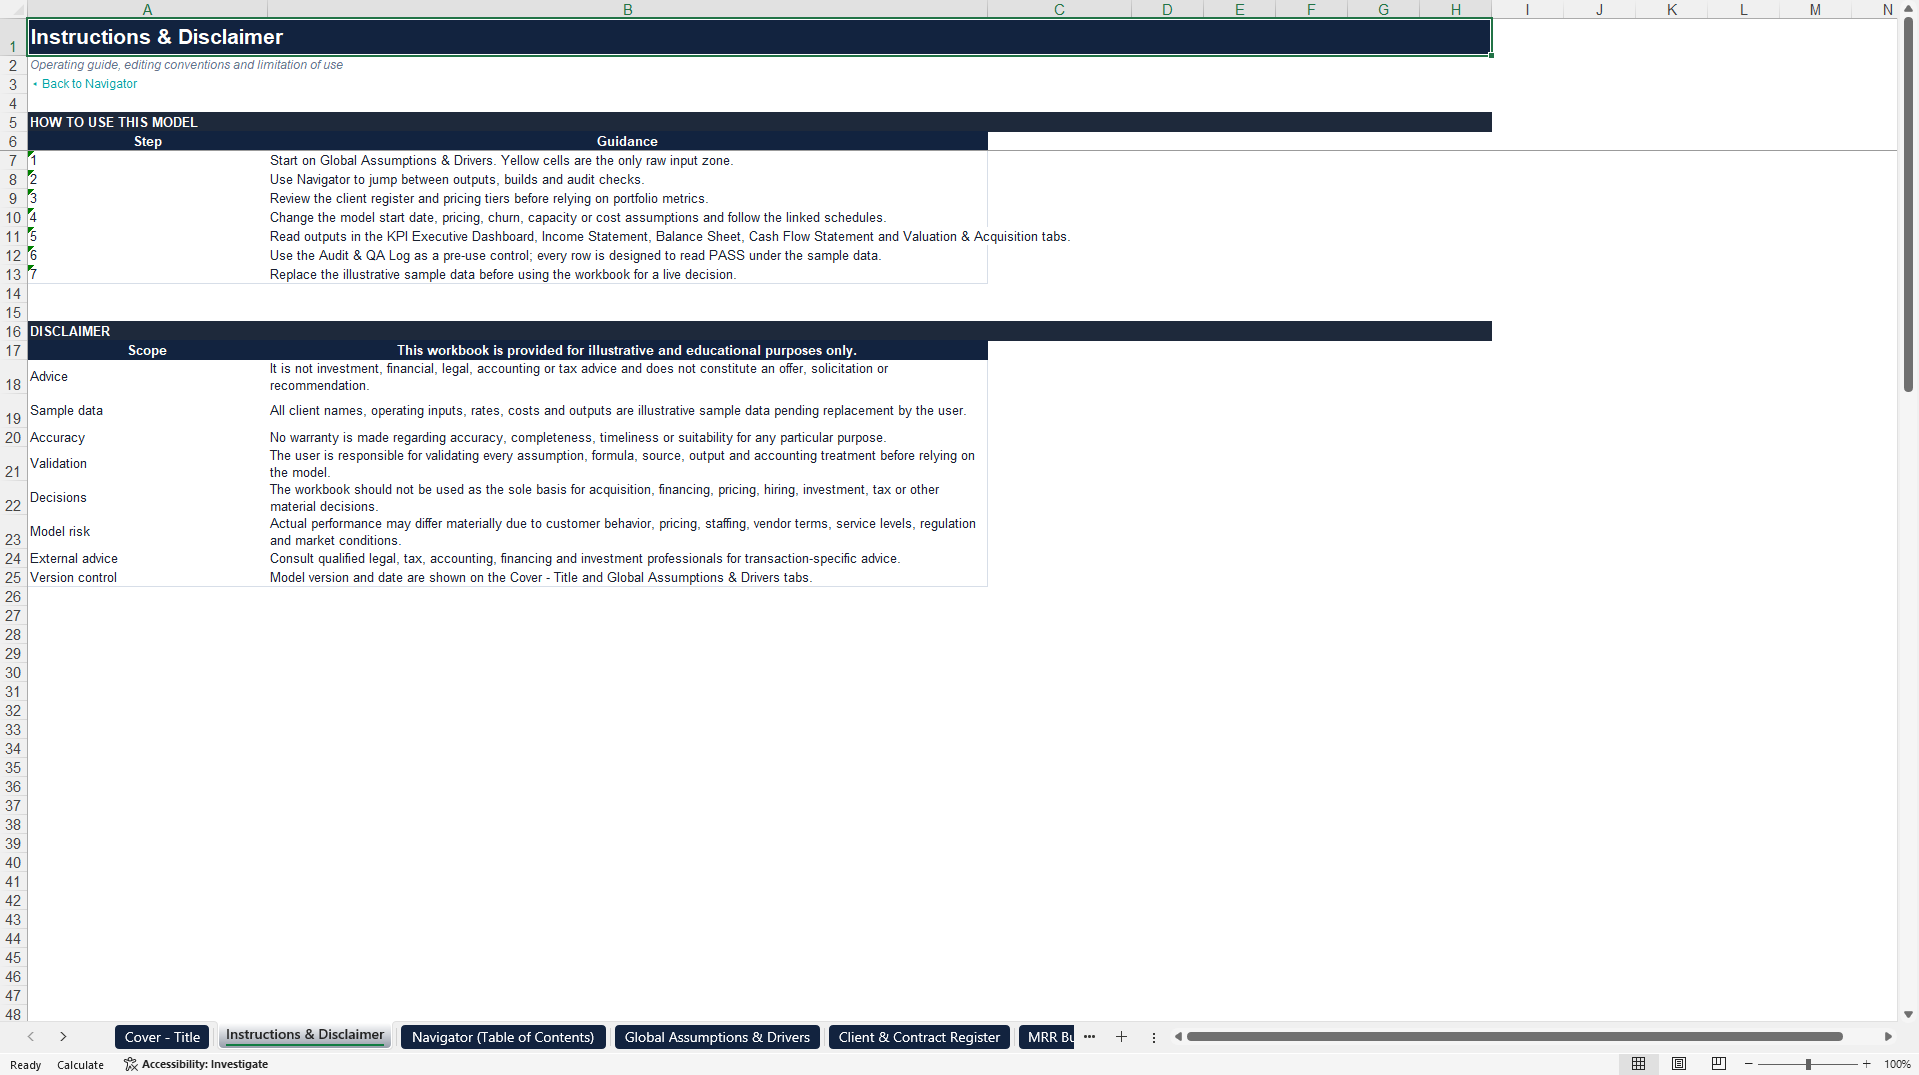
The primary document is the editable 28-sheet Excel workbook. A 28-page full-sheet PDF preview is supplied as the secondary document for marketplace review. The workbook contains illustrative sample data that can be replaced with buyer-specific assumptions.
Got a question about the product? Email us at support@flevy.com or ask the author directly by using the "Ask the Author a Question" form. If you cannot view the preview above this document description, go here to view the large preview instead.
Source: Best Practices in Information Technology, Financial Modeling Excel: MSP / MSSP 60-Month Financial Model & Valuation Excel (XLSX) Spreadsheet, PDMM Financial Models
ABOUT THE AUTHOR

PDMM Financial Models develops professional, decision-ready Excel models for business owners, entrepreneurs, investors, consultants, analysts, and finance teams. Our objective is to transform complex business assumptions into clear, structured analysis that supports better planning and investment decisions.
Our models cover business planning, forecasting, budgeting, feasibility analysis,
... [read more]
Ask the Author a Question
You must be logged in to contact the author.




























