
Manufacturing KPI Excel Dashboard – Excel XLSX
Excel (XLSX)
BENEFITS OF THIS DOWNLOADABLE EXCEL DOCUMENT
- Provides a structured system for tracking production performance, downtime, quality losses, and operational costs in one powerful Excel tool.
- Automatically calculates critical manufacturing KPIs including OEE, availability, performance, quality, and plan achievement to deliver instant operational insights.
- Transforms raw shop-floor production data into a fully dynamic manufacturing dashboard for data-driven decision making and continuous improvement.
KEY PERFORMANCE INDICATORS EXCEL DESCRIPTION
Curated by McKinsey-trained Executives
🚀 Manufacturing KPI Excel Dashboard
The Ultimate Production Performance & OEE Tracking System for Manufacturers
Stop guessing. Start optimizing.
If you're running a production line without clear, real-time performance insights, you're leaving money, efficiency, and productivity on the table every single shift.
The Manufacturing KPI Excel Dashboard is a powerful, advanced Excel performance management system designed specifically for manufacturing teams, production managers, plant supervisors, and operations leaders who want complete control over their production performance, OEE, downtime, quality losses, and operational costs.
This isn't just a spreadsheet.
It's a complete manufacturing analytics system built in Excel.
📊 Turn Raw Production Data Into Powerful Manufacturing Intelligence
With this fully automated and dynamic Excel dashboard, you can instantly transform daily shop-floor data into clear, actionable KPIs that reveal exactly where your production is winning – and where it's bleeding money.
Simply enter your daily production data and watch the dashboard automatically calculate critical manufacturing KPIs including OEE, performance, availability, quality, downtime losses, labor efficiency, and cost impacts.
No complex software.
No expensive ERP modules.
Just pure manufacturing insight inside Excel.
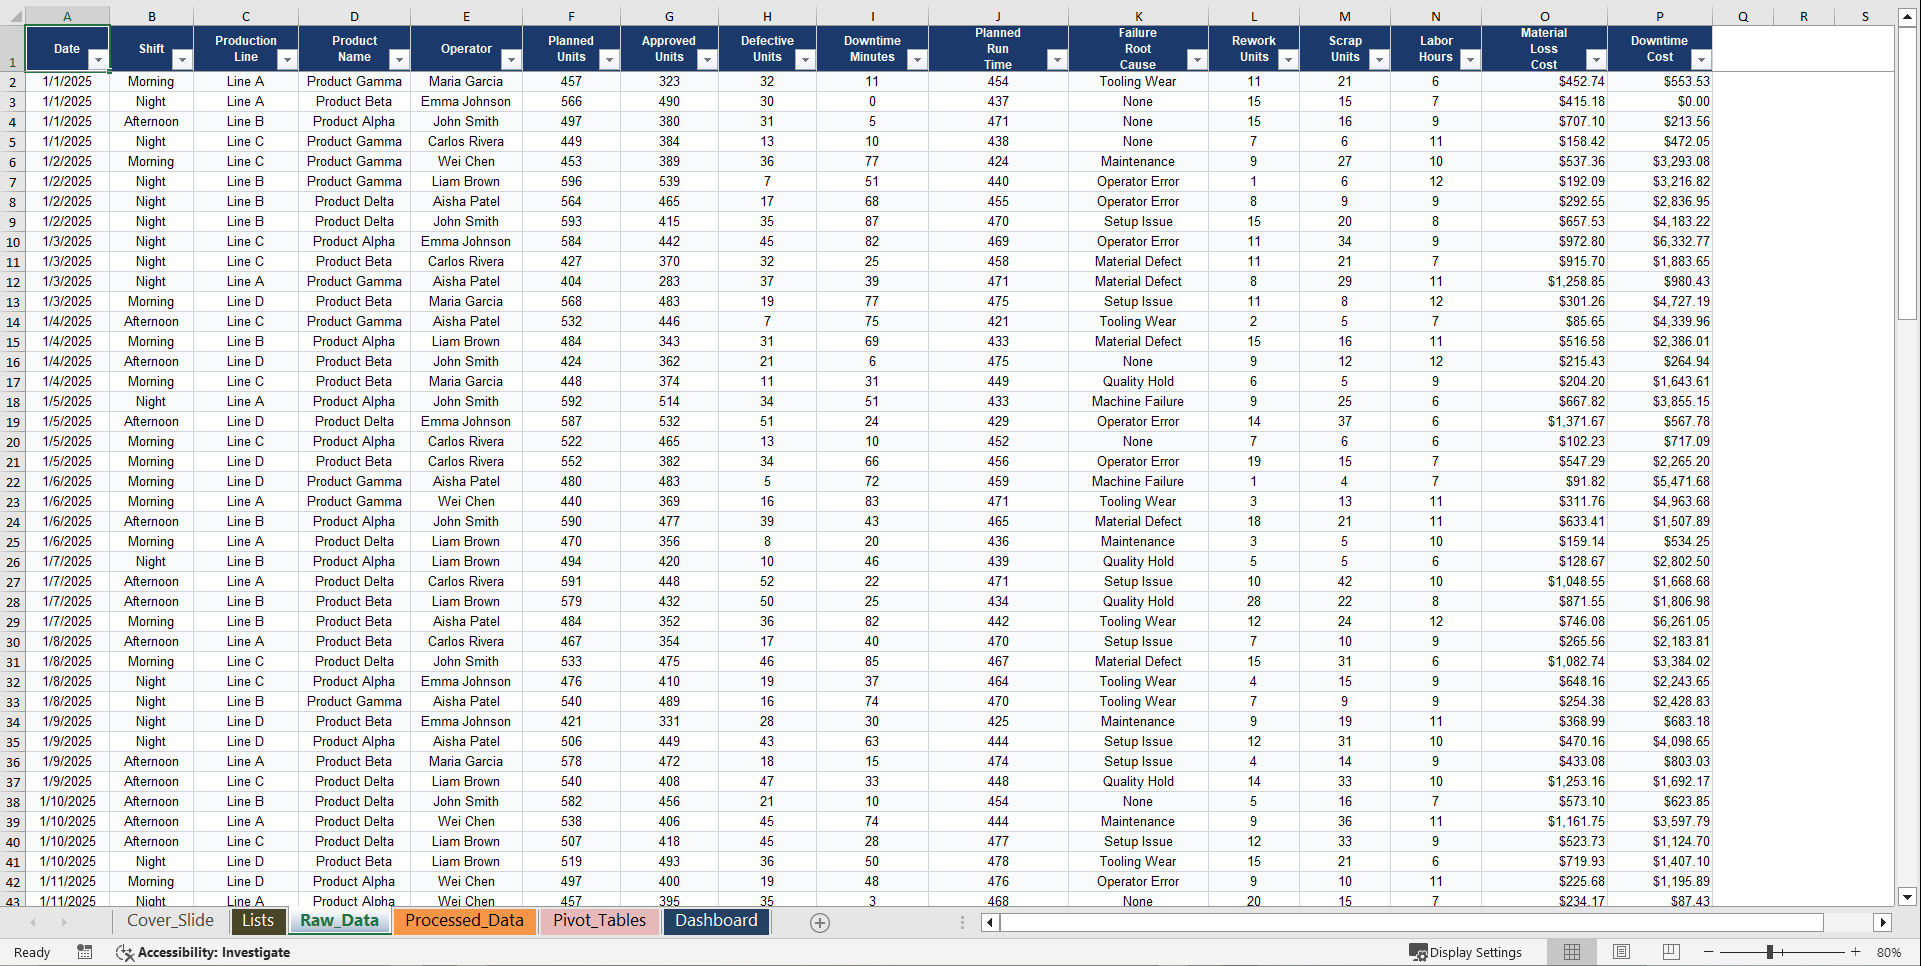
🏭 Comprehensive Production Data Tracking
The dashboard captures every critical variable needed to analyze manufacturing performance:
Production Data Inputs
Track detailed operational data including:
• Date
• Shift
• Production Line
• Product Name
• Operator
• Planned Units
• Approved Units
• Defective Units
• Rework Units
• Scrap Units
Operational Efficiency Metrics
Monitor operational factors that impact productivity:
• Planned Run Time (Minutes)
• Downtime Minutes
• Failure Root Cause
• Labor Hours
Financial Loss Tracking
Understand the true cost of inefficiency:
• Material Loss Cost
• Downtime Cost
This gives management full visibility into both operational and financial performance.
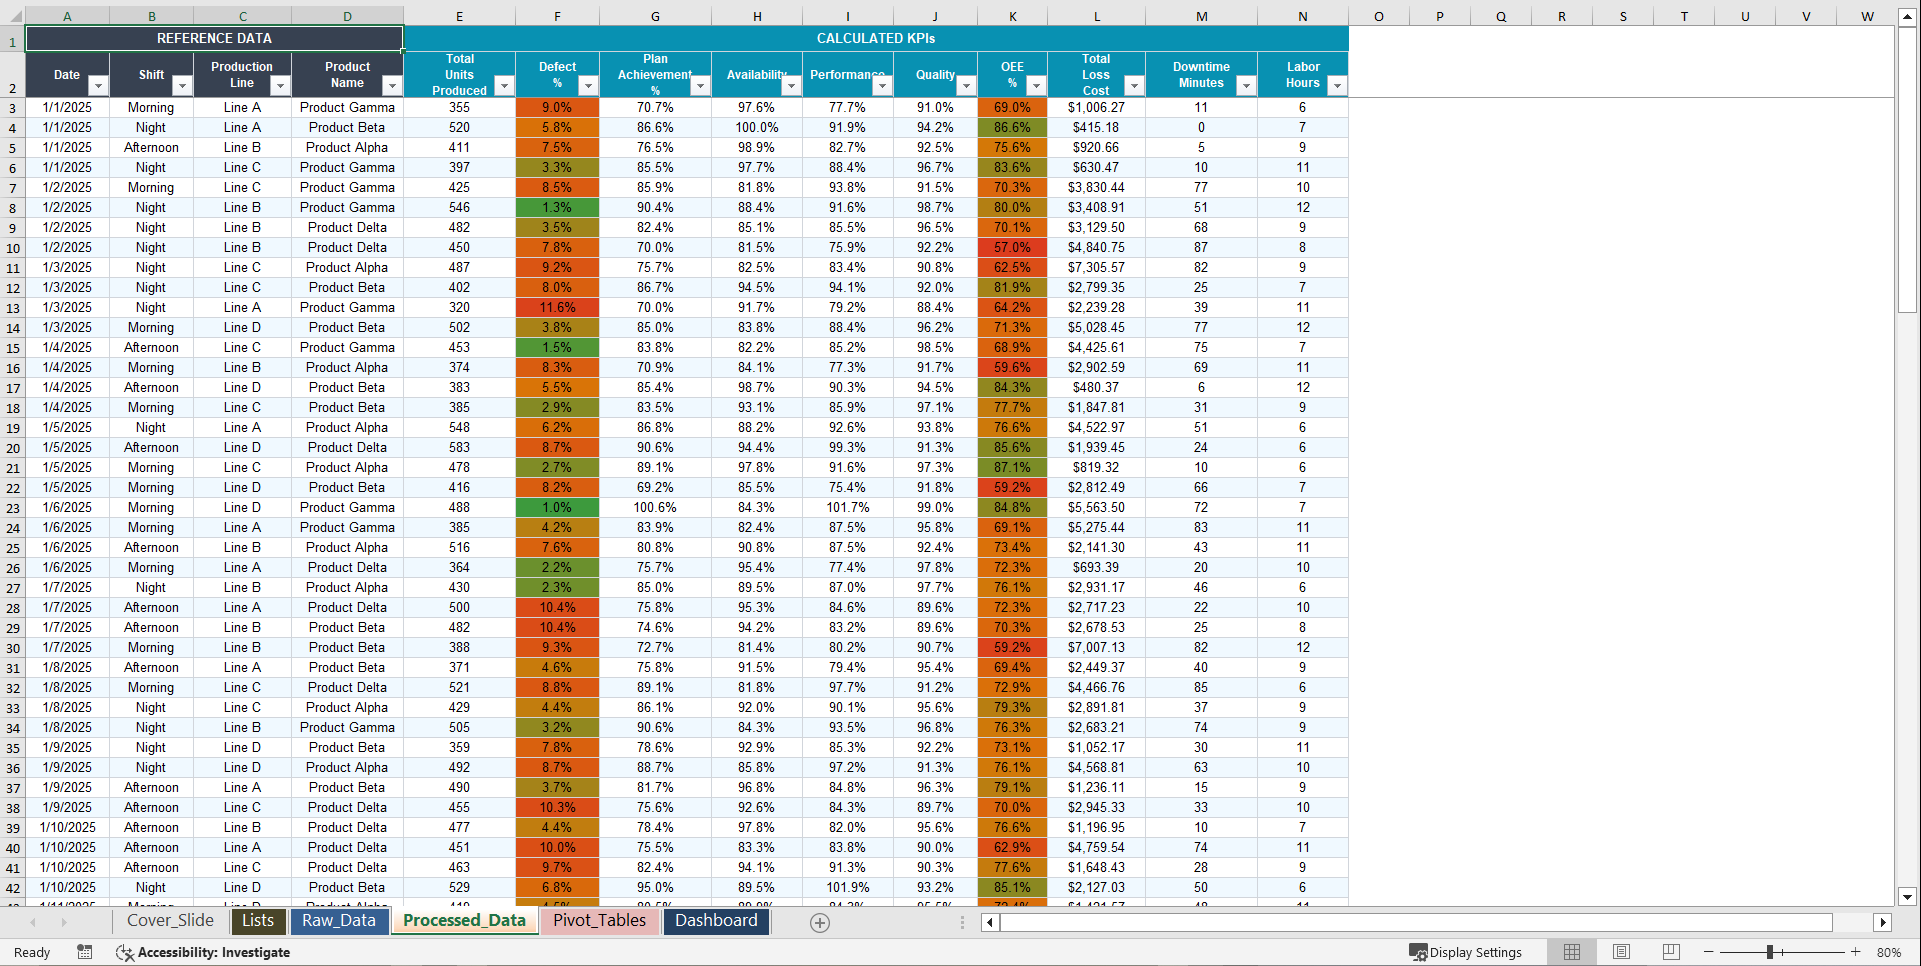
📈 Automatically Calculated Manufacturing KPIs
Once production data is entered, the system automatically calculates advanced manufacturing performance indicators, including:
Core Production KPIs
• Total Units Produced
• Defect Percentage (%)
• Production Plan Achievement (%)
OEE Performance Metrics
• Availability
• Performance
• Quality
• Overall Equipment Effectiveness (OEE %)
Operational Cost Metrics
• Total Loss Cost
• Total Downtime Minutes
• Total Labor Hours
These KPIs provide real-time operational visibility for smarter production decisions.
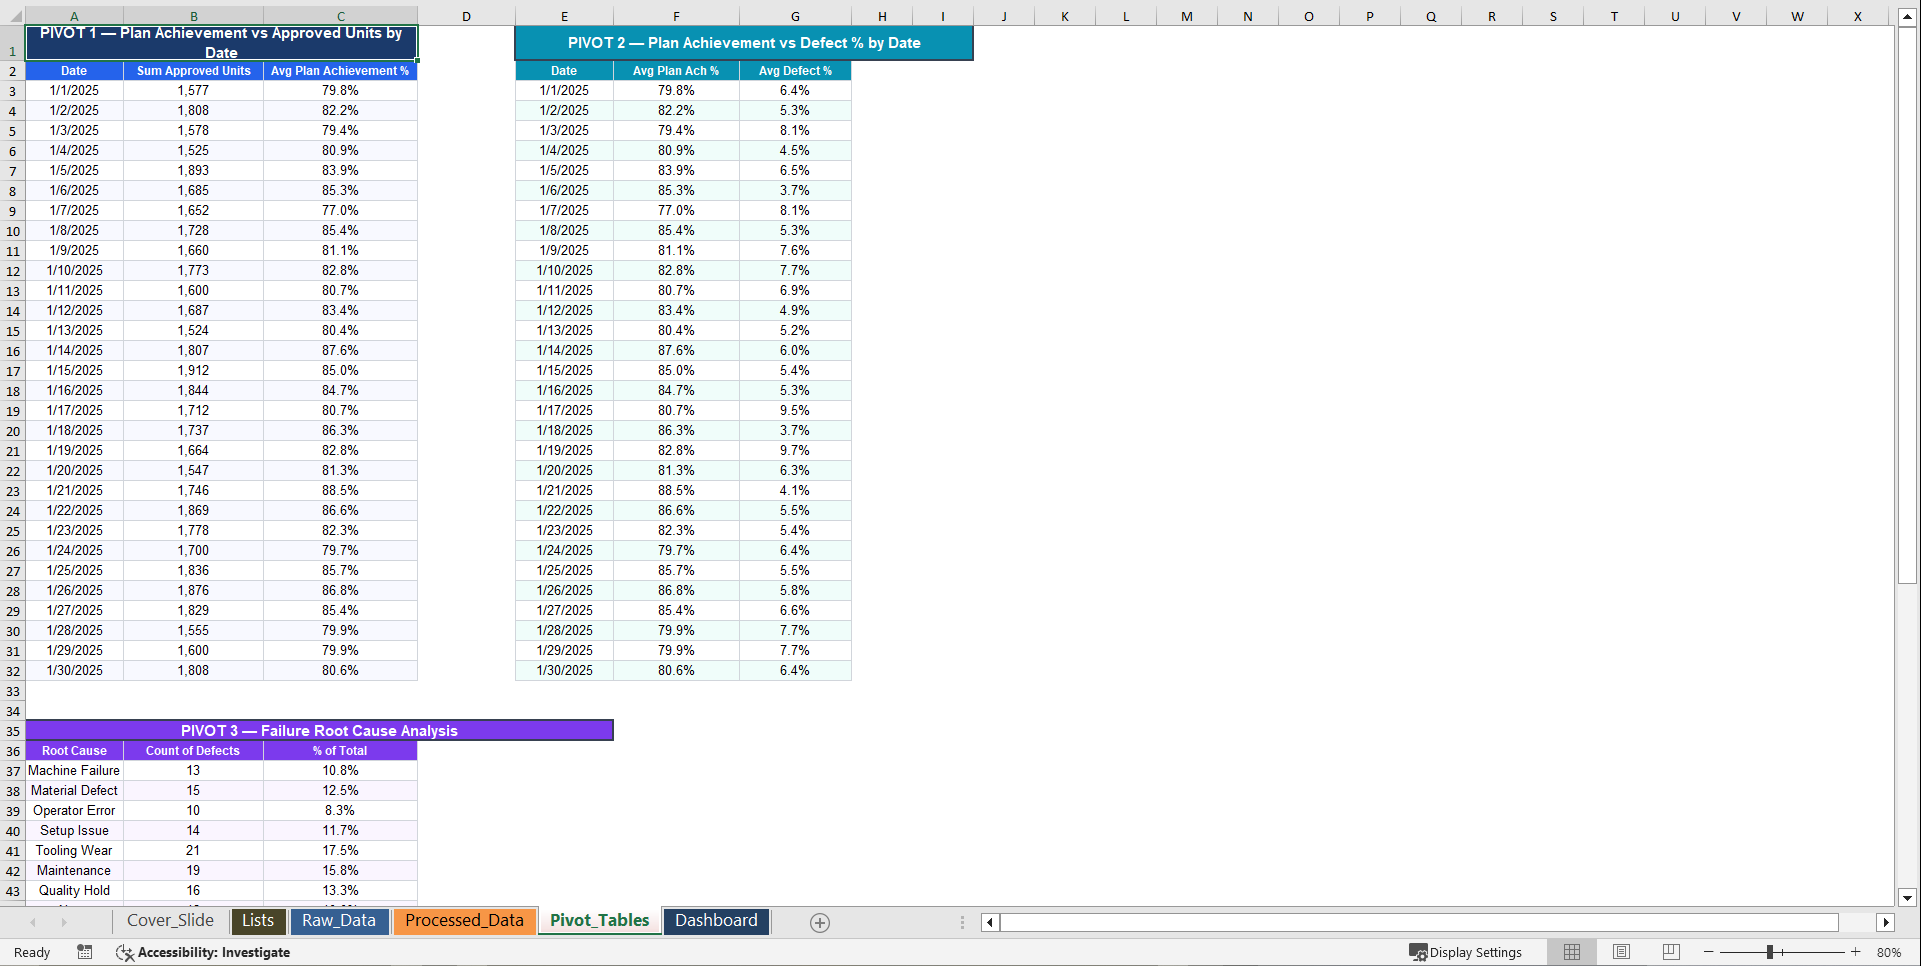
📊 Fully Dynamic Manufacturing Dashboard
At the heart of the tool is a visually powerful, fully dynamic Excel dashboard designed for instant production insights.
The dashboard automatically updates to display:
✔ OEE performance trends
✔ Production output by line
✔ Defect and quality analysis
✔ Downtime tracking
✔ Cost loss analysis
✔ Labor utilization insights
✔ Plan vs actual performance
Everything updates instantly with your data.
Your management team can identify production bottlenecks within seconds.
⚡ Why Manufacturers Love This Dashboard
💡 Instant Operational Visibility
See exactly what's happening on your production floor at any time.
📉 Identify Hidden Production Losses
Quickly uncover downtime causes, scrap issues, and inefficiencies.
📊 Track OEE Like a Pro
Monitor Availability, Performance, and Quality automatically.
💰 Quantify the Cost of Downtime
Turn operational problems into clear financial numbers management understands.
🔄 Fully Automated Calculations
No manual KPI calculations.
Everything is automatically generated.
📈 Data-Driven Production Decisions
Empower managers with real manufacturing intelligence.
🧠 Perfect For
This Manufacturing KPI Dashboard is ideal for:
• Manufacturing Managers
• Production Supervisors
• Operations Managers
• Industrial Engineers
• Continuous Improvement Teams
• Lean Manufacturing Specialists
• Plant Managers
• Small & Medium Manufacturing Companies
🛠 Built 100% in Excel – No Software Required
Unlike expensive manufacturing systems, this tool works directly in Microsoft Excel, meaning:
✔ No installation
✔ No subscriptions
✔ No IT integration required
✔ Works instantly
Just open the file and start tracking your manufacturing performance immediately.
📦 What You Get
When you download the Manufacturing KPI Excel Dashboard, you receive:
✔ Advanced Excel KPI Tracking System
✔ Automated OEE Calculations
✔ Production Data Entry System
✔ Reference Data Structure
✔ Fully Dynamic Visual Dashboard
✔ Cost Loss Tracking
✔ Production Performance Analytics
Everything is pre-built, automated, and ready to use.
🚀 Transform Your Production Performance Today
The difference between average factories and high-performing operations is data visibility.
With the Manufacturing KPI Excel Dashboard, you can:
✔ Reduce downtime
✔ Improve product quality
✔ Increase production output
✔ Track labor efficiency
✔ Identify root causes of failures
✔ Maximize OEE performance
✔ Reduce operational losses
All inside one powerful Excel system.
📥 Download the Manufacturing KPI Excel Dashboard Now
Start making data-driven manufacturing decisions today.
Gain complete visibility into your production performance, efficiency, and operational costs – and unlock the true potential of your manufacturing operations.
Download now and take control of your production floor.
Key Words:
Strategy & Transformation, Growth Strategy, Strategic Planning, Strategy Frameworks, Innovation Management, Pricing Strategy, Core Competencies, Strategy Development, Business Transformation, Marketing Plan Development, Product Strategy, Breakout Strategy, Competitive Advantage, Mission, Vision, Values, Strategy Deployment & Execution, Innovation, Vision Statement, Core Competencies Analysis, Corporate Strategy, Product Launch Strategy, BMI, Blue Ocean Strategy, Breakthrough Strategy, Business Model Innovation, Business Strategy Example, Corporate Transformation, Critical Success Factors, Customer Segmentation, Customer Value Proposition, Distinctive Capabilities, Enterprise Performance Management, KPI, Key Performance Indicators, Market Analysis, Market Entry Example, Market Entry Plan, Market Intelligence, Market Research, Market Segmentation, Market Sizing, Marketing, Michael Porter's Value Chain, Organizational Transformation, Performance Management, Performance Measurement, Platform Strategy, Product Go-to-Market Strategy, Reorganization, Restructuring, SWOT, SWOT Analysis, Service 4.0, Service Strategy, Service Transformation, Strategic Analysis, Strategic Plan Example, Strategy Deployment, Strategy Execution, Strategy Frameworks Compilation, Strategy Methodologies, Strategy Report Example, Value Chain, Value Chain Analysis, Value Innovation, Value Proposition, Vision Statement, Corporate Strategy, Business Development, Business plan pdf, business plan, PDF, Business Plan DOC, Business Plan Template, PPT, Market strategy playbook, strategic market planning, competitive analysis tools, market segmentation frameworks, growth strategy templates, product positioning strategy, market execution toolkit, strategic alignment playbook, KPI and OKR frameworks, business growth strategy guide, cross-functional strategy templates, market risk management, market strategy PowerPoint doc, guide, ebook, e-book ,McKinsey Change Playbook, Organizational change management toolkit, Change management frameworks 2025, Influence model for change, Change leadership strategies, Behavioral change in organizations, Change management PowerPoint templates, Transformational leadership in change, supply chain KPIs, supply chain KPI toolkit, supply chain PowerPoint template, logistics KPIs, procurement KPIs, inventory management KPIs, supply chain performance metrics, manufacturing KPIs, supply chain dashboard, supply chain strategy KPIs, reverse logistics KPIs, sustainability KPIs in supply chain, financial supply chain KPIs, warehouse KPIs, digital supply chain KPIs, 1200 KPIs, supply chain scorecard, KPI examples, supply chain templates, Corporate Finance SOPs, Finance SOP Excel Template, CFO Toolkit, Finance Department Procedures, Financial Planning SOPs, Treasury SOPs, Accounts Payable SOPs, Accounts Receivable SOPs, General Ledger SOPs, Accounting Policies Template, Internal Controls SOPs, Finance Process Standardization, Finance Operating Procedures, Finance Department Excel Template, FP&A Process Documentation, Corporate Finance Template, Finance SOP Toolkit, CFO Process Templates, Accounting SOP Package, Tax Compliance SOPs, Financial Risk Management Procedures.
NOTE: Our digital products are sold on an "as is" basis, making returns and refunds unavailable post-download. Please preview and inquire before purchasing. Please contact us before purchasing if you have any questions! This policy aligns with the standard Flevy Terms of Usage.
Got a question about the product? Email us at support@flevy.com or ask the author directly by using the "Ask the Author a Question" form. If you cannot view the preview above this document description, go here to view the large preview instead.
Source: Best Practices in Key Performance Indicators Excel: Manufacturing KPI Excel Dashboard Excel (XLSX) Spreadsheet, SB Consulting
ABOUT THE AUTHOR
SB Consulting is dedicated to empowering businesses to communicate their ideas with impact. This consulting firm specializes in teaching organizations how to create effective corporate and management presentations. With training from top-tier global consulting firms, including McKinsey, BCG, and Porsche Consulting, extensive expertise in presentation design and ... [read more]
Ask the Author a Question
You must be logged in to contact the author.
