 Click main image to view in full screen.
Integrated Budget vs Actual (BvA) Variance Analysis – Excel XLSX
Excel (XLSX)


BENEFITS OF THIS DOWNLOADABLE EXCEL DOCUMENT
- Fully integrated live formulas calculate Budget vs Actual variances and material flags across financial statements and KPIs.
- Fortune 500-standard structure enables fast monthly or quarterly reporting by updating only yellow actual input cells.
- Pre-populated illustrative data and commentary placeholders make this variance analysis template ready for immediate use.
BUDGETING & FORECASTING EXCEL DESCRIPTION
Apex Global Industries Inc. Integrated Budget vs Actual (BvA) Variance Analysis | Professional Excel Template
Download a fully integrated Budget vs Actual variance analysis Excel template built to Fortune 500 standards. This professional BvA model includes live formulas, illustrative data, automatic variance calculations, and material variance flagging for immediate management reporting and FP&A use.
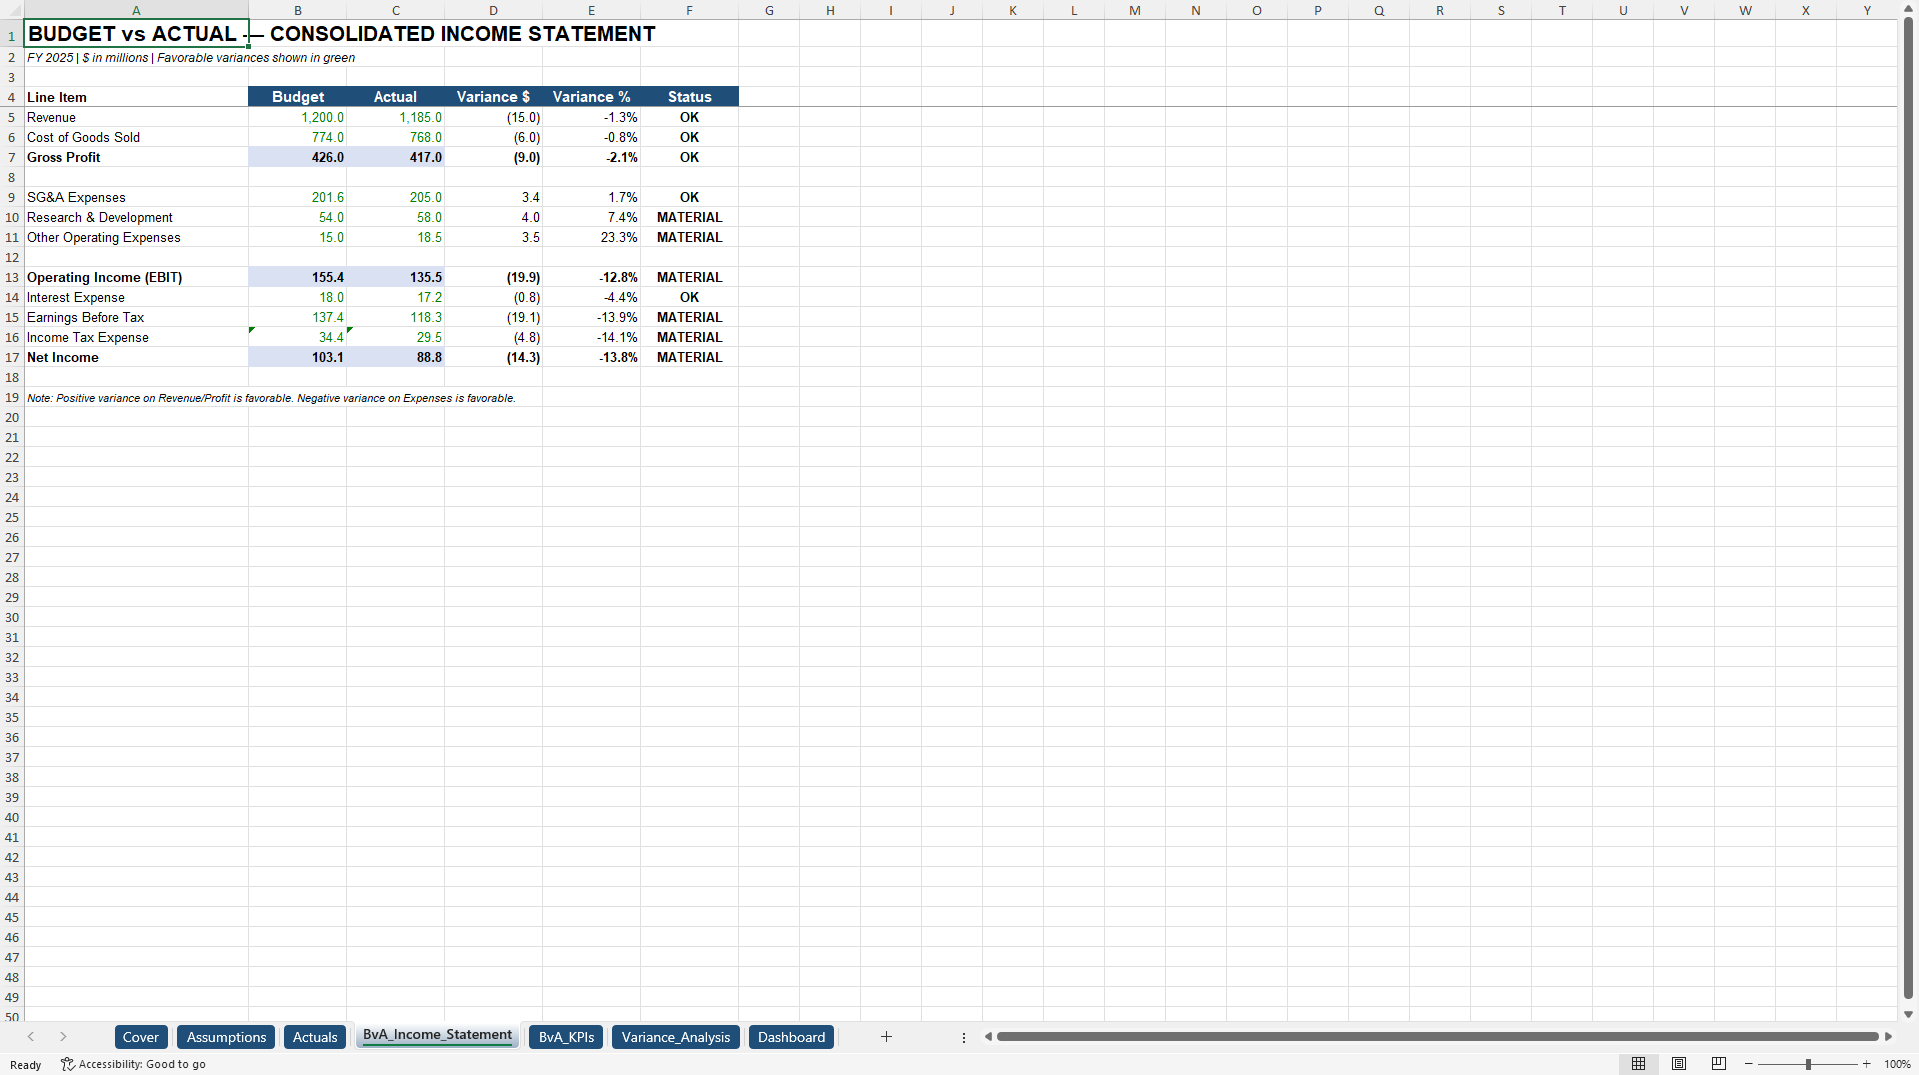
This institutional-quality Budget vs Actual analysis model provides a complete, dynamic view of Apex Global Industries Inc.'s financial and operational performance against plan. Designed for CFOs, FP&A teams, controllers, department heads, and management reporting professionals, the workbook seamlessly links budget assumptions, actual results, variance dollars, variance percentages, and status flags across the Income Statement and key performance indicators.
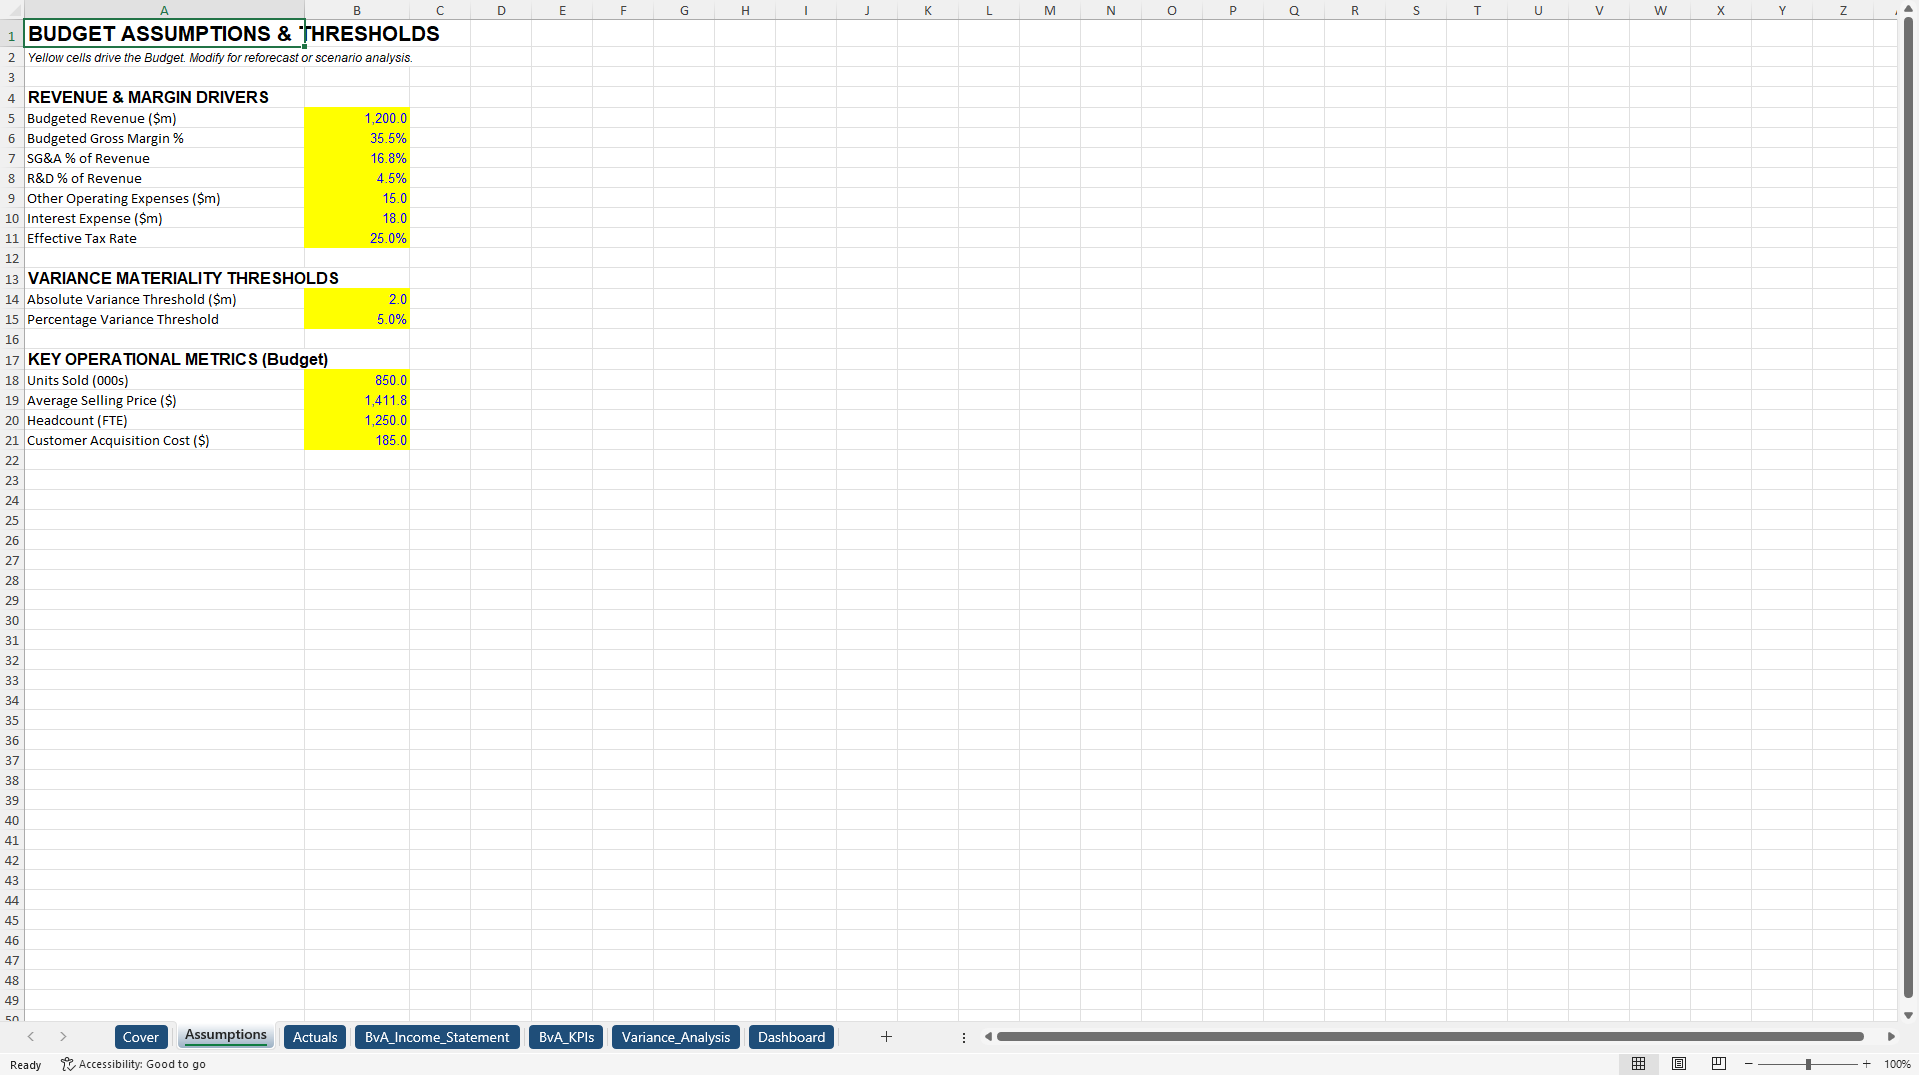
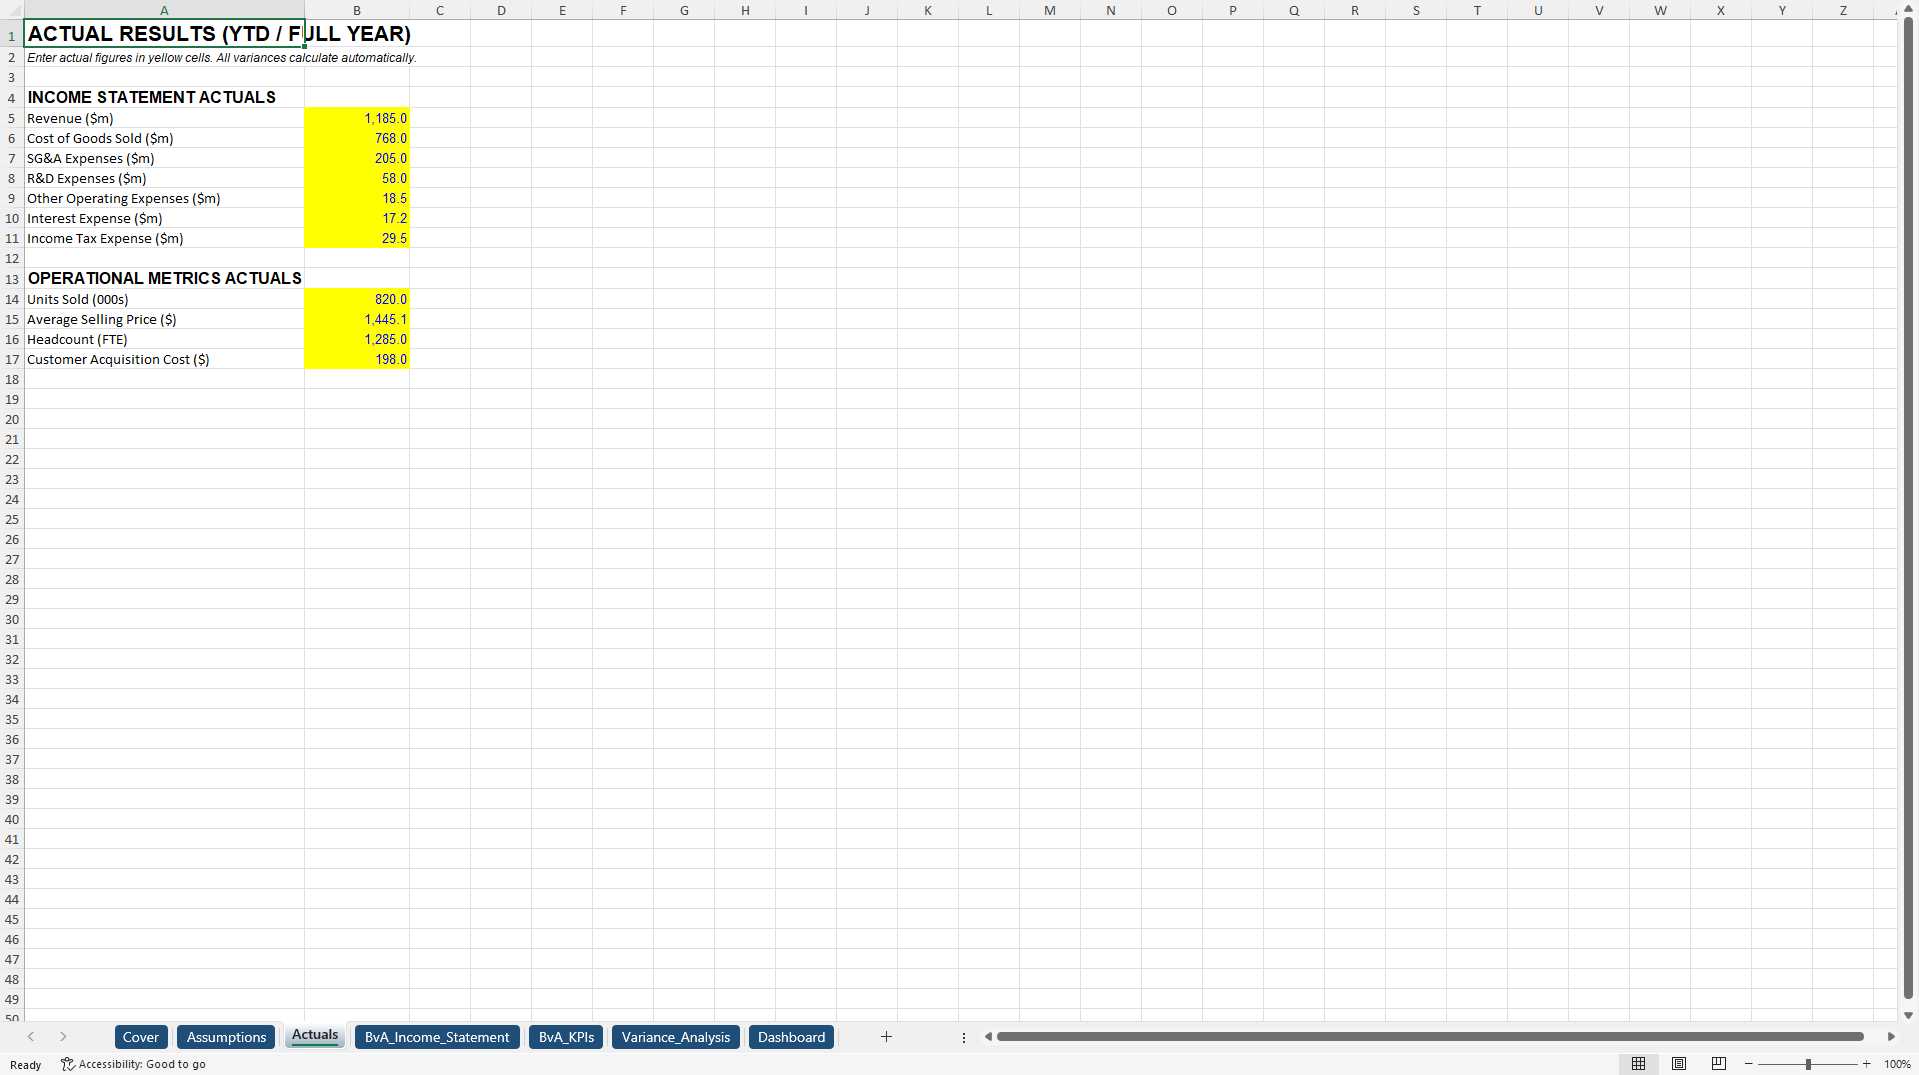
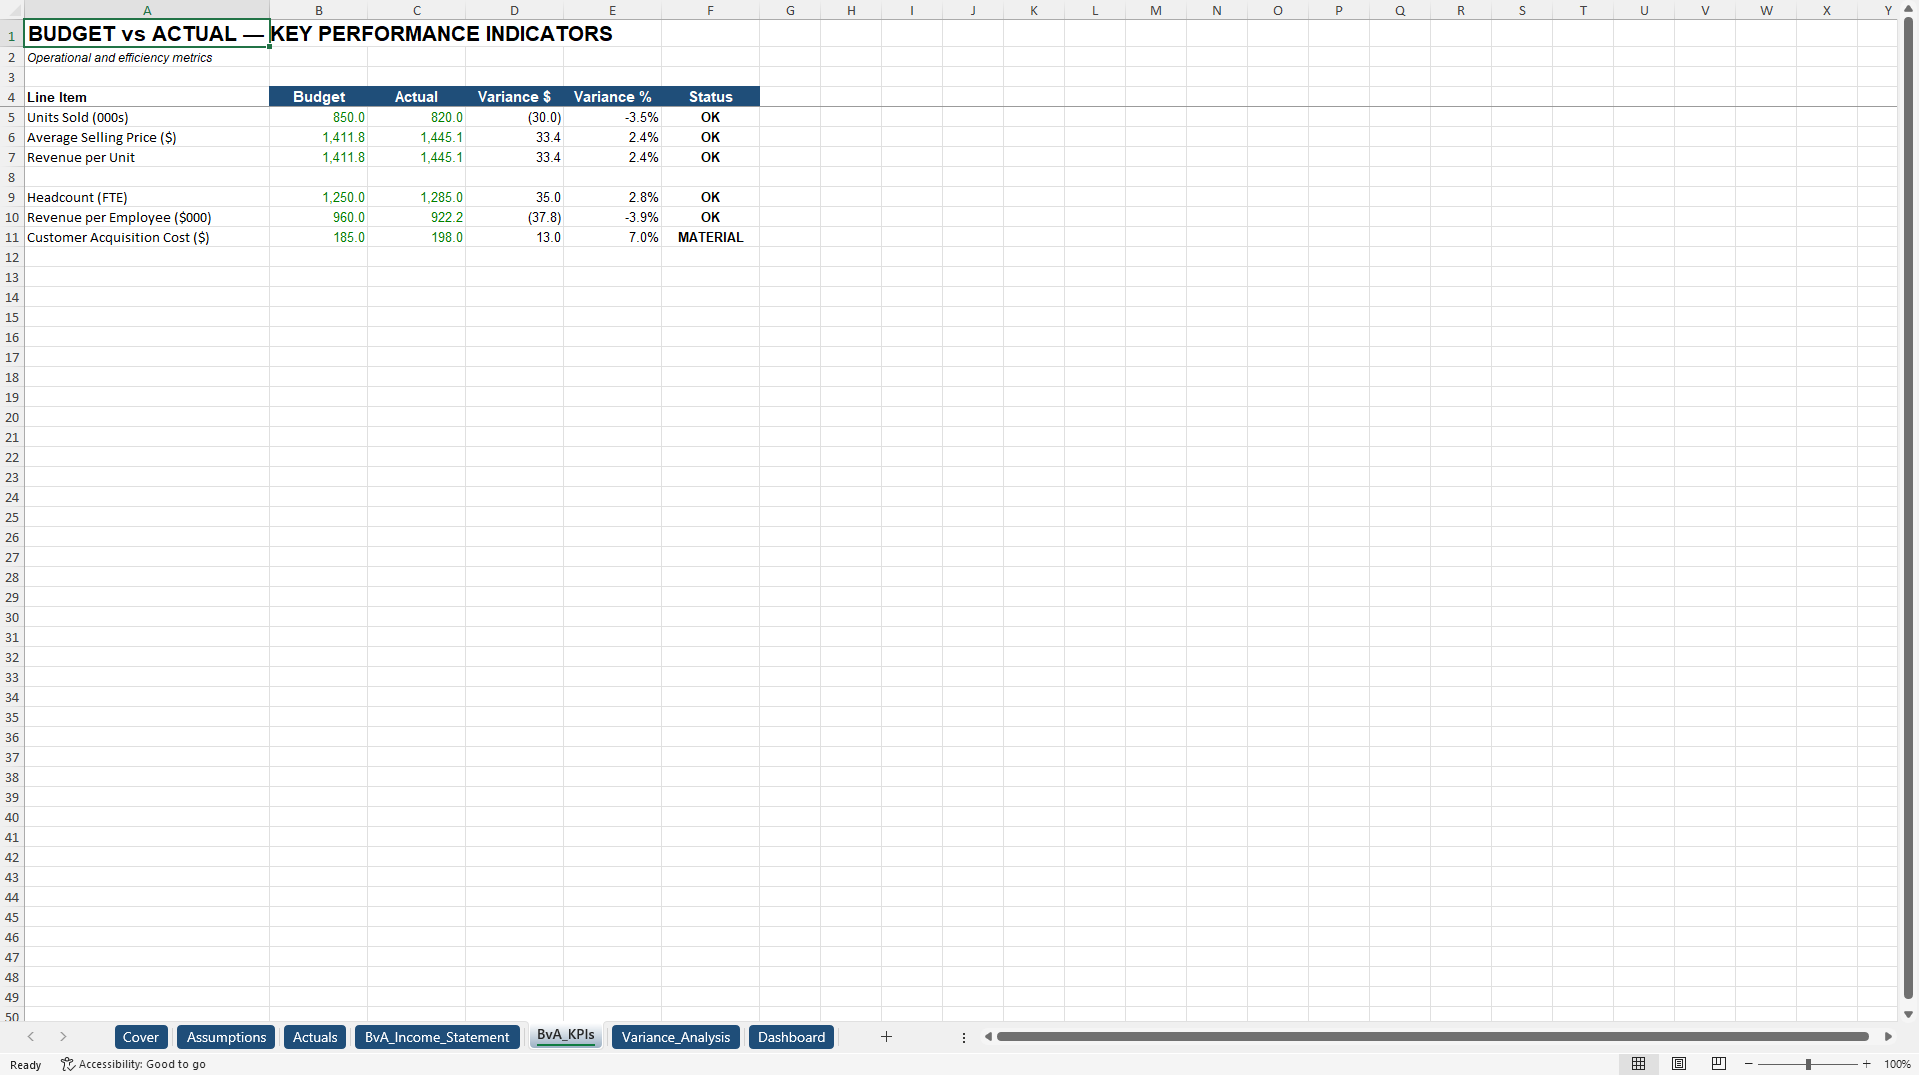
Budget figures are driven from a dedicated Assumptions tab containing revenue targets, margin rates, expense ratios, and materiality thresholds. Actual results are entered in yellow input cells on the Actuals tab. Every variance, percentage change, and material flag updates automatically through live formulas. The model clearly distinguishes favorable and unfavorable variances and highlights items that exceed both absolute dollar and percentage thresholds for focused management review.
Three Key Benefits
1. Fully integrated live formulas calculate Budget vs Actual variances and material flags across financial statements and KPIs.
2. Fortune 500-standard structure enables fast monthly or quarterly reporting by updating only yellow actual input cells.
3. Pre-populated illustrative data and commentary placeholders make this variance analysis template ready for immediate use.
*How to Use This BvA Variance Analysis Model*
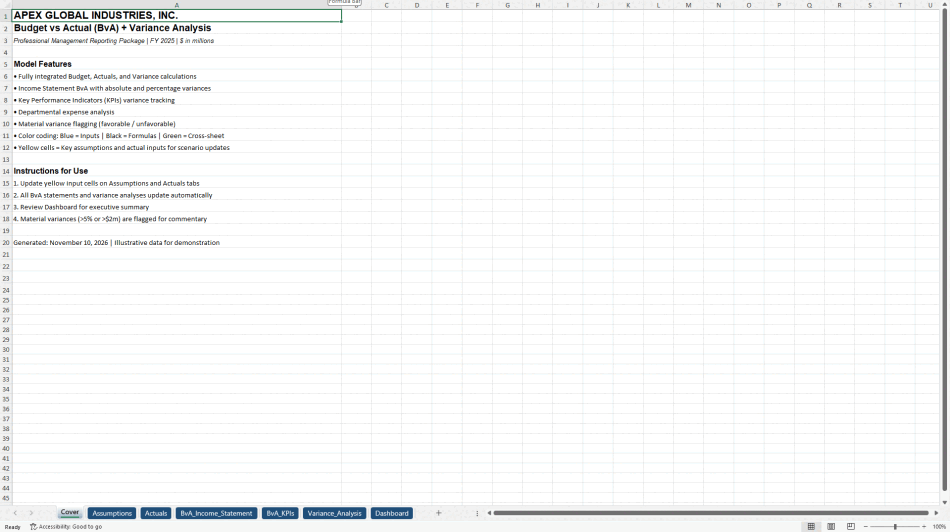
Open the Cover sheet for an overview, then navigate to the Assumptions tab to set or adjust budget drivers and materiality thresholds. Enter year-to-date or full-year actual results in the yellow cells on the Actuals tab. All Budget vs Actual calculations on the Income Statement and KPI sheets update instantly, including variance dollars, variance percentages, and status indicators (MATERIAL or OK).
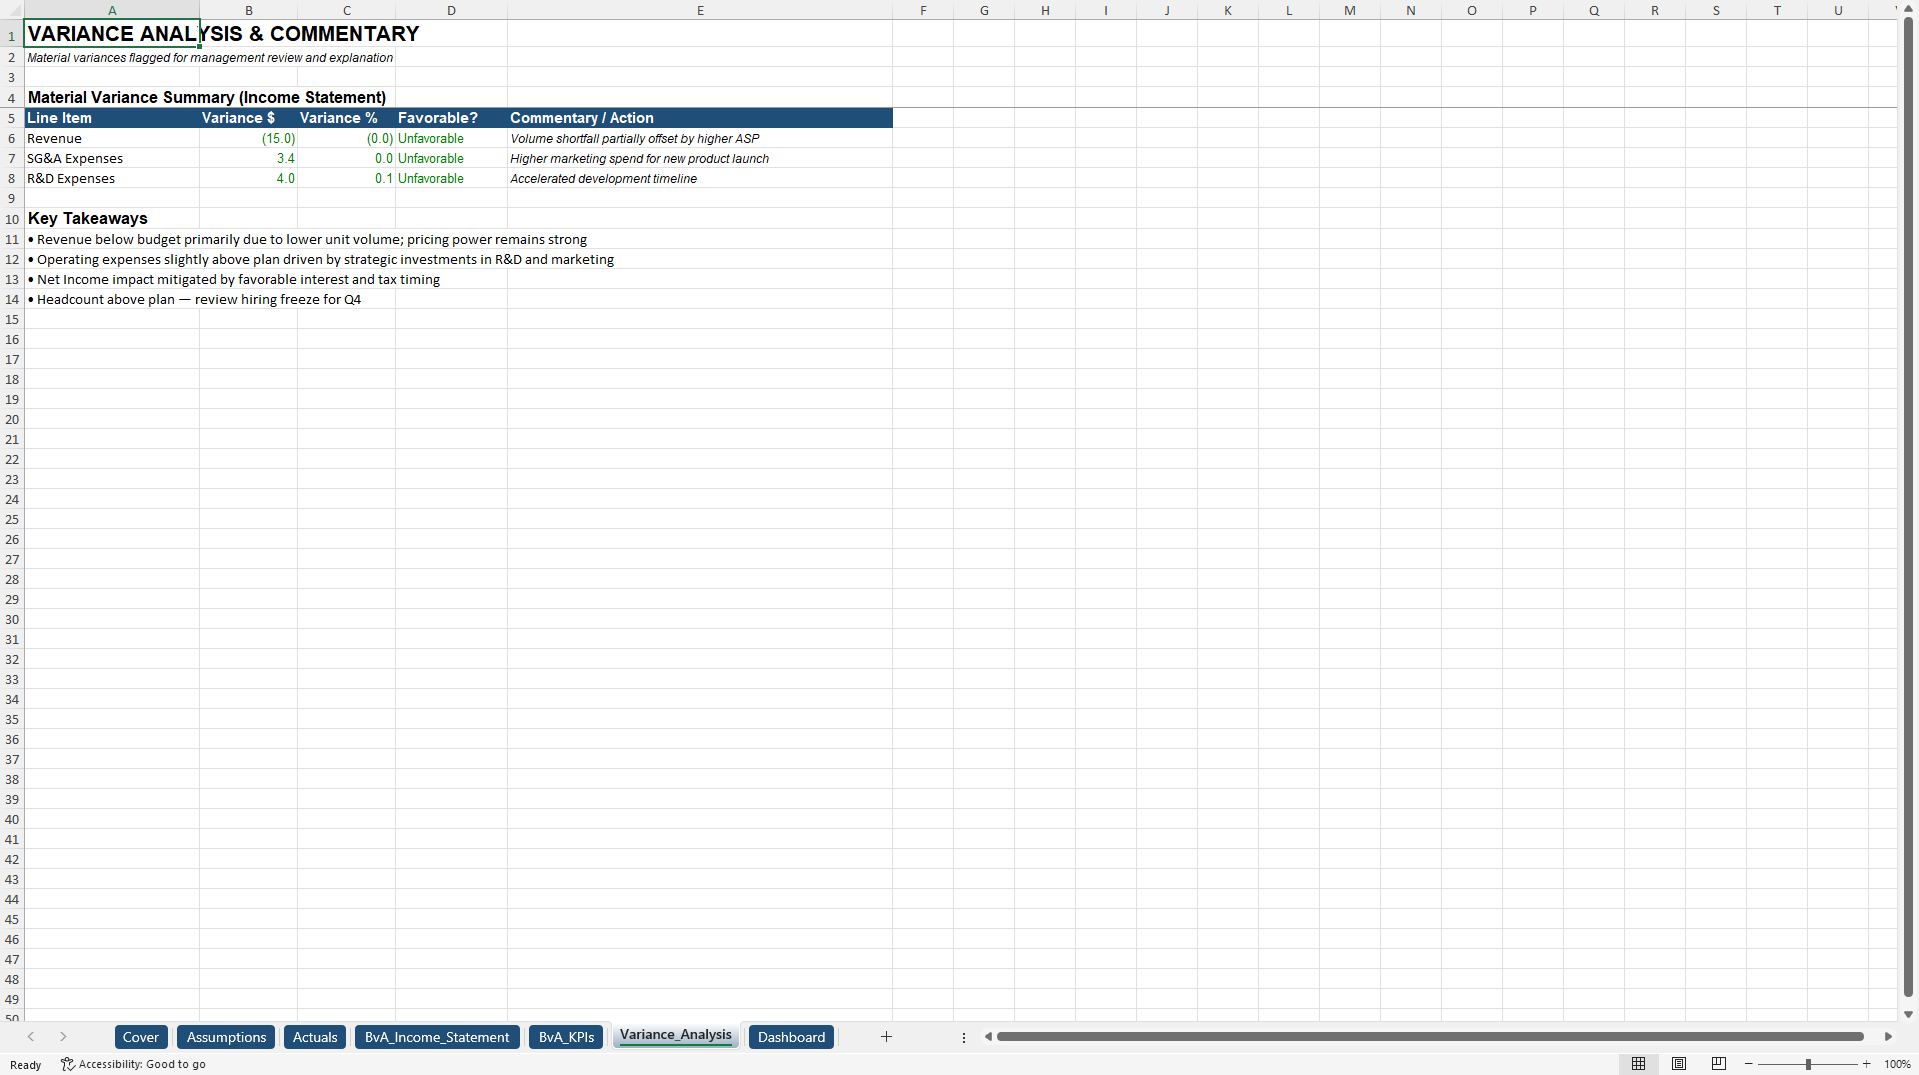
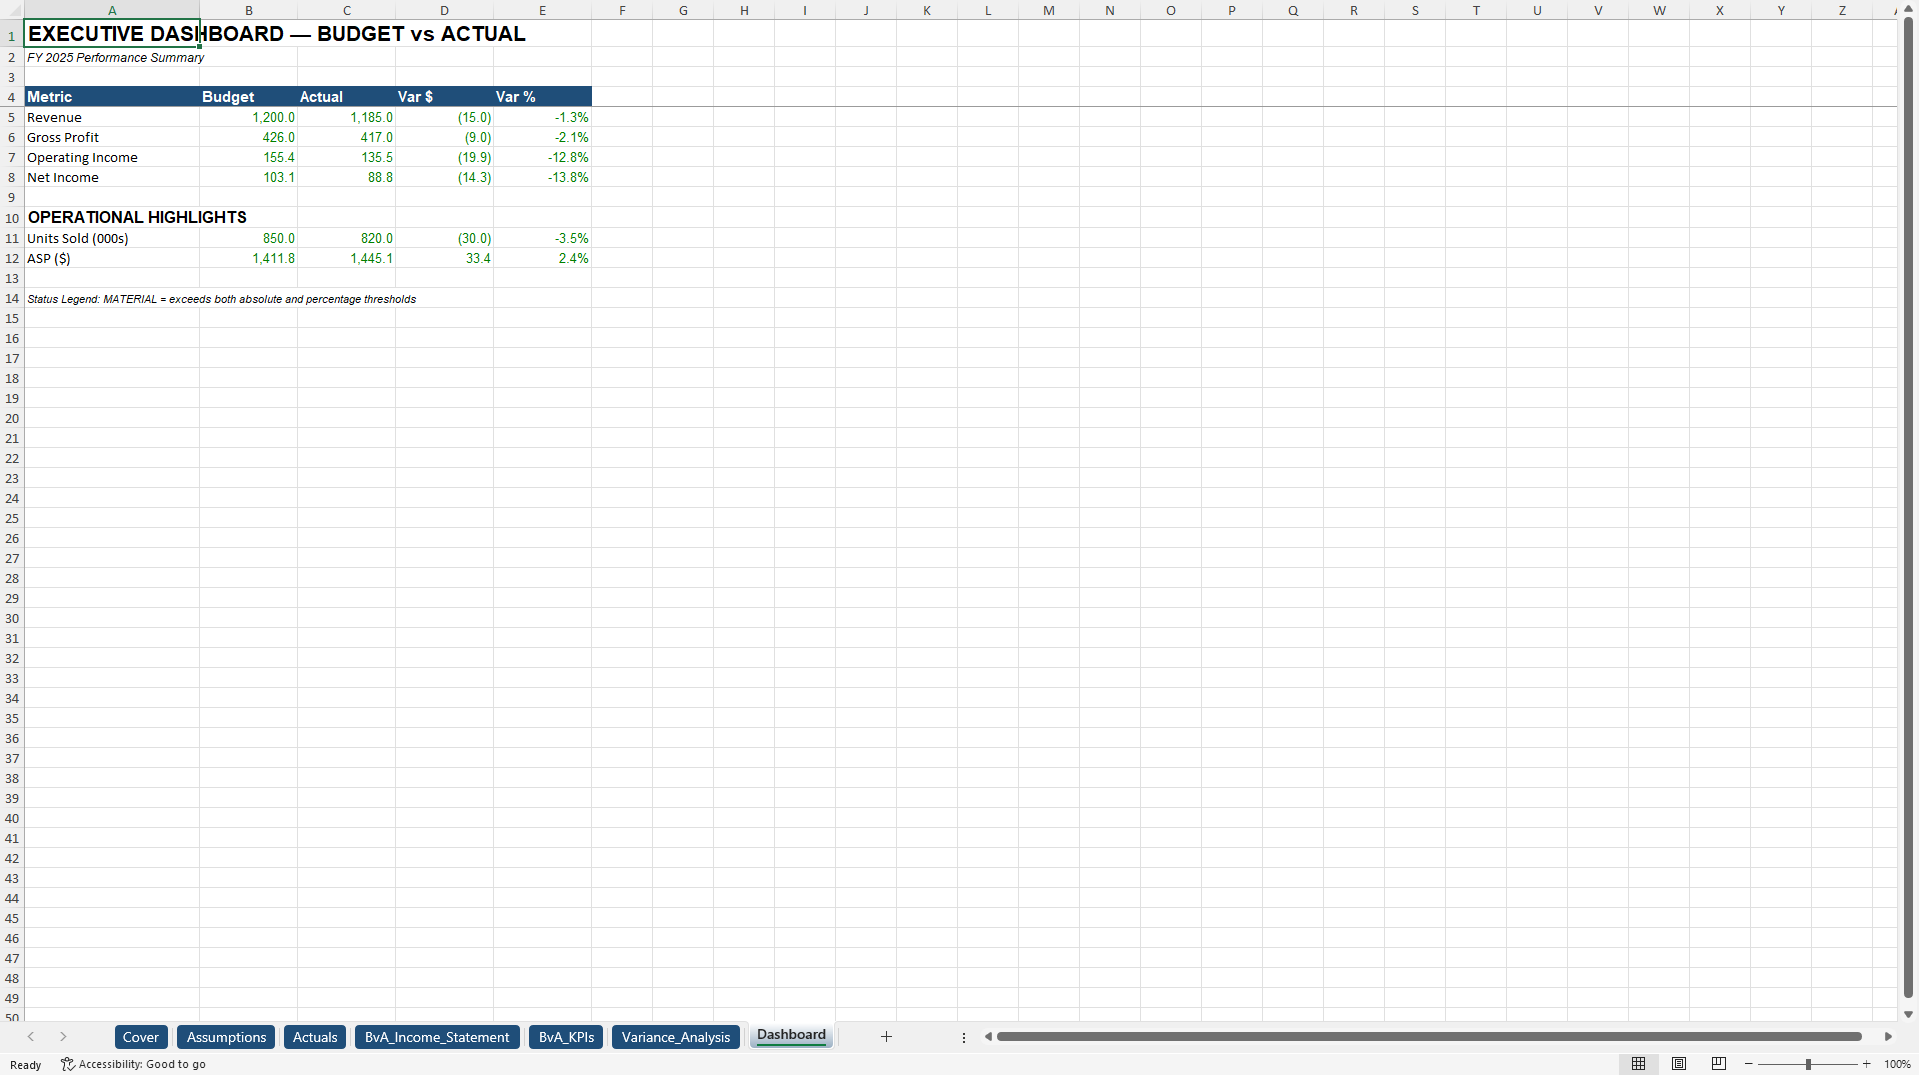
Review the Executive Dashboard for a high-level summary of key financial results and operational metrics. Use the Variance Analysis tab to document explanations and action items for material variances. The model follows professional color coding: blue font for inputs, black for formulas, and green for cross-sheet links. Number formats display negatives in parentheses and zeros as dashes, consistent with institutional reporting standards. All figures are presented in millions of dollars.
This Excel Budget vs Actual template is ideal for monthly management reporting, quarterly business reviews, departmental performance tracking, board packages, and training teams on proper variance analysis technique. It eliminates hours of manual calculation while delivering the transparency and rigor expected at leading corporations.
Download the Apex Global Industries Inc. Integrated BvA Variance Analysis model today – a robust, audit-friendly management reporting tool that supports rapid analysis of performance versus plan and clear communication of results to stakeholders.
Regards,
UJ Consulting
Strategy – Insight – Impat
Got a question about the product? Email us at support@flevy.com or ask the author directly by using the "Ask the Author a Question" form. If you cannot view the preview above this document description, go here to view the large preview instead.
Source: Best Practices in Budgeting & Forecasting, Variance Analysis Excel: Integrated Budget vs Actual (BvA) Variance Analysis Excel (XLSX) Spreadsheet, UJ Consulting _ Strategy-Insight-Impact
ABOUT THE AUTHOR

UJ Consulting | Strategy • Insight • Impact
UJ Consulting is an executive management consulting and business transformation practice founded by Untung Juanto, ST., MM., a senior executive, consultant, and transformation practitioner with more than 25 years of professional experience across local and multinational companies and diverse industries.
His career progressed from frontline
... [read more]
Ask the Author a Question
You must be logged in to contact the author.