
 Click main image to view in full screen.
Budget vs Actual: Variance & Rolling Forecast – Excel XLSX
Excel (XLSX) + supplemental PDF


BENEFITS OF THIS DOWNLOADABLE EXCEL DOCUMENT
- Splits the revenue variance into price, volume and mix, and the three add up to the whole variance for every product individually, not just in total.
- Restates the cost budget at the volume that actually happened, so the part of an overspend that volume caused is separated from the part nobody can blame on volume.
- Rolls the closed months into a full-year landing point and bridges the plan to it in seven steps that close to the cent.
BUDGETING & FORECASTING EXCEL DESCRIPTION
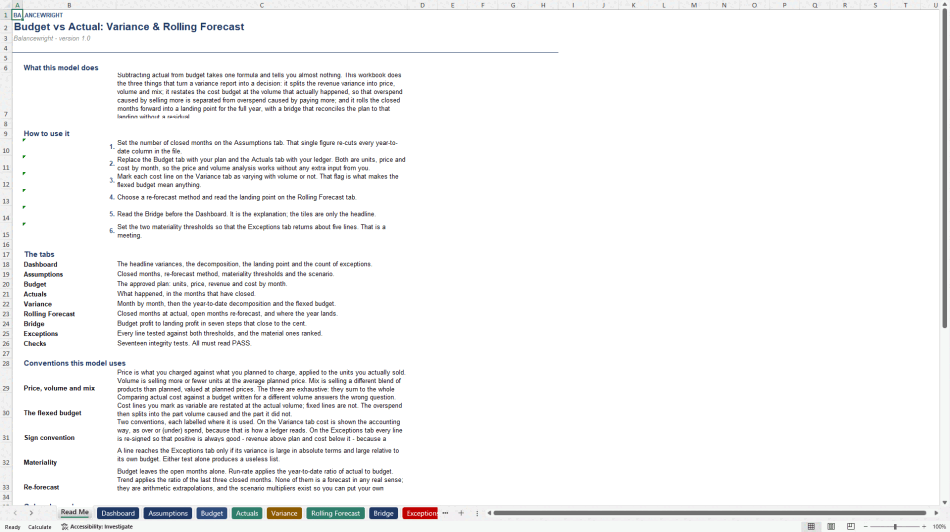
Subtracting actual from budget takes one formula and tells you almost nothing.
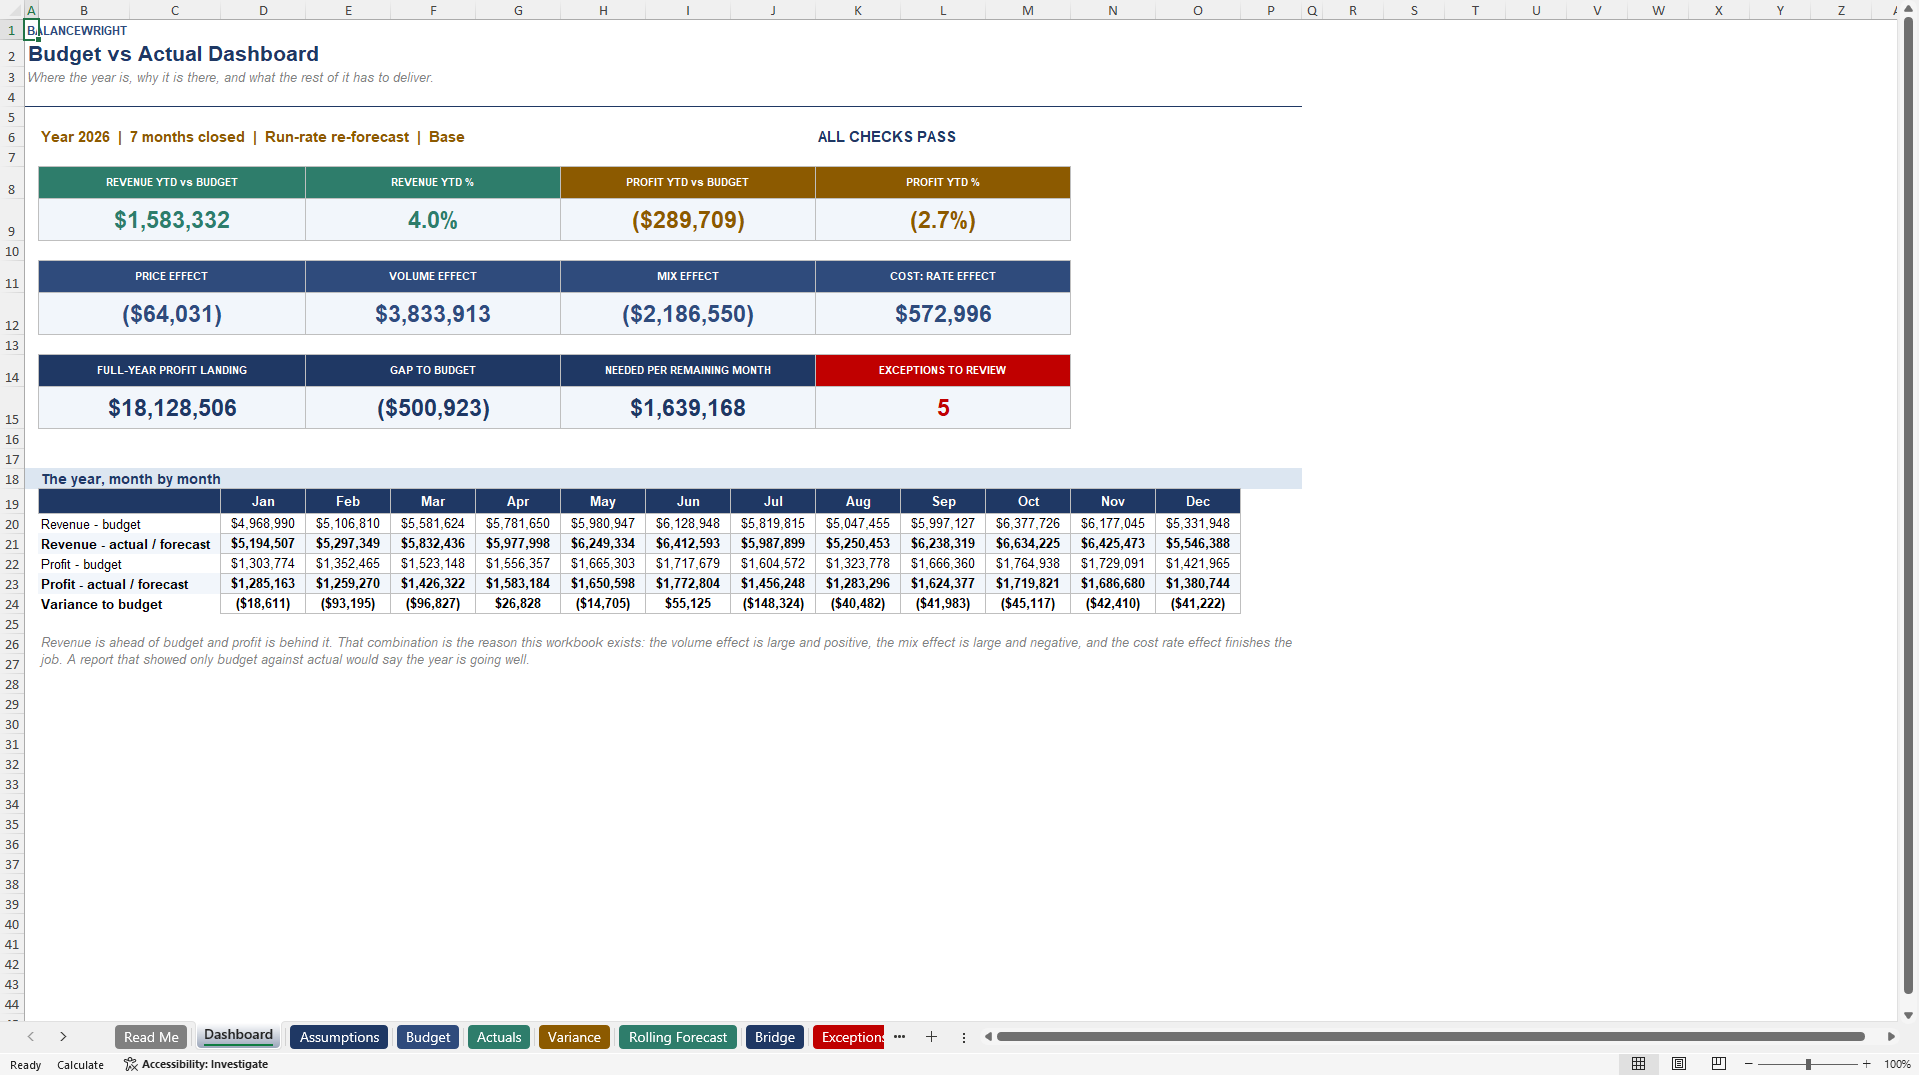
This Excel model does the three things that turn a variance report into a decision. It splits the revenue variance into price, volume and mix. It restates the cost budget at the volume that actually happened. And it rolls the closed months forward into a landing point for the full year, with a bridge that reconciles the plan to that landing without a residual. Every figure is a live formula.
THE THIRD EFFECT
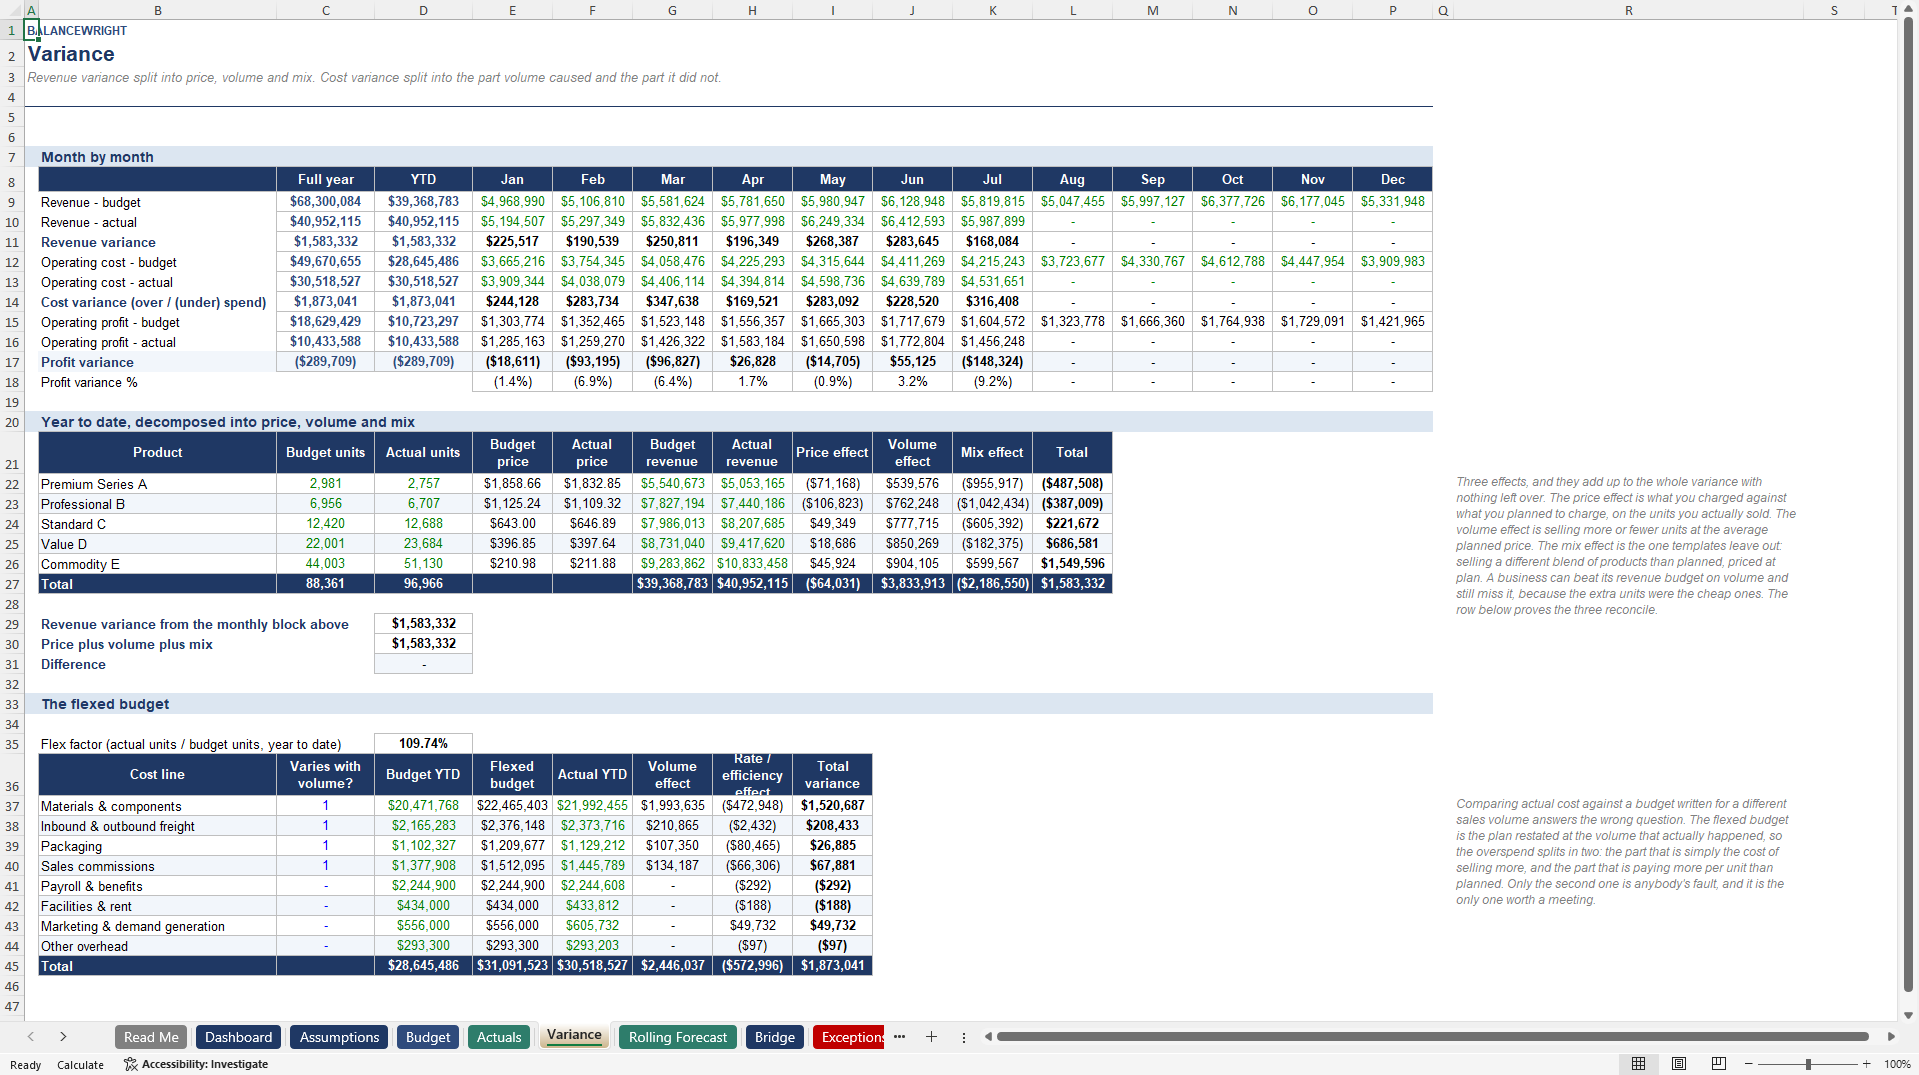
A revenue variance has three causes and most templates report two of them. Price is what you charged against what you planned to charge, applied to the units you actually sold. Volume is selling more or fewer units at the average planned price. Mix is selling a different blend of products than planned, valued at planned prices.
Mix is the one that gets left out, and it is usually the one that matters. In the worked example the business sold nine point seven percent more units than planned and beat its revenue budget by four percent. The volume effect alone was worth 3.83 million. The mix effect took 2.19 million of it straight back, because the extra units were the cheap ones. Operating profit finished the period behind budget while revenue finished ahead of it.
The three effects are exhaustive. They sum to the whole revenue variance in total and for every product individually, and two integrity checks prove it. There is no unexplained residual, because a residual is where an analysis goes to hide.
THE FLEXED BUDGET
Comparing actual cost against a budget written for a different sales volume answers the wrong question. If you sell ten percent more units you will spend more on materials, and none of that is a failure of cost control.
Mark each cost line as varying with volume or not, and the model restates the variable ones at the volume that actually happened. The overspend then splits in two: the part volume caused, and the part it did not. In the worked example total cost is 1.87 million over budget, of which 2.45 million is simply the cost of selling more. Only what is left belongs in a meeting.
THE LANDING POINT
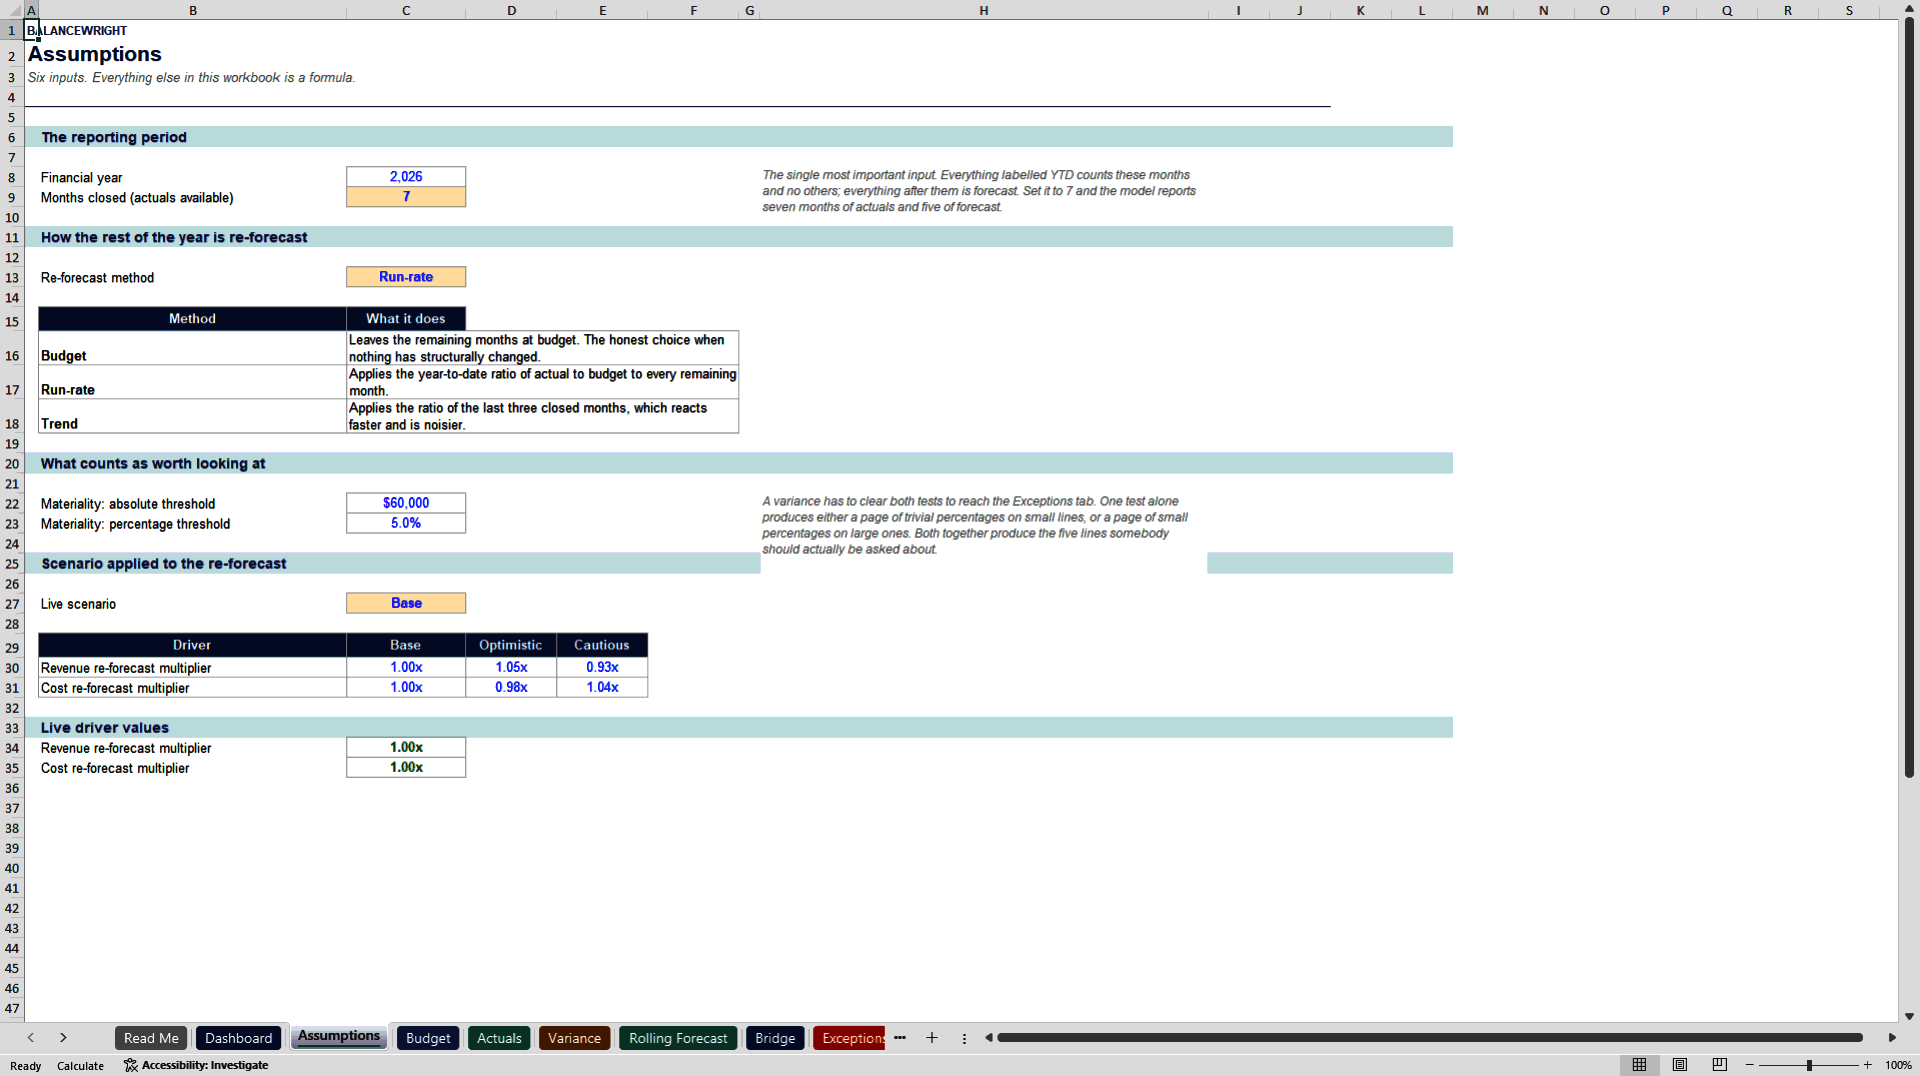
The Rolling Forecast tab takes the closed months at actual and re-forecasts the rest, three ways: leave the remaining months at budget, apply the year-to-date ratio of actual to budget, or apply the ratio of the last three closed months. Scenario multipliers sit on top so you can add your own judgement.
What it produces is the number a board reads: what the remaining months have to deliver for the year to finish on plan, against what they are currently forecast to deliver, stated per month rather than as an annual figure nobody can act on.
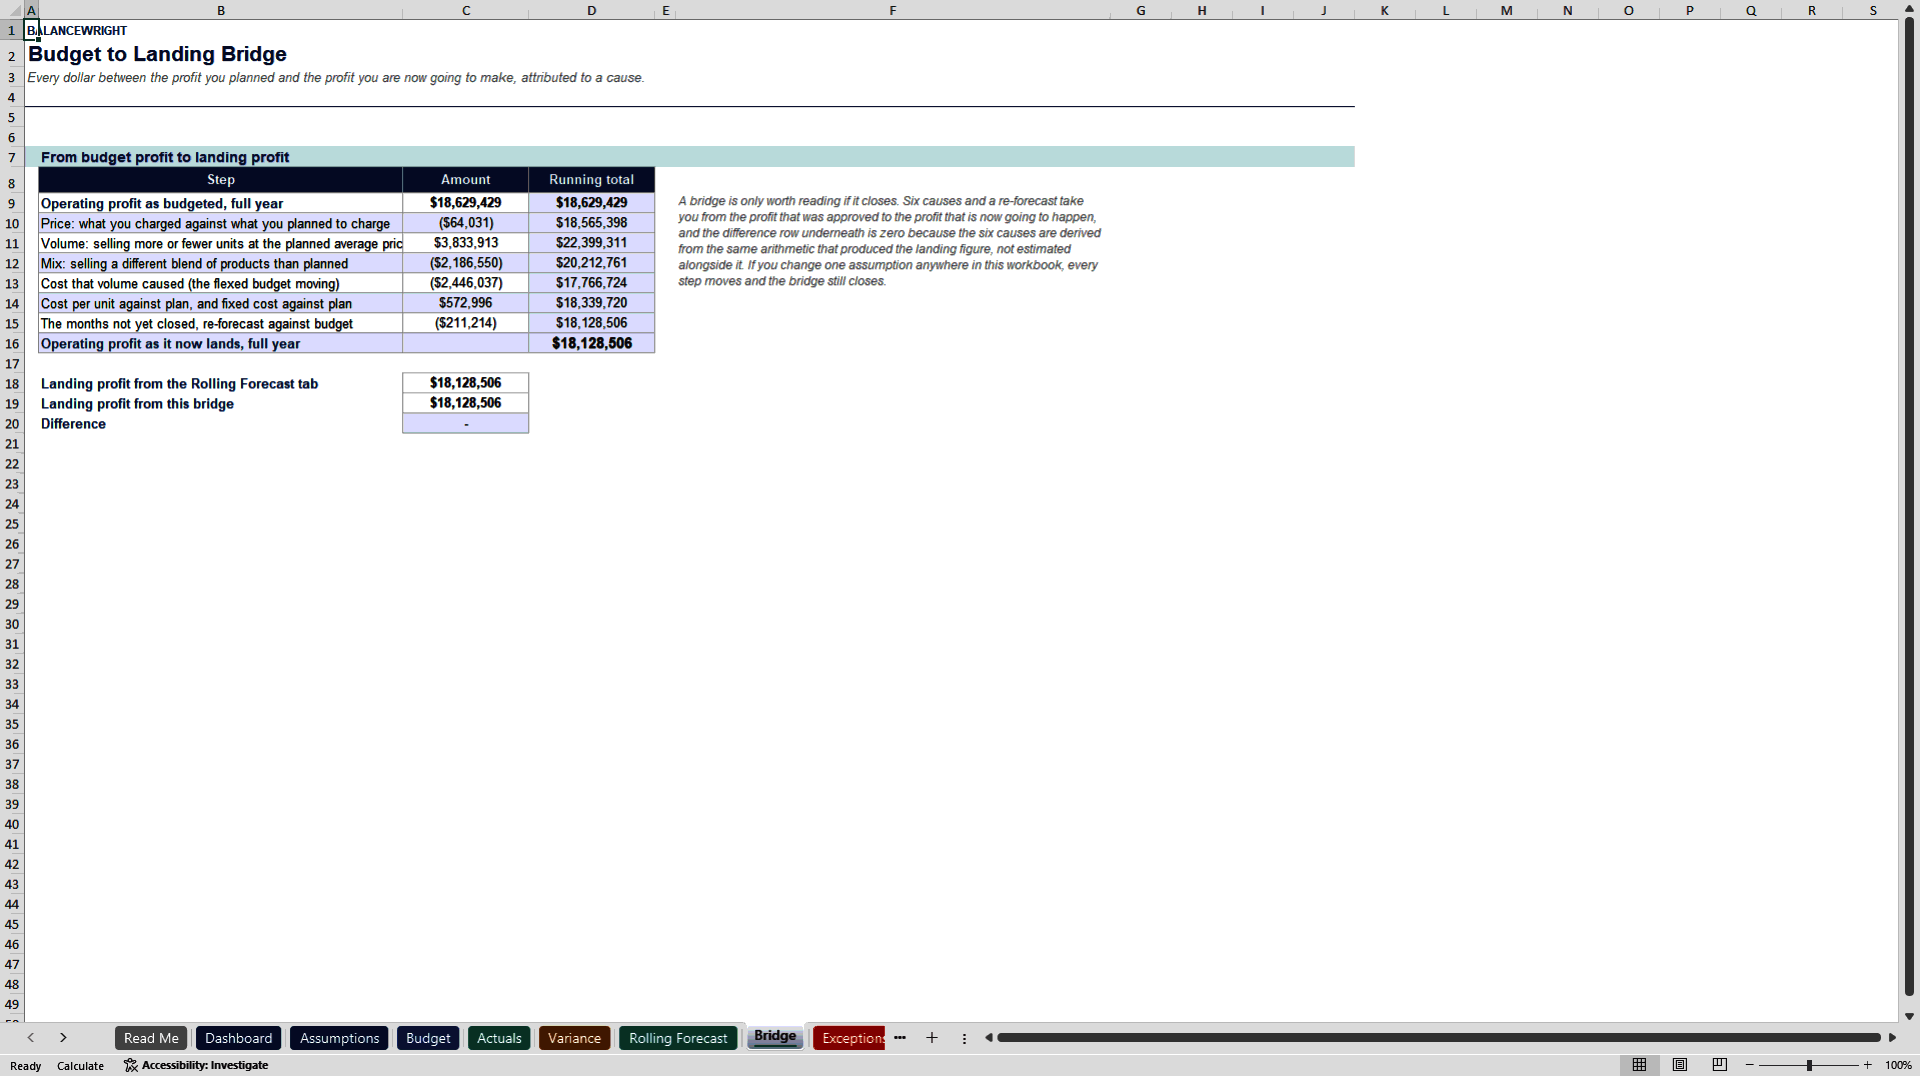
The Bridge tab then walks from the profit that was approved to the profit that is now going to happen, in seven steps. It closes to the cent, because the six causes are derived from the same arithmetic that produced the landing figure rather than estimated alongside it.
EXCEPTIONS
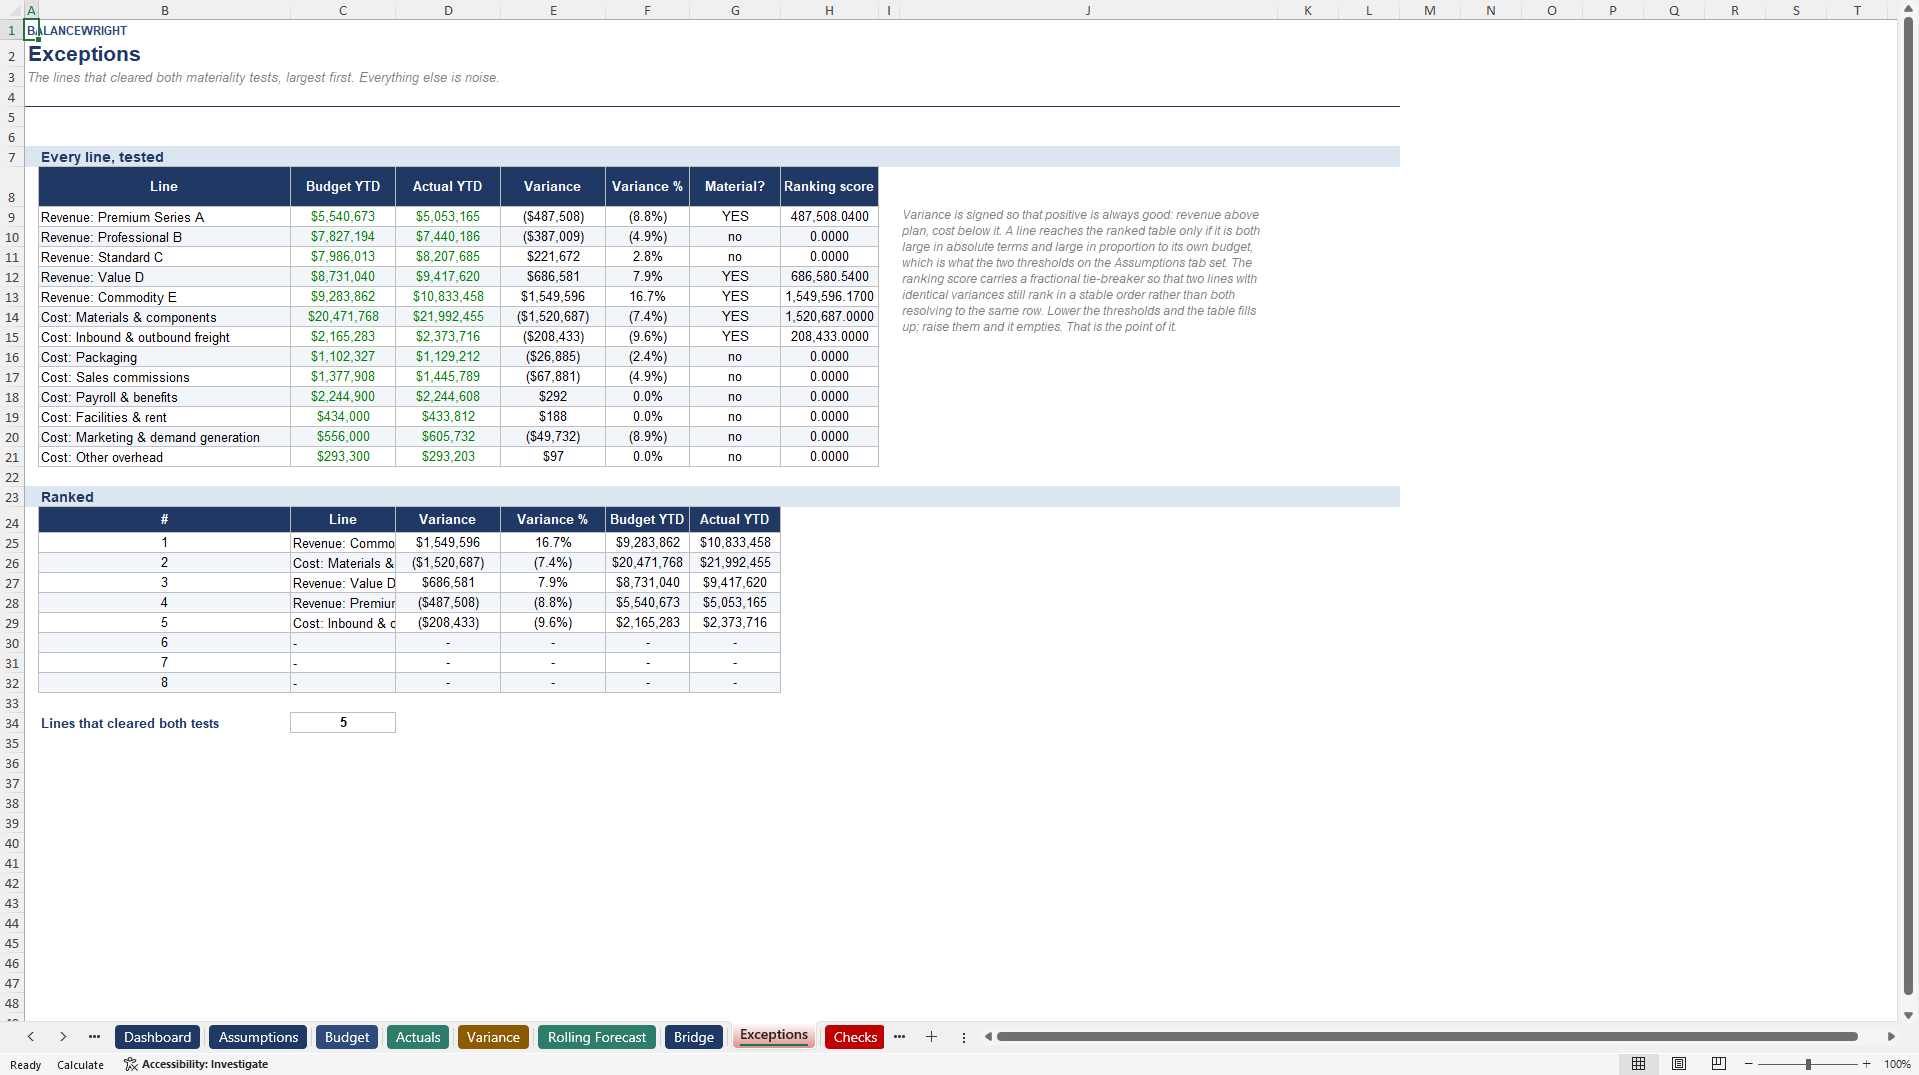
A variance report that lists two hundred lines is a variance report nobody reads. Set an absolute threshold and a percentage threshold, and only lines that clear both reach the ranked table. Set them so the table returns about five lines. That is a meeting.
WHAT IS INSIDE
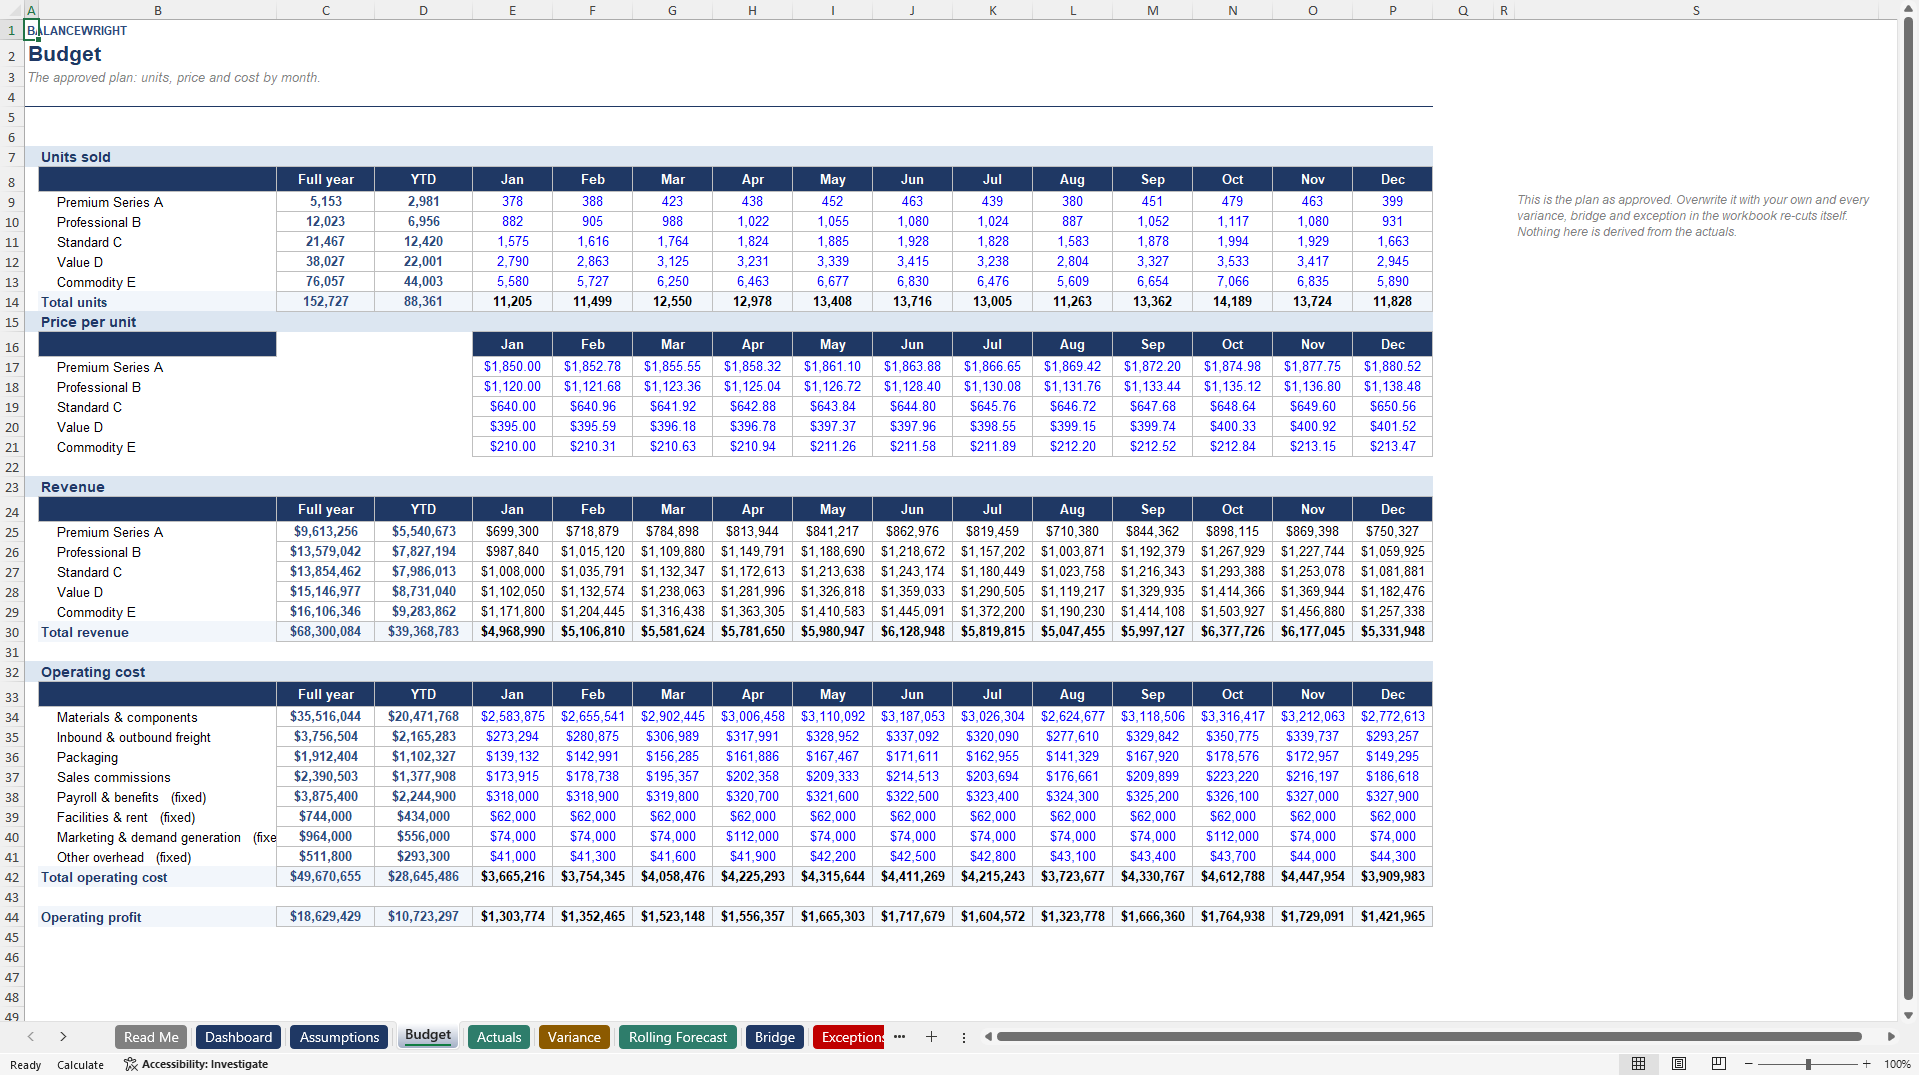
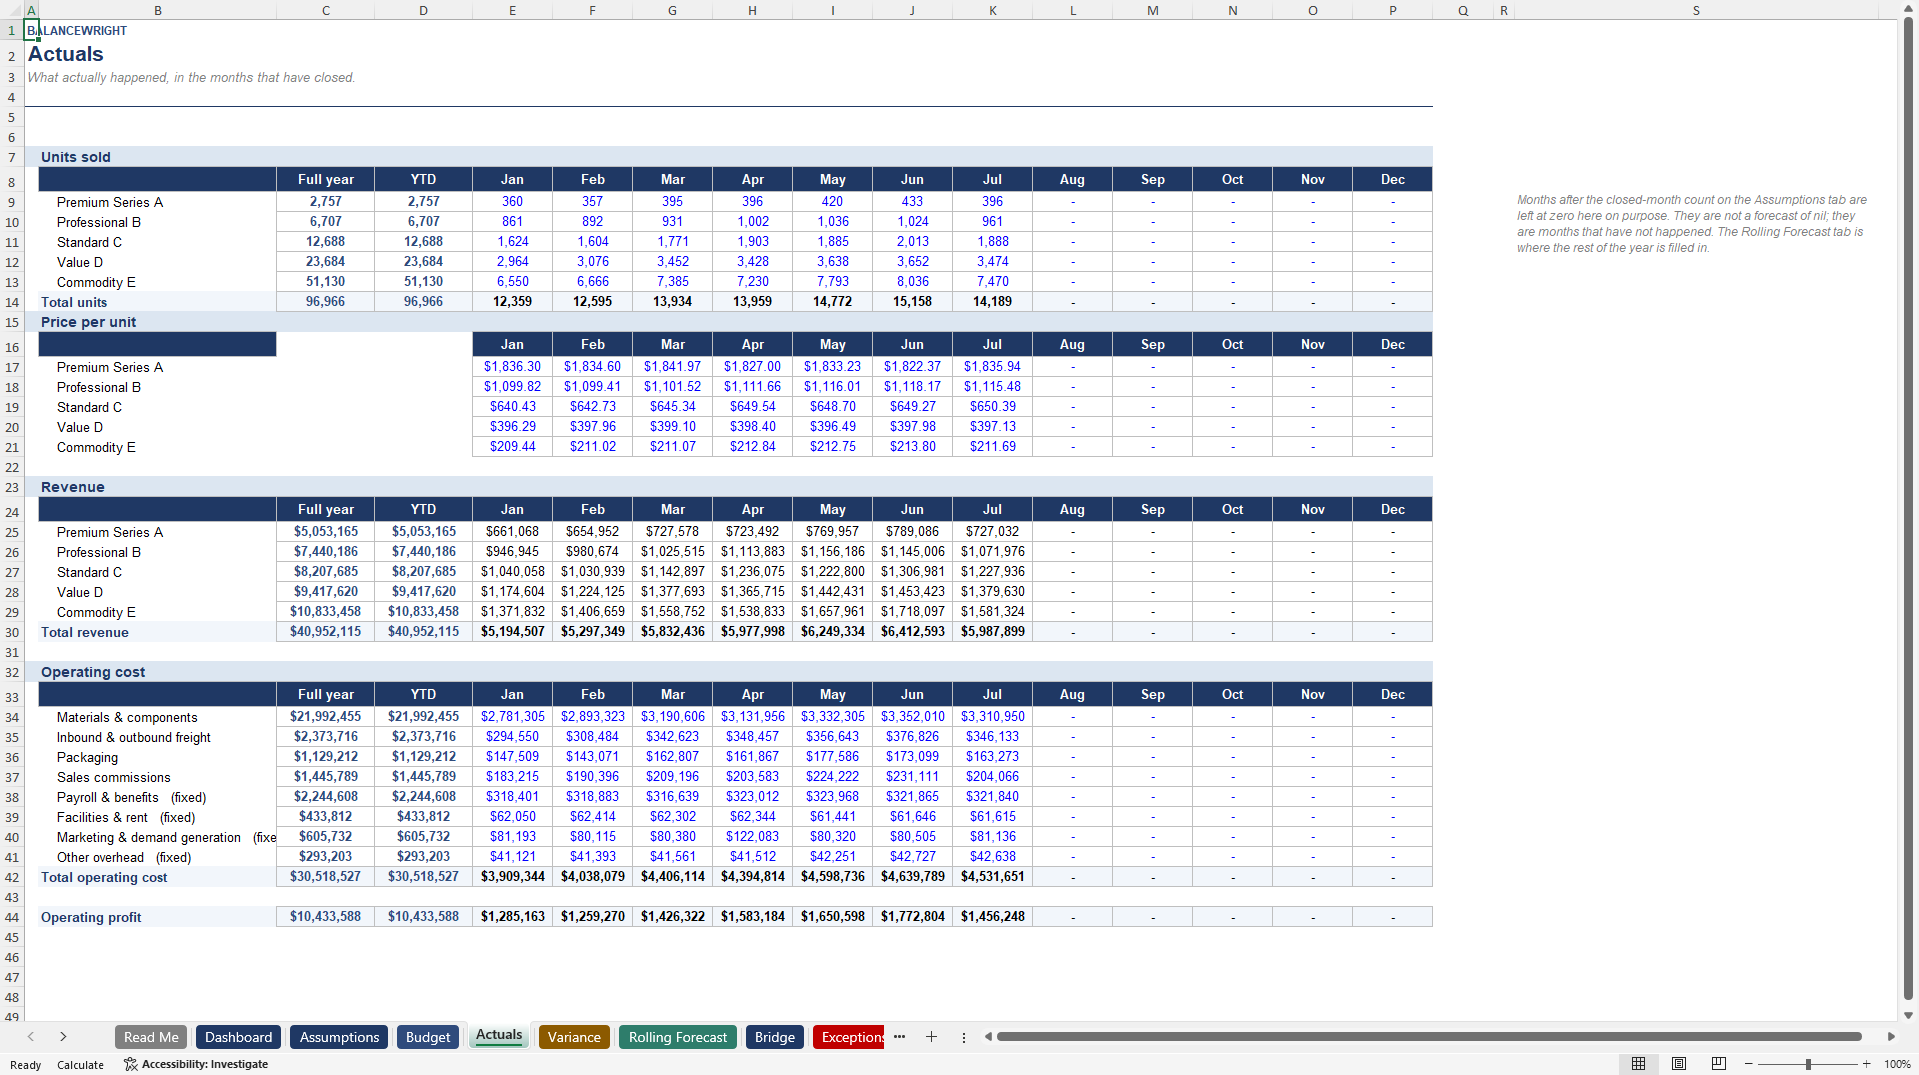
Ten tabs: Read Me, Dashboard, Assumptions, Budget, Actuals, Variance, Rolling Forecast, Bridge, Exceptions, Checks. Twelve months, five products with units and price, eight cost lines, three scenarios from one cell, 892 live formulas. Change the closed-month count and the whole file re-cuts itself.
No macros, no add-ins, no external links, no password protection, no locked cells and no iterative calculation to switch on. A five-page PDF guide documents every convention and every limitation. Seventeen integrity checks sit on their own tab and must all read PASS.
This workbook analyses variance; it does not explain it. It is not financial advice, and the worked example is invented.
Building this from scratch takes a competent financial modeller a day or two.
Got a question about the product? Email us at support@flevy.com or ask the author directly by using the "Ask the Author a Question" form. If you cannot view the preview above this document description, go here to view the large preview instead.
Source: Best Practices in Budgeting & Forecasting, Management Accounting Excel: Budget vs Actual: Variance & Rolling Forecast Excel (XLSX) Spreadsheet, Balancewright
ABOUT THE AUTHOR

Balancewright builds working financial models for subscription and recurring-revenue businesses -- cohort retention, revenue movement, unit economics, cash flow and scenario forecasting.
Every model is formula-driven end to end. No locked cells, no passwords, no macros and no external links, so any calculation can be inspected, adapted and audited. Each file ships with a visible
... [read more]
Ask the Author a Question
You must be logged in to contact the author.




























