
 Click main image to view in full screen. Unlock all 10 preview images:
Industrial Power Sourcing: Ppa and Solar Excel Model – Excel XLSX
Excel (XLSX) + Zip archive file (ZIP)


BENEFITS OF THIS DOWNLOADABLE EXCEL DOCUMENT
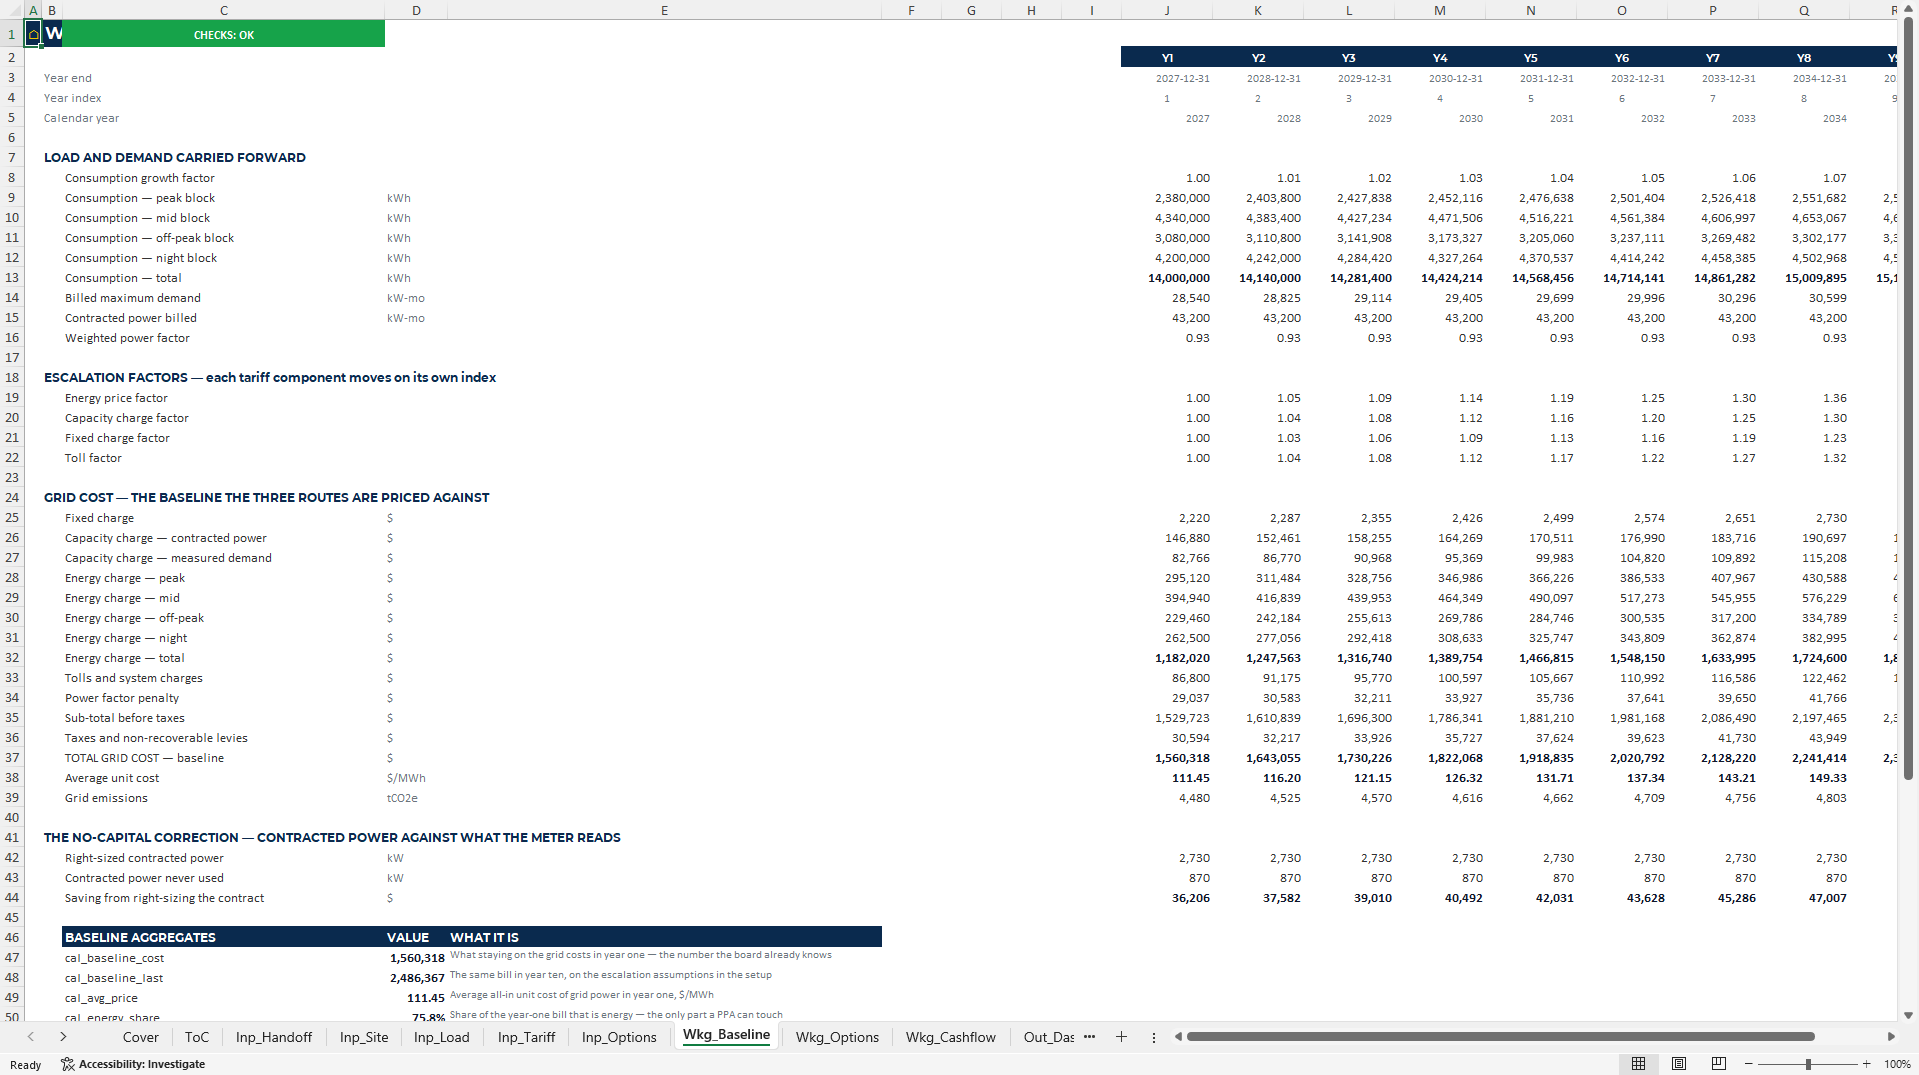
- Rebuild the electricity bill from declared tariff rules and compare it with 12 actual invoices before valuing any sourcing route.
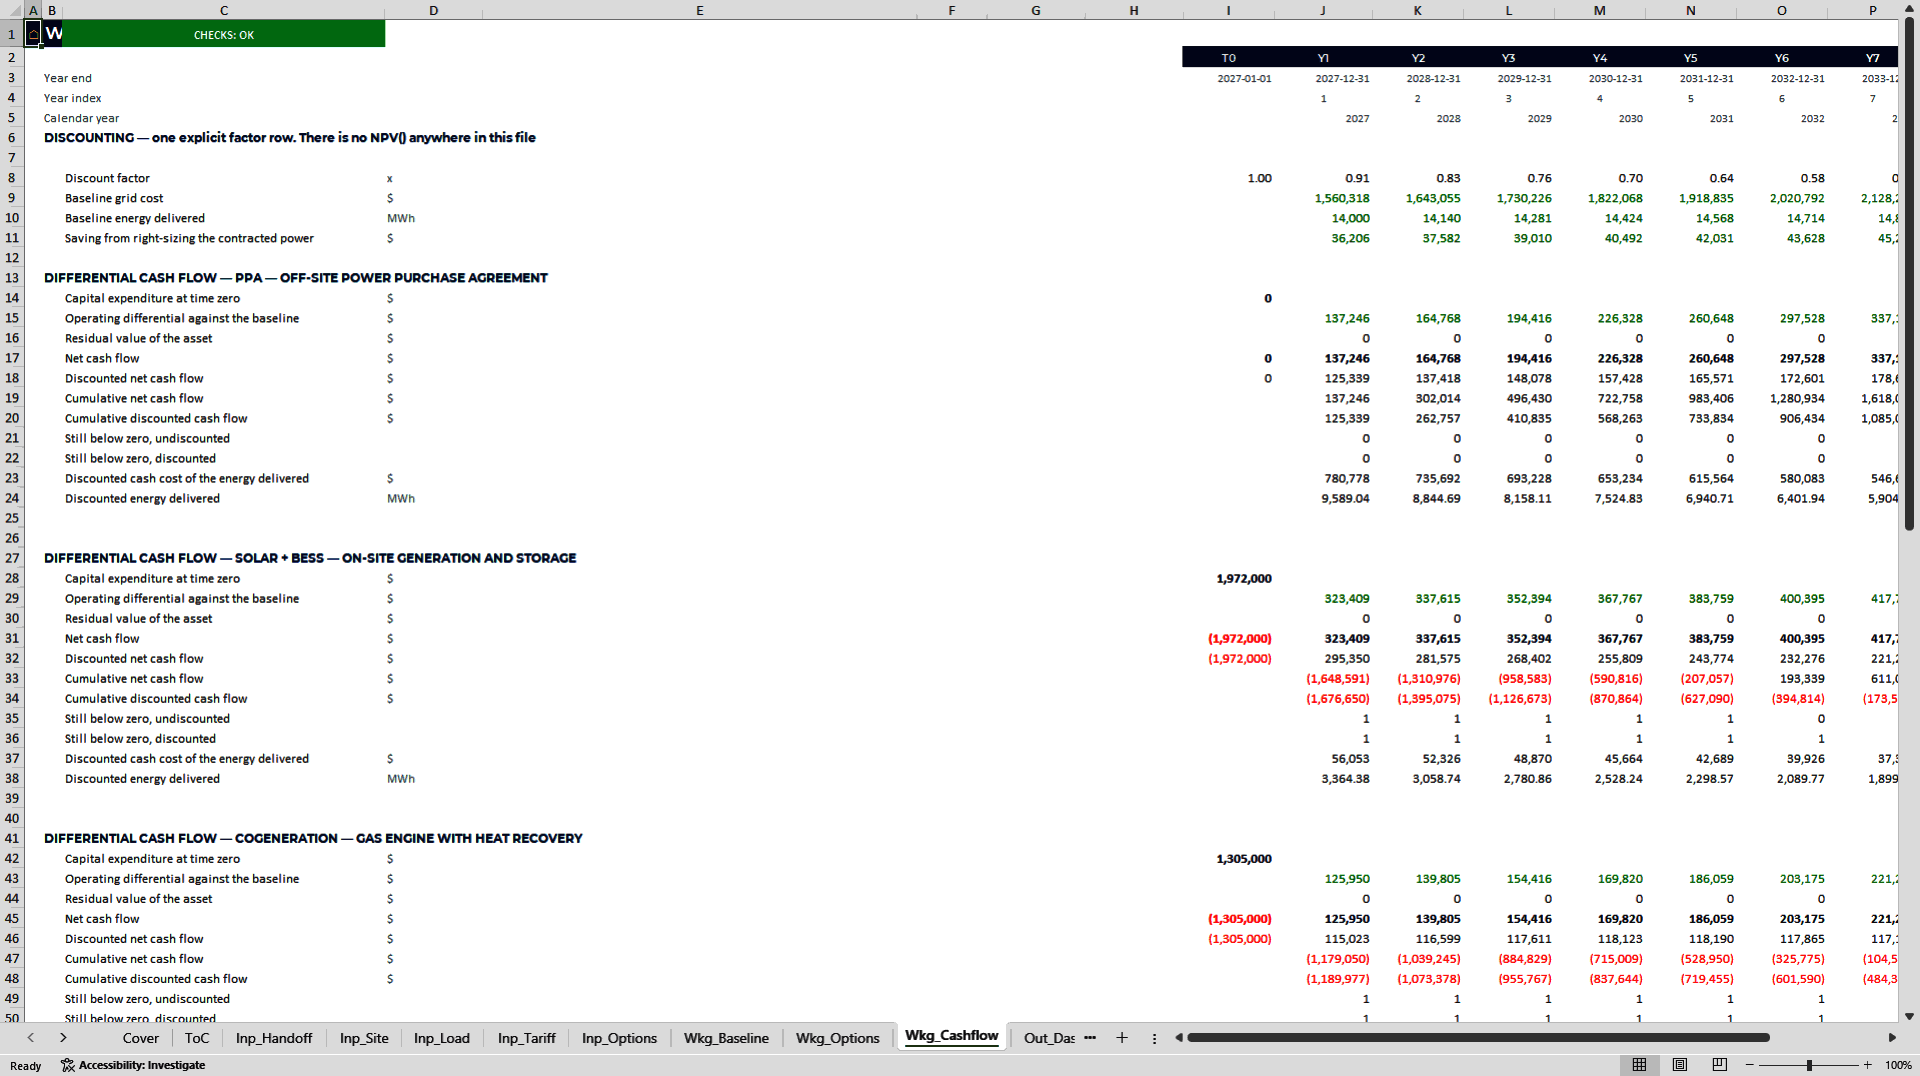
- Assess grid supply, PPA, solar with storage and cogeneration through differential NPV, levelised cost, capital requirement, payback and execution considerations.
- Test contracted-power right-sizing and demand-charge exposure alongside longer-term procurement alternatives.
SOLAR ENERGY EXCEL DESCRIPTION
# Industrial Power Sourcing Model: Compare Grid, PPA, Solar and Cogeneration in Excel
Long-term power decisions are hard to defend when every developer supplies a different baseline. The Industrial Power Sourcing Model gives industrial buyers one auditable Excel comparison for grid supply, an off-site PPA, on-site solar with battery storage and gas cogeneration, all measured against a tariff structure rebuilt from the buyer's own invoices.
## Three Decisions This Package Helps You Make
1. Test the baseline before trusting the business case. Rebuild the electricity bill from declared tariff rules and compare it with 12 actual invoices before valuing any sourcing route.
2. Compare four routes on one economic basis. Assess grid supply, PPA, solar with storage and cogeneration through differential NPV, levelised cost, capital requirement, payback and execution considerations.
3. Capture simpler savings before committing capital. Test contracted-power right-sizing and demand-charge exposure alongside longer-term procurement alternatives.
## What's Included
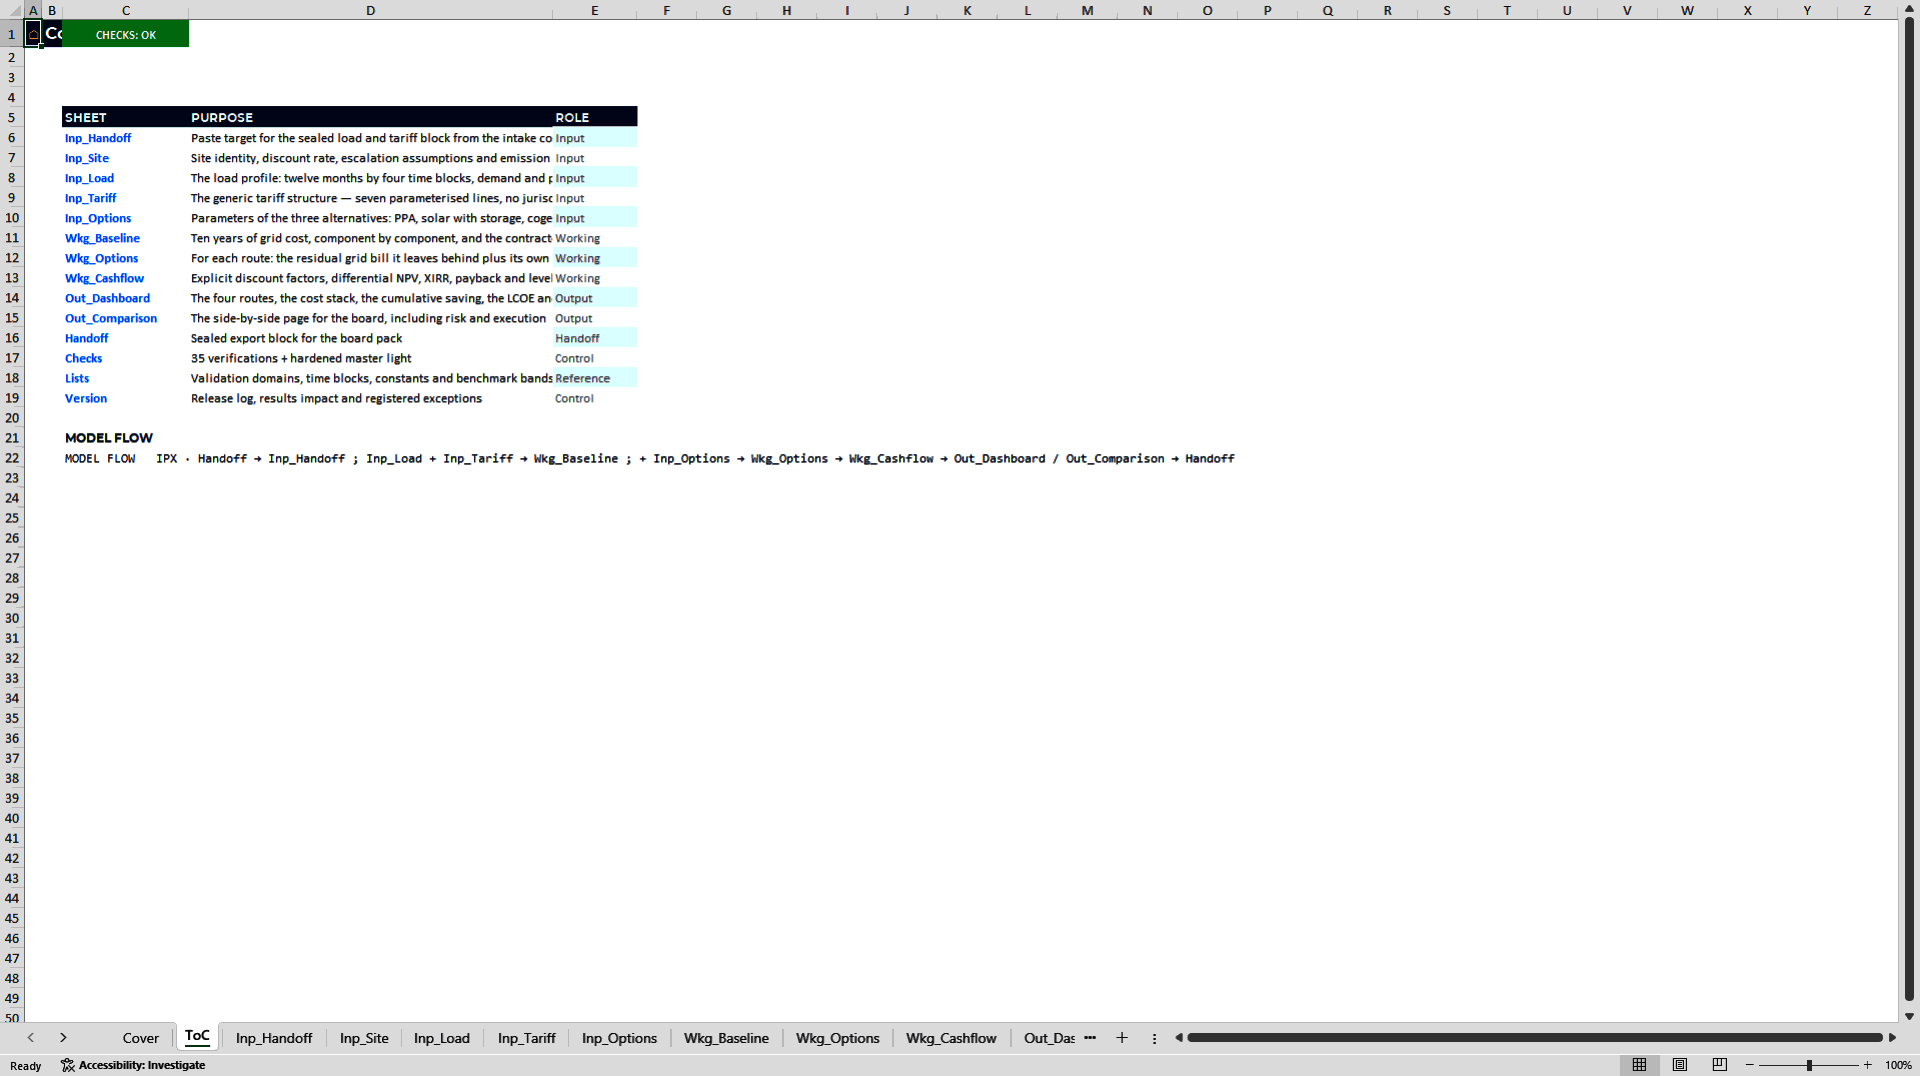
• `IPS_Industrial_Power_Sourcing_Model_Commercial_Edition_v1` – the 16-sheet sourcing and investment decision model.
• `IPX_Load_Profile_Tariff_Intake_Commercial_Edition_v1` – the 13-sheet load-profile, invoice and tariff-structure companion workbook.
• `IPS_User_Manual.pdf` – a 72-page illustrated user manual covering the operating sequence, inputs, outputs, controls and interpretation.
• A fully populated worked demo, 516 named ranges, six charts and a board-ready route comparison.
Both Excel workbooks are editable and open with the worked example already populated, so you can understand the logic before replacing demo inputs with your own data. The package is published by ExpertPro Decision Tools.
## Capabilities Tied to Decisions
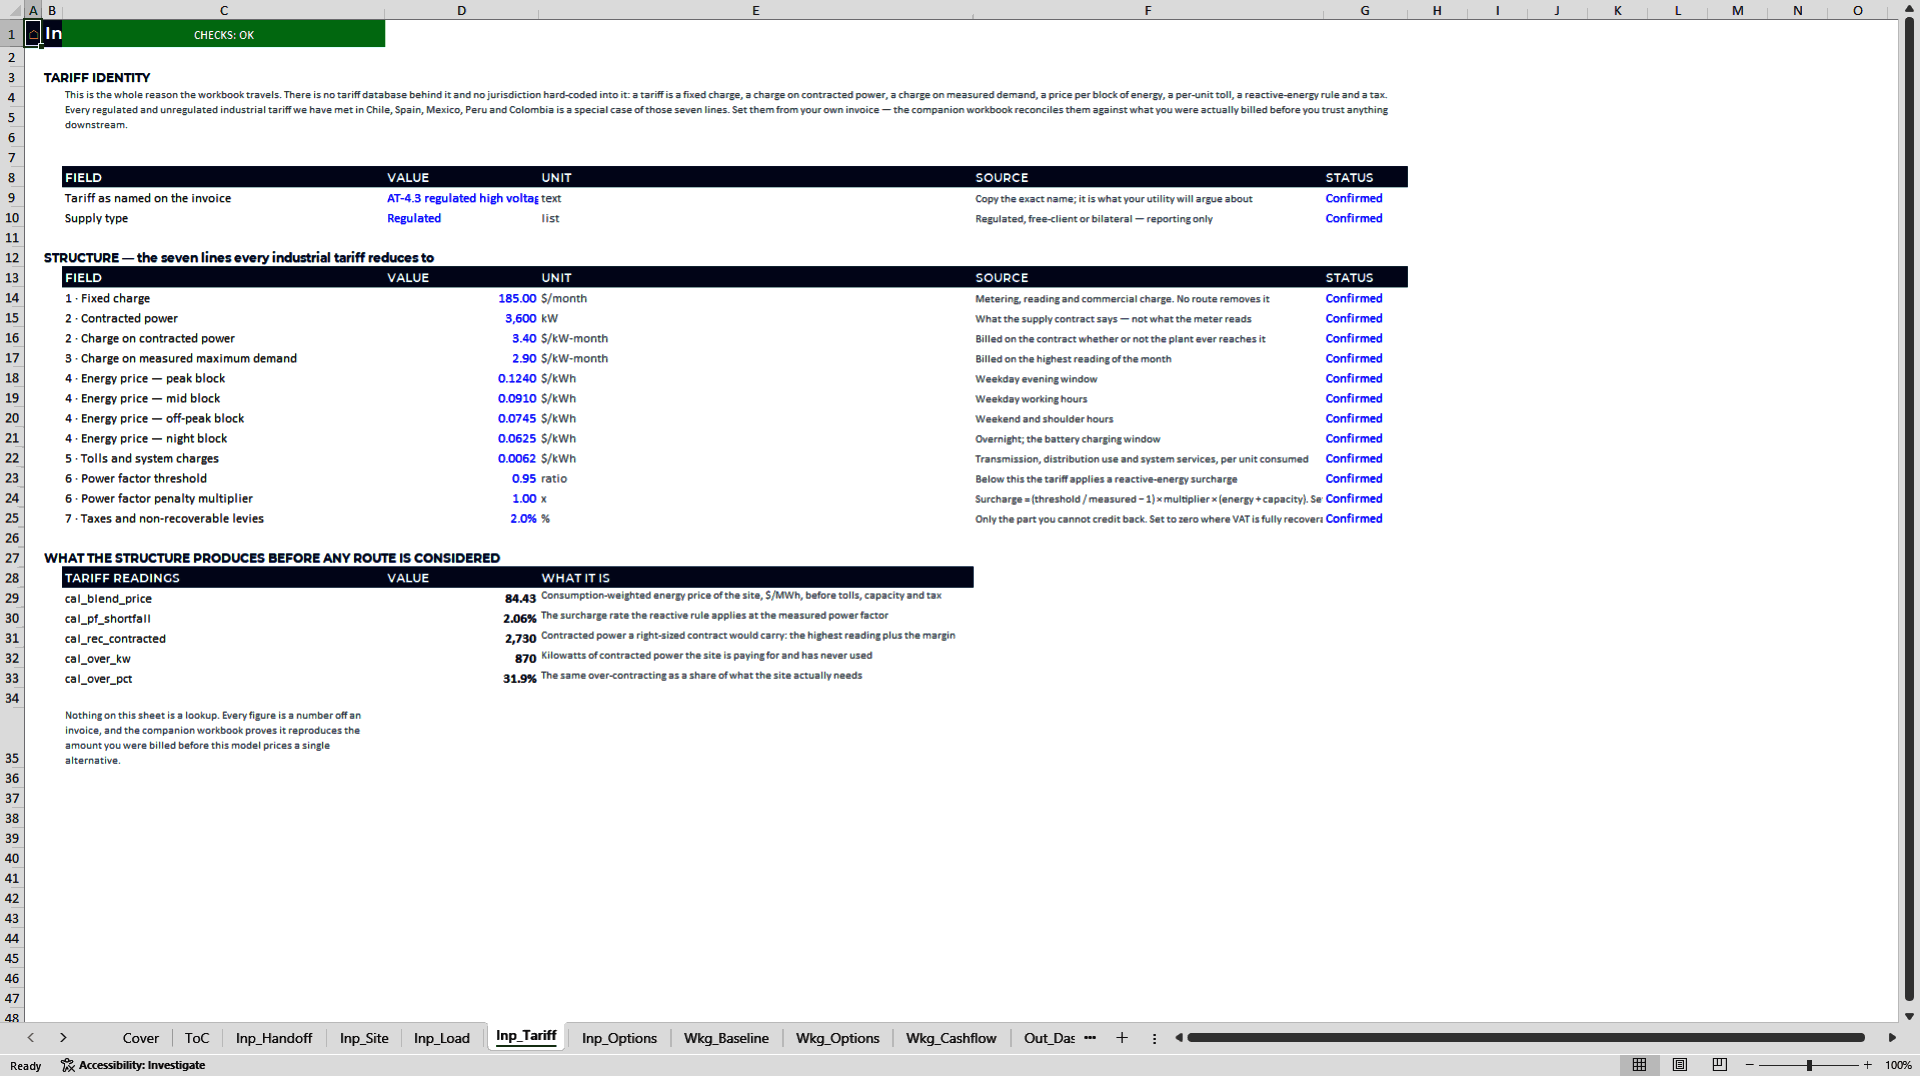
• Rebuild the tariff baseline. Convert 12 monthly invoices into a four-block load profile and a parameterised tariff structure, then reconcile calculated charges with actual bills before relying on downstream economics.
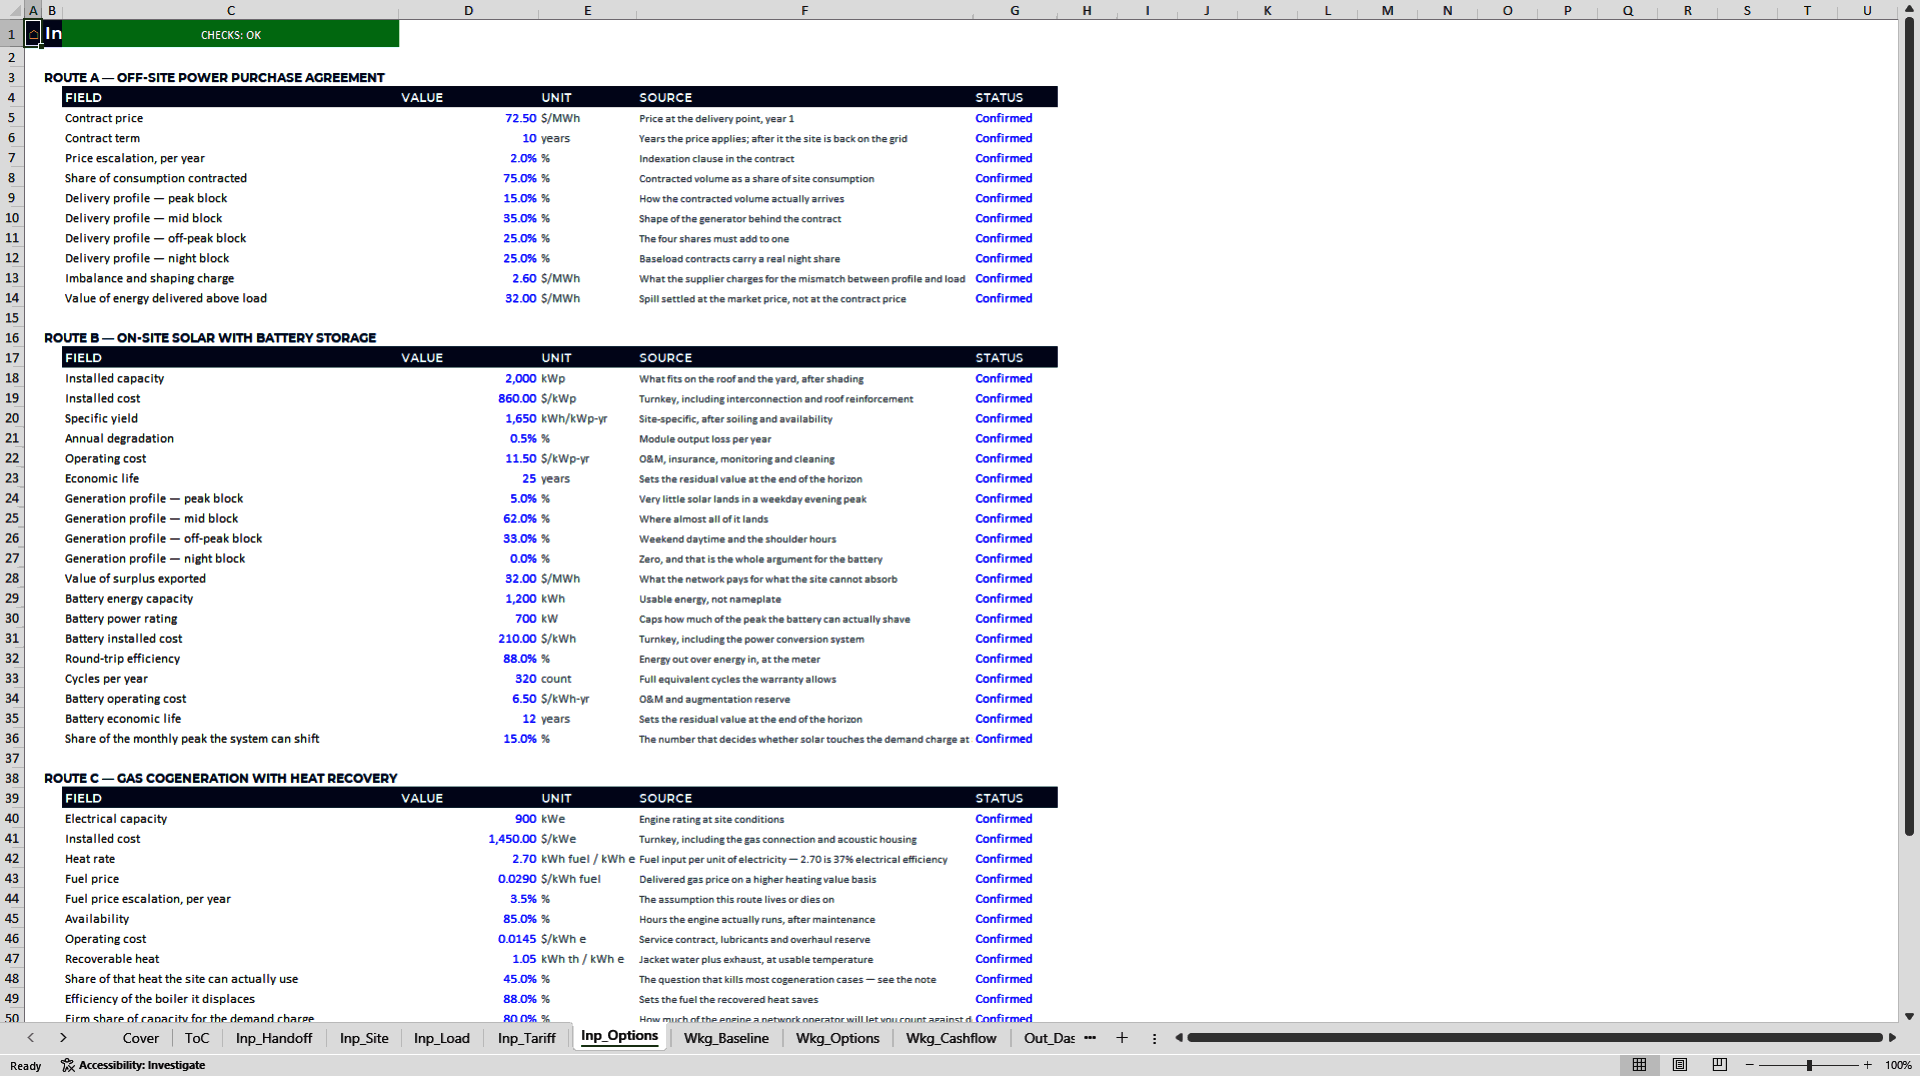
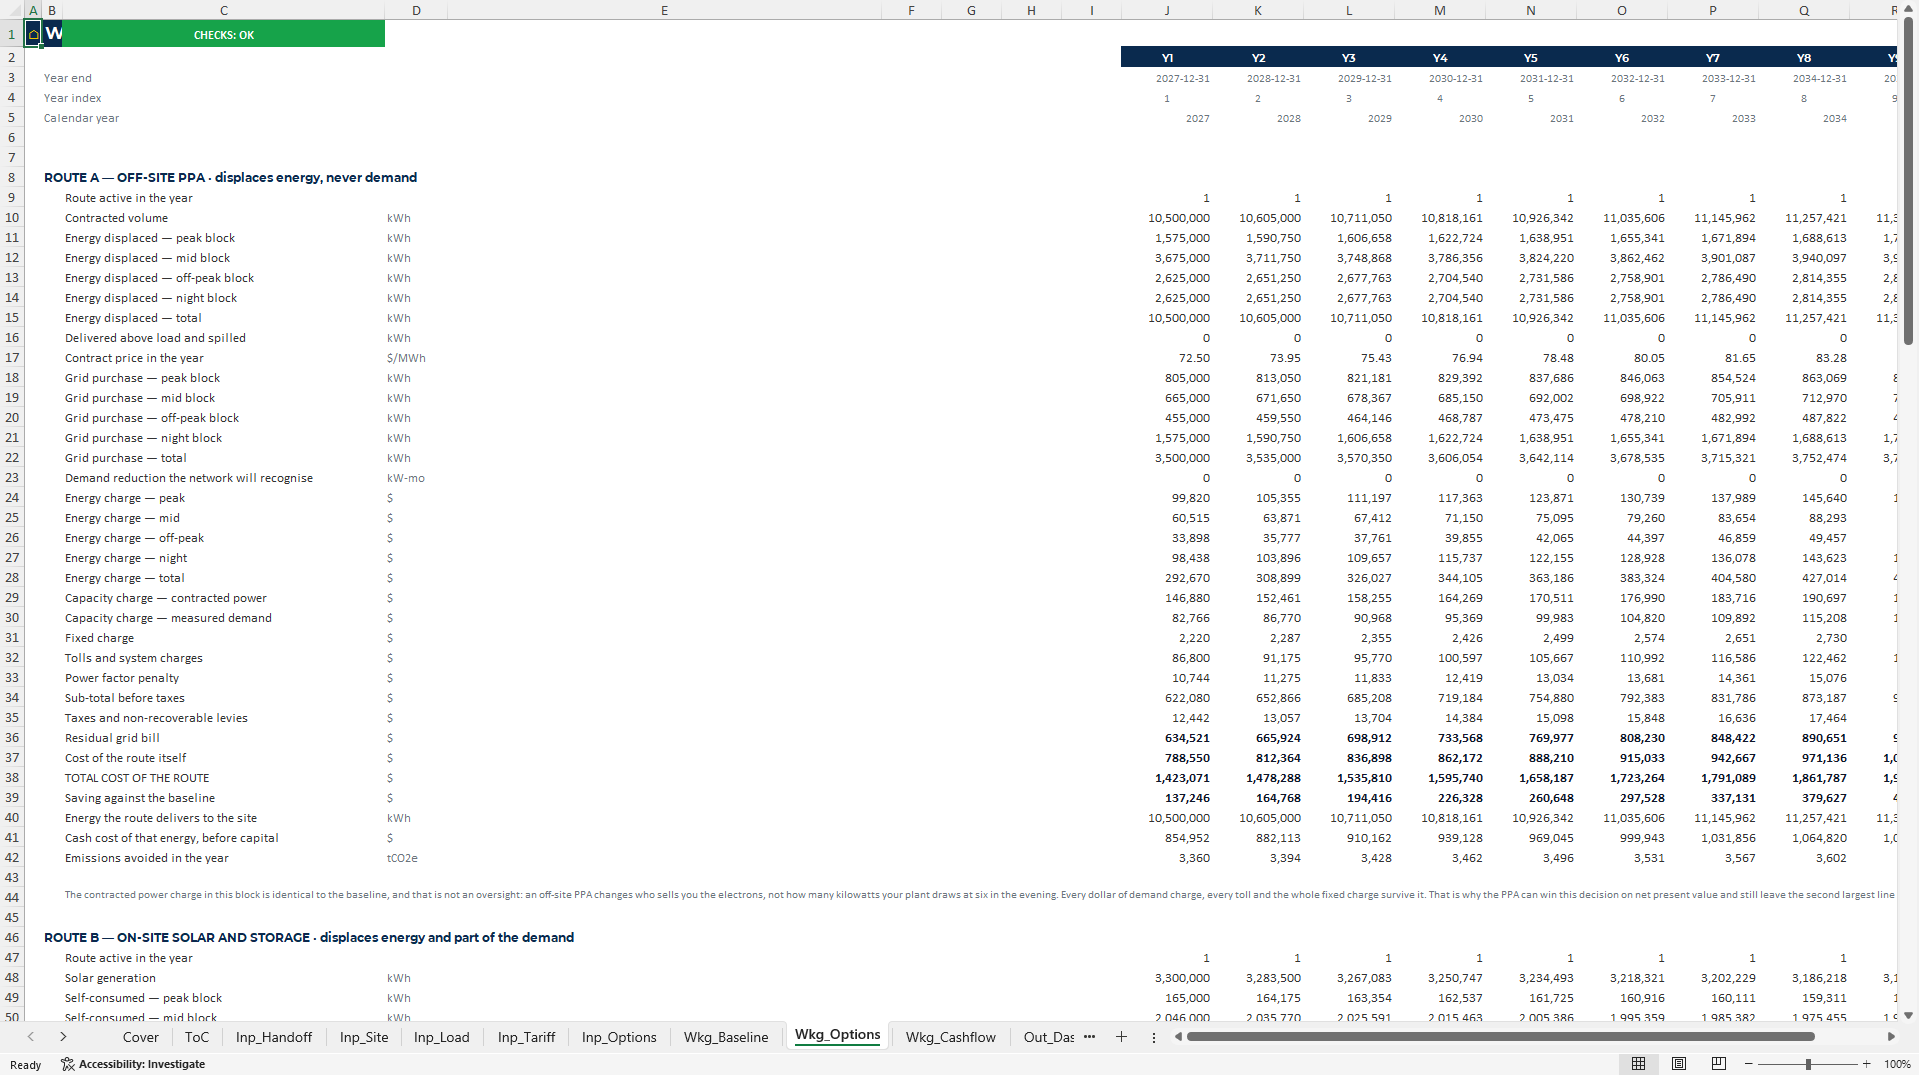
• Price unlike alternatives consistently. Compare the status quo, an off-site PPA, on-site solar with battery storage and gas cogeneration against the same underlying bill.
• Expose the sources of value. Separate energy, demand, contracted-power, toll, reactive-energy, fixed-charge and tax effects so the buyer can see which charges each route can and cannot displace.
• Trace investment economics. Review visible discount factors, dated cash flows, differential NPV, levelised cost and payback without relying on a hidden NPV or IRR calculation.
• Support a defendable recommendation. Bring execution time, counterparty risk, balance-sheet treatment and route-specific success conditions into the comparison rather than ranking options on headline savings alone.
## How the Model Works
Inputs → Analysis → Controls → Outputs → Decision
| Stage | What happens |
|—-|—-|
| Inputs | Enter monthly invoices, metered demand, contracted power, time-block consumption, tariff rules, route assumptions and dated benchmarks. |
| Analysis | Rebuild the bill, derive the load profile and value grid, PPA, solar-plus-storage and cogeneration routes on a consistent basis. |
| Controls | Reconcile the declared tariff to actual invoices and run named checks across inputs, calculations and cross-workbook hand-offs. |
| Outputs | Review tariff findings, cash flows, differential NPV, levelised cost, payback, risk factors and comparison charts. |
| Decision | Select a route, reject an uneconomic case, request better terms or pursue a no-capex contract correction first. |
## Worked Demo: What You See on Opening
The demo represents a refrigerated food plant consuming 14 million kWh per year under a regulated high-voltage tariff.
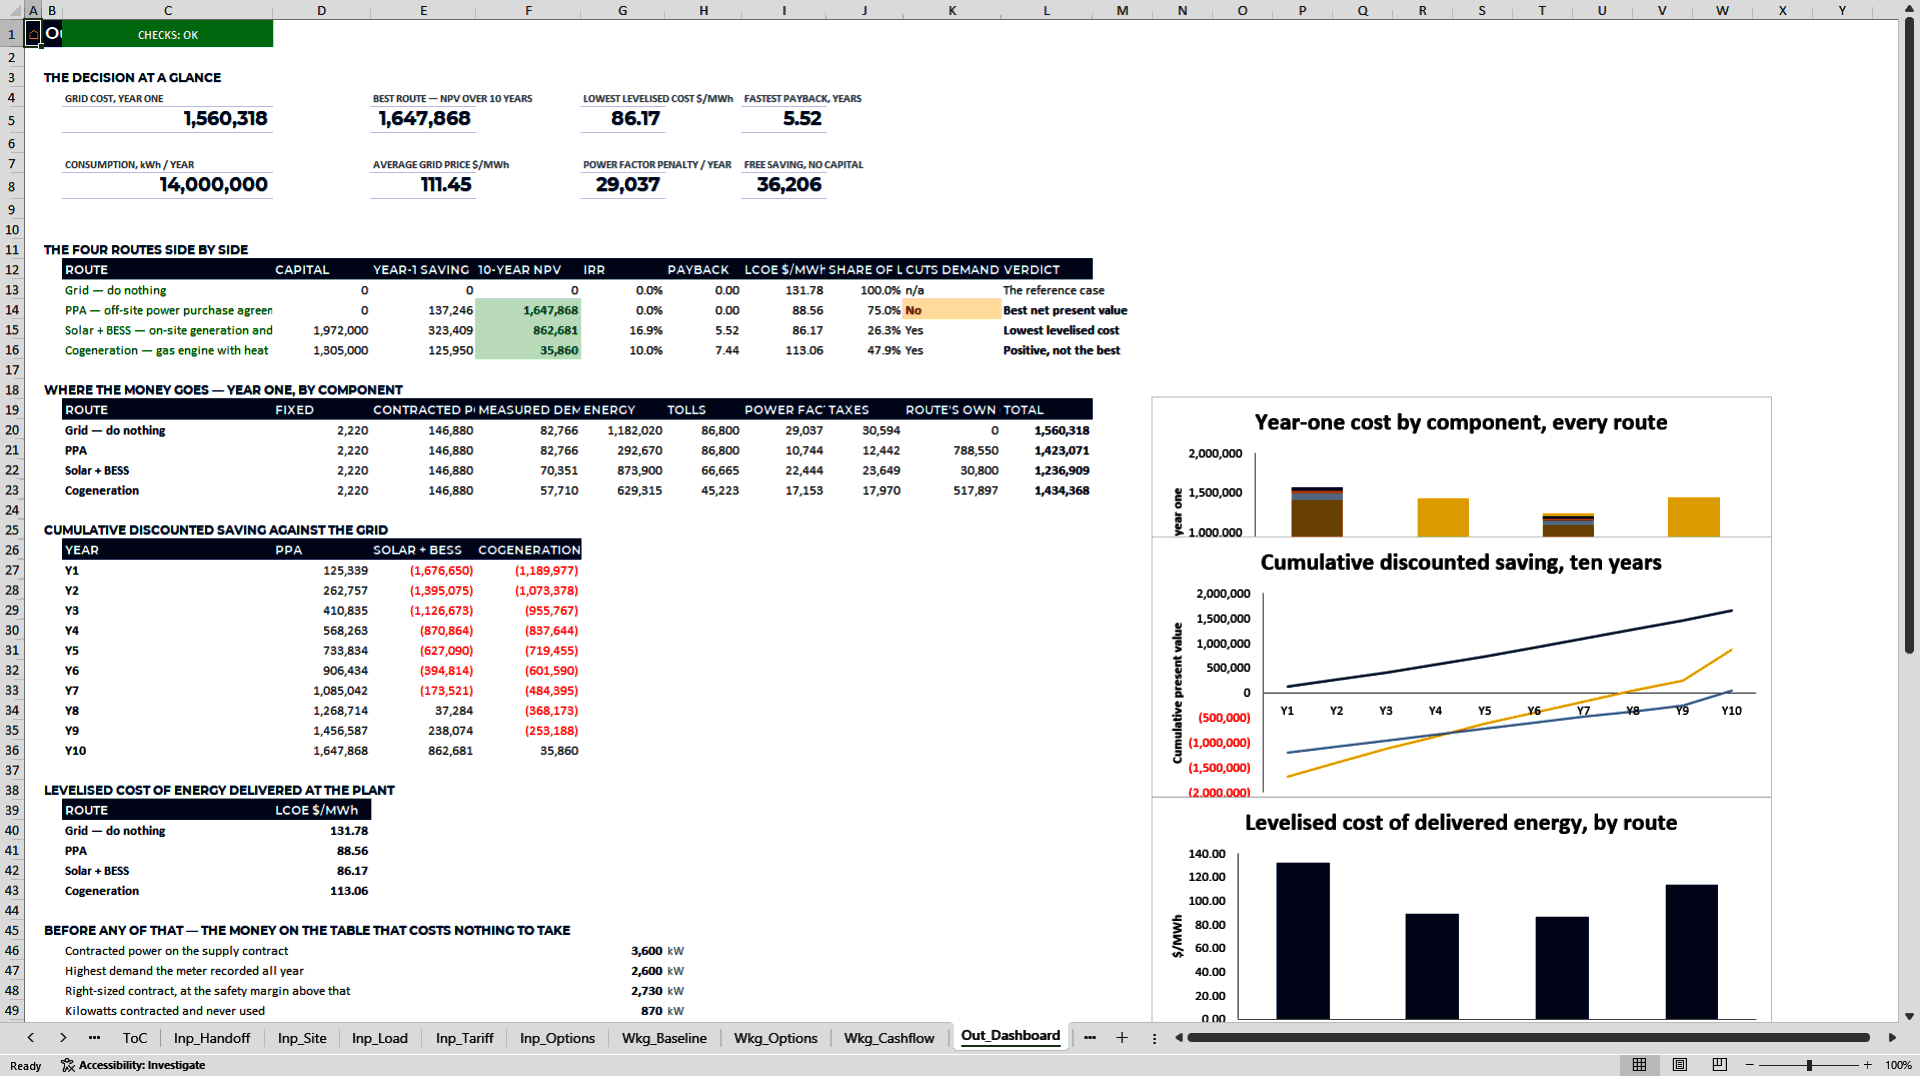
| Evidence from the demo | Result |
|—-|—-:|
| Full-year tariff reconciliation gap | 0.05% |
| Worst monthly reconciliation gap | 1.12% |
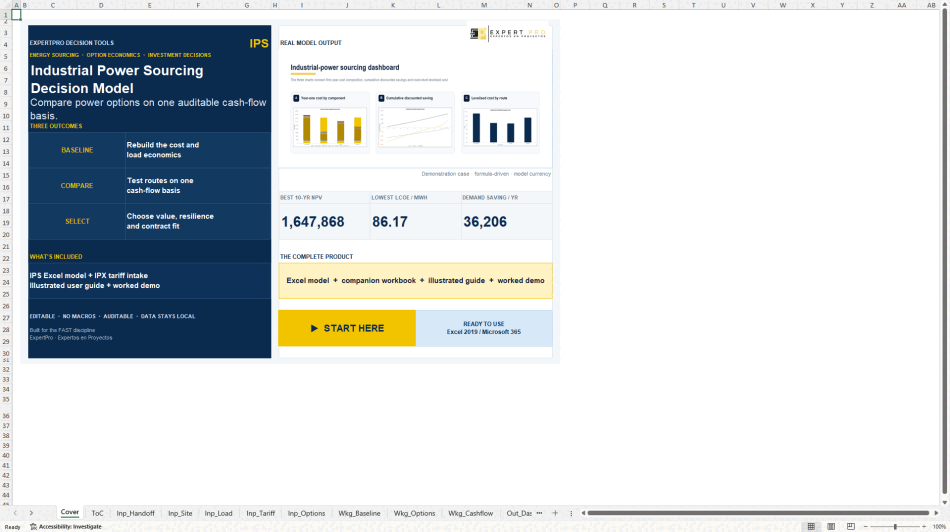
| PPA differential NPV over 10 years | USD 1,647,868 |
| PPA advantage over solar with storage | USD 785,188 |
| Solar-with-storage LCOE | USD 86.2/MWh |
| Grid LCOE | USD 131.8/MWh |
| Solar-with-storage capital requirement | USD 1,972,000 |
| Solar-with-storage payback | 5.5 years |
| Annual saving from contracted-power right-sizing | USD 36,206 |
| Present value of contracted-power right-sizing | USD 263,025 |
The demo also shows why the lowest levelised cost does not automatically determine the recommendation: solar with storage affects demand charges but requires capital, while the PPA needs no capital and displaces energy only. The model makes that trade-off visible.
## Built for Trust
• Built to FAST modelling standard 02c and the publisher's house rules.
• No macros, volatile functions, external links or hidden sheets.
• 516 named ranges and 63 named verifications across the two workbooks.
• Four checks confirm that the sourcing model uses the tariff structure reconciled in the companion workbook.
• Every input carries a unit, source and status; benchmark bands carry a source and the month set.
• A frozen run date, visible date row and explicit discount-factor row make timing and valuation logic traceable.
• Data remains in the local Excel files; inputs are unprotected for review and adaptation.
## Who It Is For
• CFOs, finance directors and investment committees reviewing long-term power commitments.
• Procurement and energy managers comparing utility supply, PPAs and on-site alternatives.
• Plant and operations leaders challenging demand charges and contracted capacity.
• Corporate finance, transaction and energy advisers building a buyer-side comparison.
Typical uses include validating a developer proposal, reconstructing the current tariff baseline, screening four sourcing routes, challenging contracted-power levels and preparing a board or investment-committee recommendation.
## Honest Limitations
• This is not a project-finance model: it does not size debt, sculpt coverage ratios or model an equity waterfall.
• It is not an hourly dispatch simulation; it uses monthly readings and four time blocks.
• It does not simulate solar yield from irradiance data; specific yield is an input.
• It does not include a tariff database. Local tariff rules and rates must be entered by the user.
• It does not model wholesale-market battery arbitrage.
• It does not perform engineering design, permitting, grid-connection analysis or technical due diligence, and it is not a substitute for professional engineering, tax, legal or investment advice.
## Frequently Asked Questions
### 1. What information do I need to start?
Prepare 12 monthly electricity invoices, consumption by available time block, measured and contracted demand, the applicable tariff rules, and the commercial and technical assumptions for each route you want to test.
### 2. Can I use the model outside the United States?
Yes, provided you can represent the local tariff through the model's parameterised structure. It does not depend on a United States tariff database, but you remain responsible for entering and validating local rules, taxes and rates.
### 3. Does it evaluate solar and battery dispatch hour by hour?
No. The model is a screening and decision-support tool using monthly readings and four time blocks. Detailed dispatch, yield and engineering work should follow separately for shortlisted options.
### 4. Can I change the assumptions and formulas?
Yes. Inputs are unprotected, formulas are visible and the workbooks are designed for audit and adaptation. Preserve a clean master copy before making structural changes.
### 5. Does it contain macros?
No. The workbooks contain no macros, volatile functions, external links or hidden sheets.
### 6. Which versions of Excel are supported?
The package is designed for Microsoft Excel 2019 and Microsoft 365 desktop.
### 7. Is a completed example included?
Yes. Both workbooks open with the industrial-plant demo populated, and the illustrated manual explains the workflow and interpretation before you replace the example data.
## Put Every Power Option on the Same Buyer-Side Baseline
Choose the Industrial Power Sourcing package when you need to challenge a proposal, compare four routes consistently and show decision-makers exactly where the economics, risks and assumptions differ.
Got a question about the product? Email us at support@flevy.com or ask the author directly by using the "Ask the Author a Question" form. If you cannot view the preview above this document description, go here to view the large preview instead.
Source: Best Practices in Solar Energy, Integrated Financial Model Excel: Industrial Power Sourcing: Ppa and Solar Excel Model Excel (XLSX) Spreadsheet, ExpertPro Consulting
ABOUT THE AUTHOR

ExpertPro is an advisory firm that builds the financial and decision infrastructure behind capital projects. Our work sits at the intersection of project finance, engineering economics and data: we model, stress-test and document infrastructure investments so that sponsors, lenders and investment committees can decide on evidence rather than intuition.
The practice is led by Eduard Kofman, .
... [read more]
Ask the Author a Question
You must be logged in to contact the author.




























