
Heavy Equipment Manufacturer 10-Year Financial Model – Excel XLSX
Excel (XLSX)
BENEFITS OF THIS DOWNLOADABLE EXCEL DOCUMENT
- Provides a fully integrated 10-year financial framework purpose-built for valuing, financing, and presenting a Heavy Equipment Manufacturing business at institutional standard.
- Delivers a comprehensive 3-statement model covering every operational, production, and capital structure dimension a heavy equipment manufacturer needs to plan, pitch, and exit with confidence.
- Gives investment bankers, PE sponsors, CFOs, and industrial management teams the exact financial infrastructure to stress-test margins, model debt capacity, and demonstrate free cash flow generation across a full decade of forecasts.
INTEGRATED FINANCIAL MODEL EXCEL DESCRIPTION
Curated by McKinsey-trained Executives
🚚 HEAVY EQUIPMENT MANUFACTURING CO. – 10-Year Integrated 3-Statement Financial Model
Build the exact financial infrastructure that top-tier investment banks, private equity sponsors, industrial holding companies, and strategic acquirers use to value, stress-test, and present a Heavy Equipment Manufacturing business – modeled with the precision, depth, and professional structure that institutional investors, lenders, and sophisticated buyers demand on day one.
Whether you're a PE sponsor underwriting a heavy equipment manufacturer acquisition, a CFO preparing for a bank syndication or debt refinancing, a corporate development team running a buy-side M&A process, an investment banker pitching an industrial company sell-side mandate, a founder or owner-operator planning a strategic exit, or a private equity-backed management team preparing for an LP review or add-on acquisition – this fully integrated 10-Year 3-Statement Financial Model gives you the exact financial engine to plan, pitch, finance, and exit a heavy equipment manufacturing business with complete institutional credibility.
💡 What's Inside
This model covers every financial dimension of running and scaling a Heavy Equipment Manufacturing Company – from product line revenue and production economics through a decade of operational scaling, margin expansion, capital investment, debt management, and free cash flow generation. Built on Financial Modeling World Cup best practices, it's fully dynamic, cross-linked across all tabs, and ready to customize for your specific equipment segments, production footprint, and capital structure.
📥 Inputs
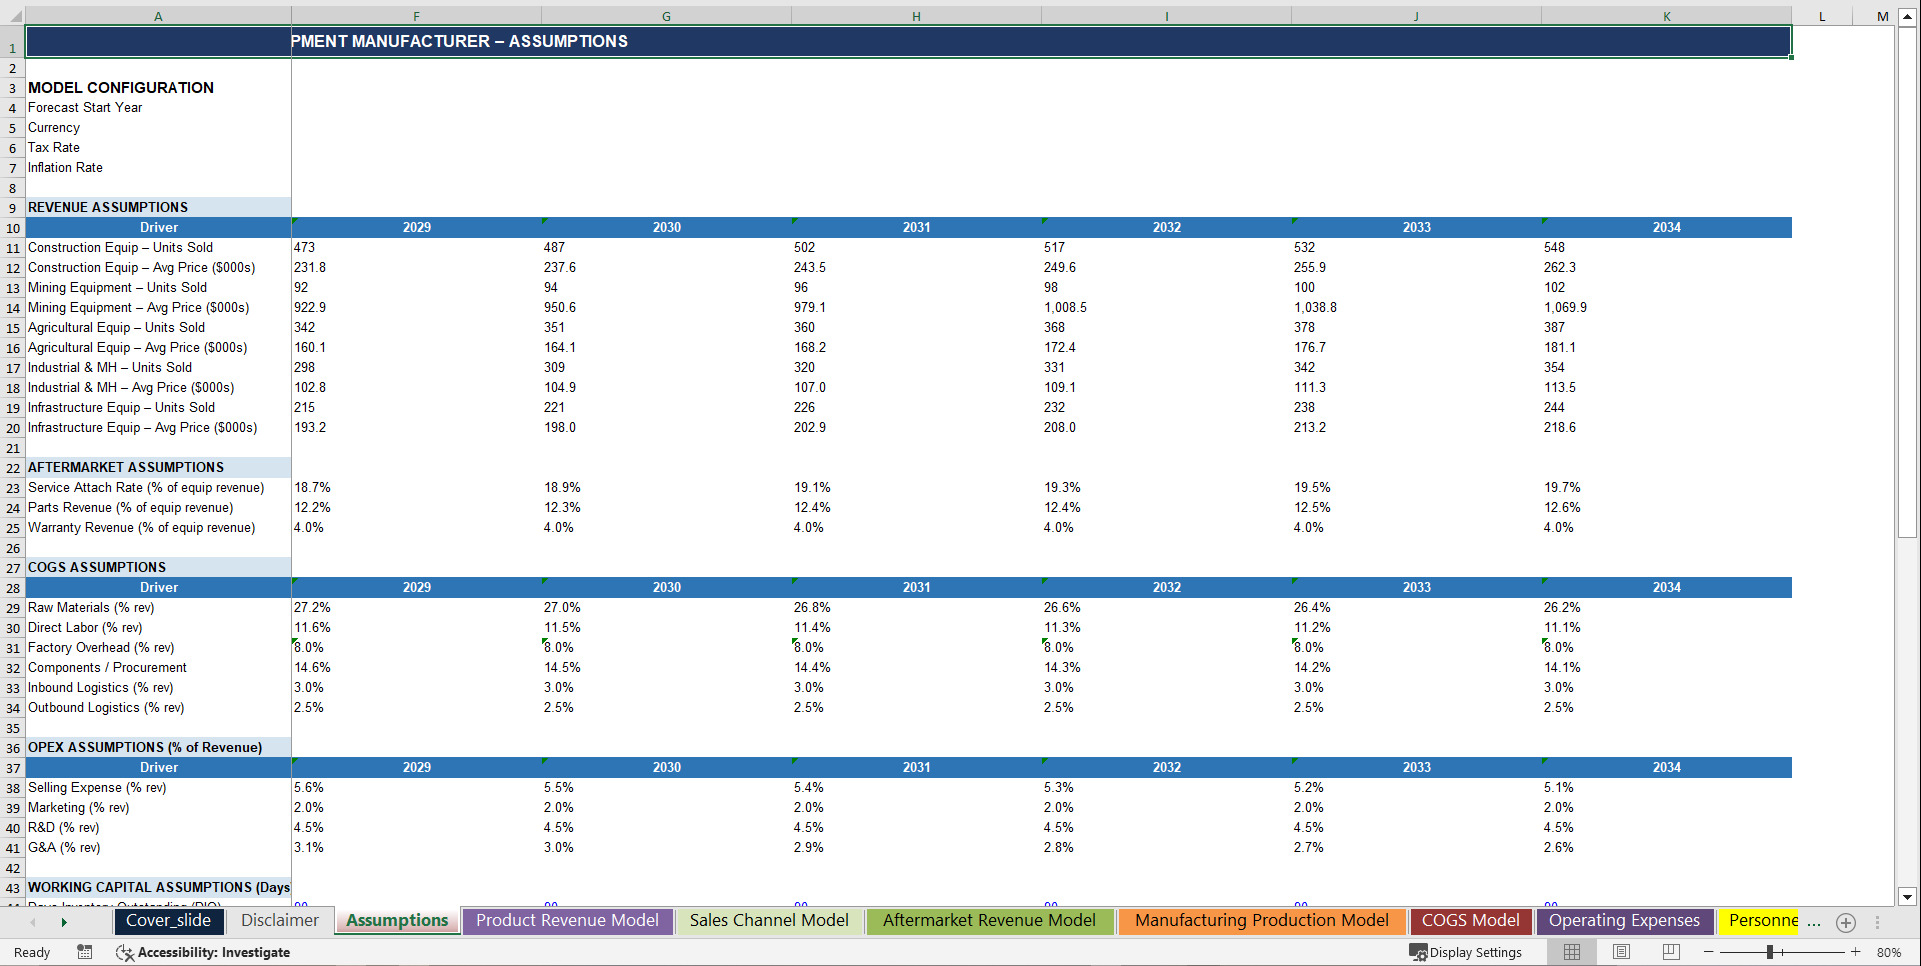
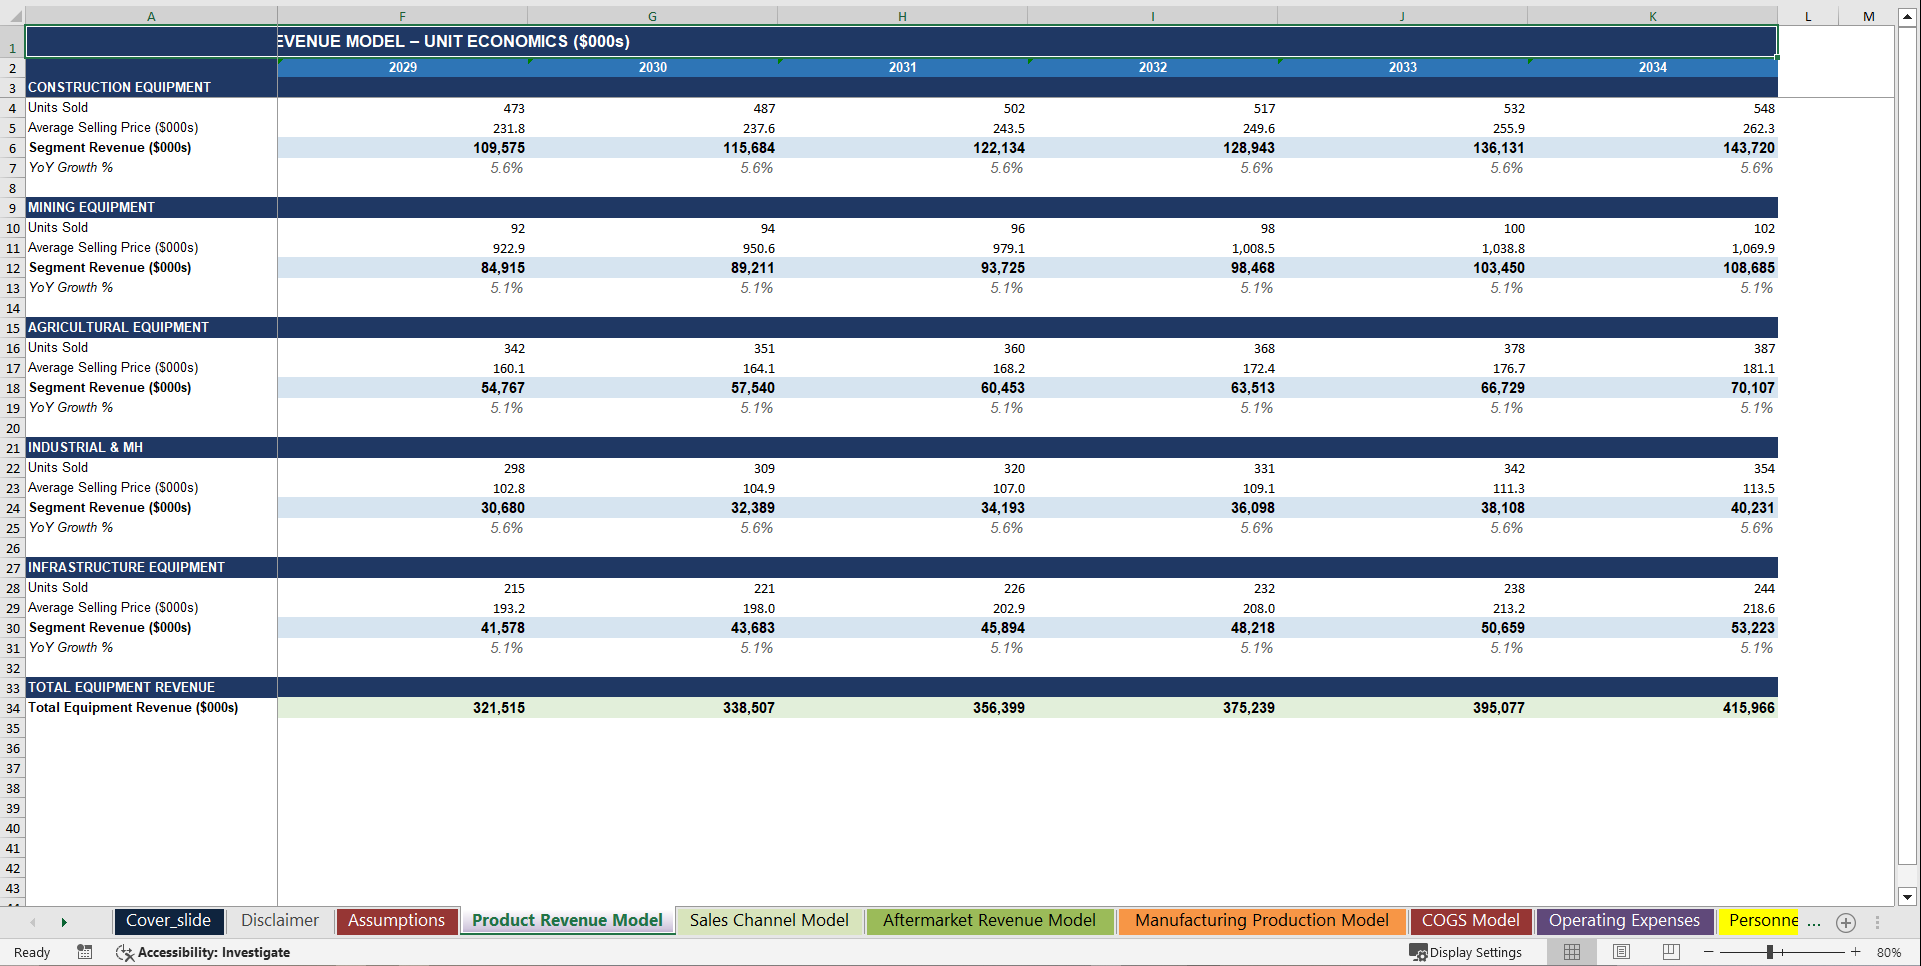
• 🏭 Product Line Revenue Engine with Unit Economics – Construction Equipment, Mining Equipment, Agricultural Equipment, Industrial & Material Handling Equipment, and Infrastructure Equipment – each segment modeled with individual unit volume, average selling price, annual price escalation, and unit growth rate compounding through the forecast – total equipment revenue and total units sold rolling forward automatically – the exact product-level granularity any industrial company acquirer, credit committee, or strategic planning team interrogates on page one of their commercial due diligence checklist
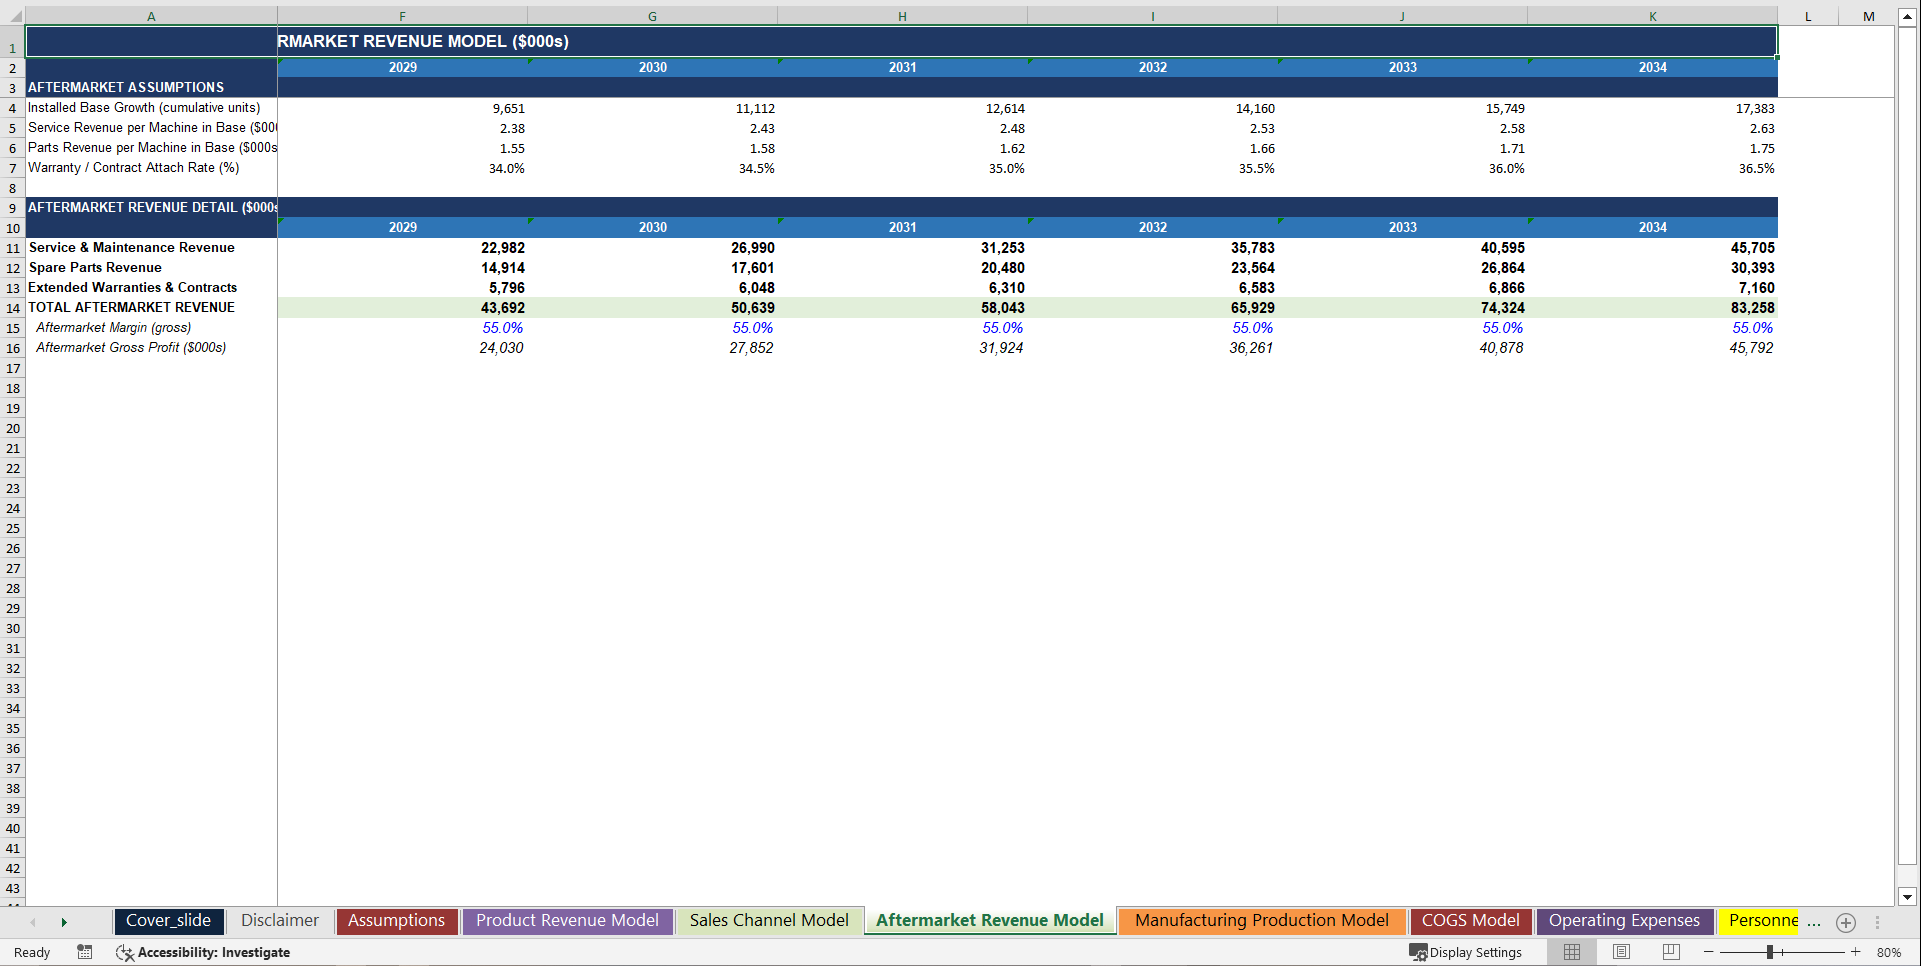
• 🔧 Aftermarket Revenue Model with Three Income Streams – Spare Parts & Components sized against equipment revenue with configurable attachment rate, Service & Maintenance Contracts driven by units sold and service attach rate, and Extended Warranties modeled per unit with configurable warranty revenue per machine – total aftermarket revenue tracked as a percentage of equipment revenue annually – the exact aftermarket economics any industrial sector PE sponsor, strategic buyer, or equipment finance lender needs to validate the durability and predictability of your recurring revenue base
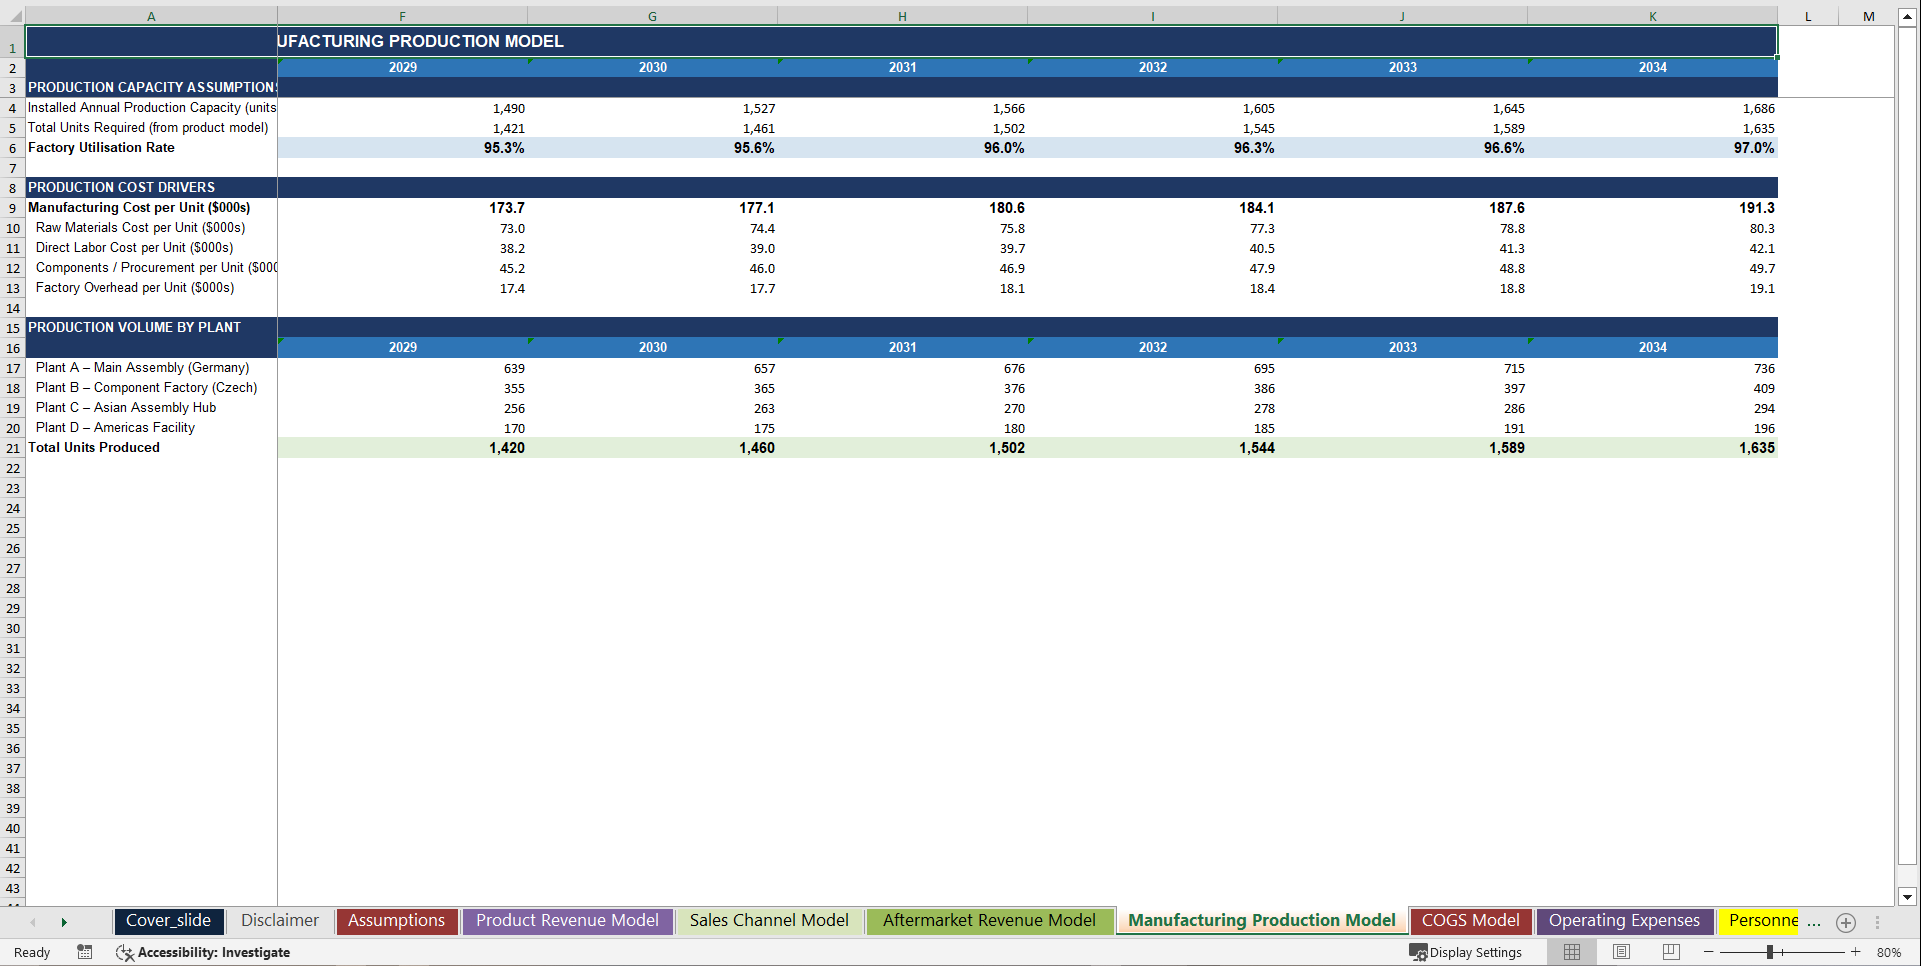
• 🏗️ Manufacturing Production Model with Capacity Planning – Total units produced linked to the revenue model, factory utilisation rate ramping across the forecast, theoretical capacity calculated per year, and production cost analysis with average manufacturing cost per unit broken down by materials, labour, and overhead – Assembly Plant Domestic, Component Factory, International Assembly, and Fabrication Facility volumes tracked separately – plus order backlog in weeks, backlog value, delivery lead time, and on-time delivery rate – the exact operational intelligence any industrial company lender, operational due diligence team, or strategic acquirer needs to evaluate your factory footprint
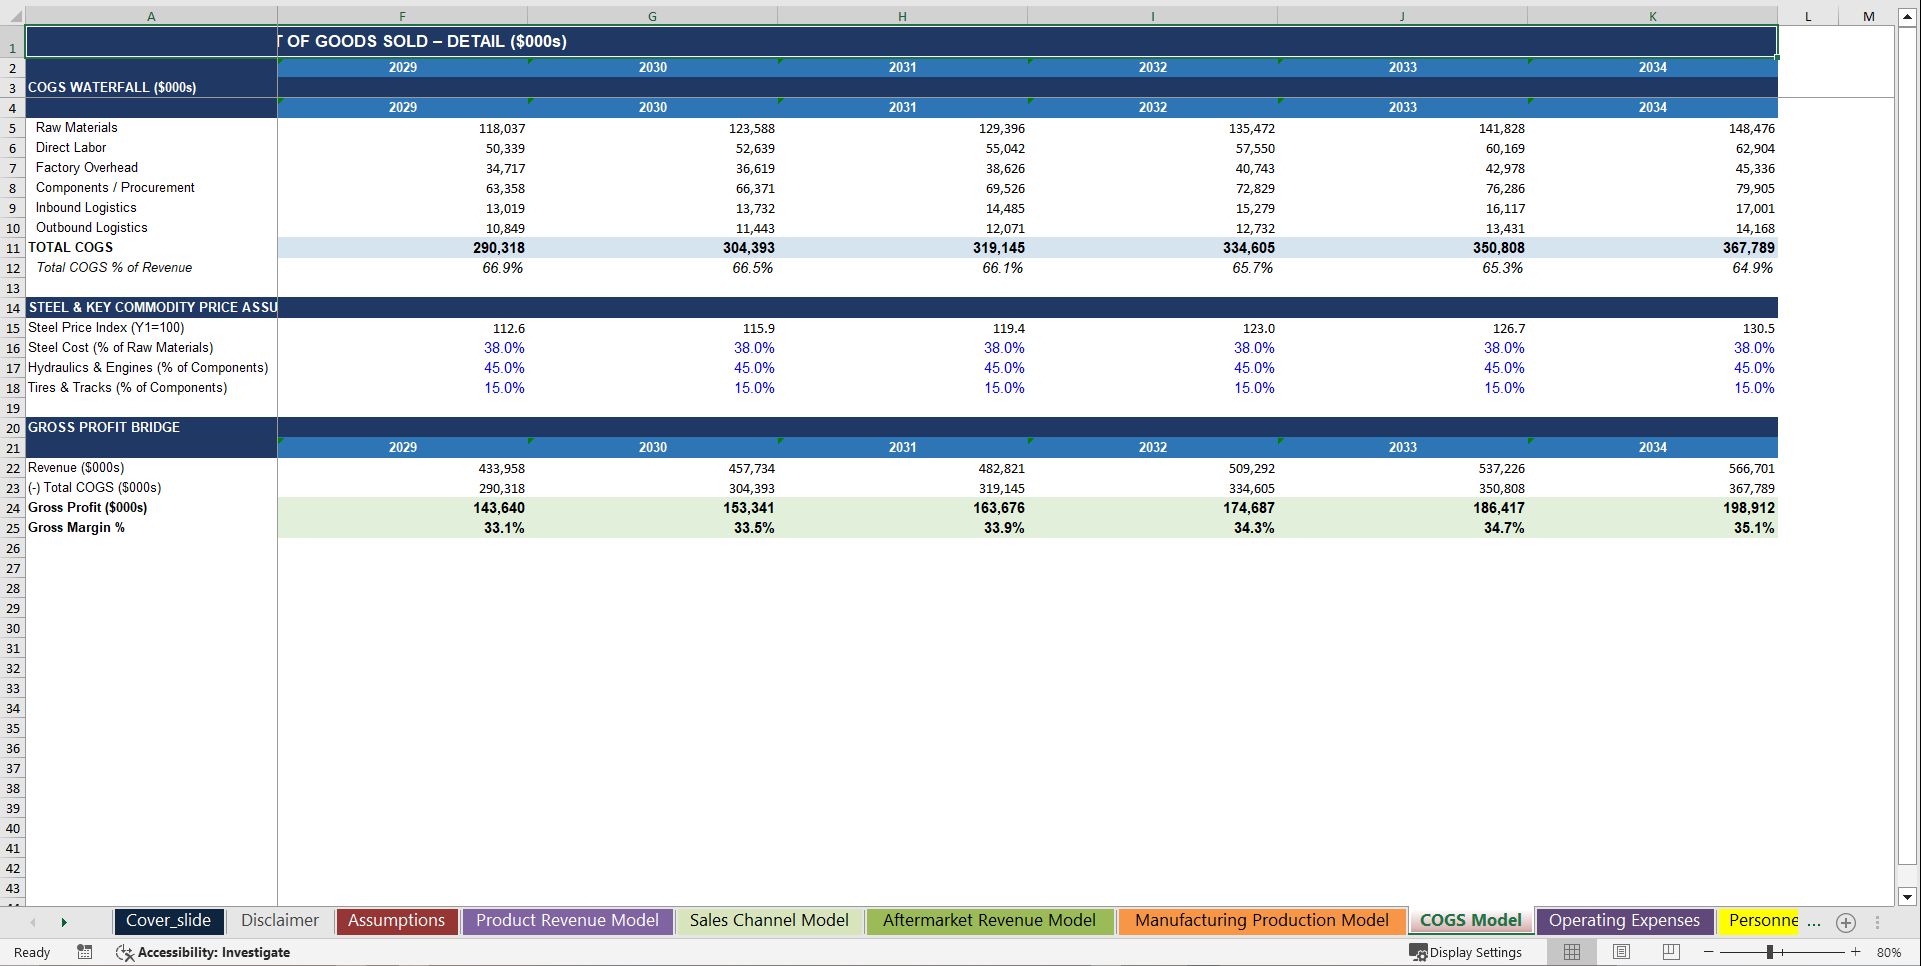
• 💰 Cost of Goods Sold Model with Full Cost Category Breakdown – Gross Margin percentage improving linearly across the forecast as procurement efficiencies and scale economics compound – COGS decomposed into Raw Materials, Direct Labour, Factory Overhead, Component Procurement, and Logistics – COGS percentage trend by category, cost per unit, gross profit per unit, scrap and rework rate, and production yield rate tracked annually – the complete manufacturing cost transparency any investment bank, equity research analyst, or industrial company M&A advisor demands from a credible sell-side financial model
• 📊 Sales Channel Model with Dealer Network Economics – Dealer Network, Direct Sales to Large Projects, Leasing & Financing Programs, and International Export – each channel modeled as a percentage of equipment revenue with individual gross margin rates – the exact channel economics any distribution-heavy industrial business acquirer, commercial due diligence provider, or debt underwriter needs to evaluate your route-to-market resilience
• 👥 Multi-Role Personnel Plan with Full Compensation Stack – Executive & Management, Engineering & R&D, Manufacturing & Production, Supply Chain & Logistics, Sales & Marketing, and Finance, HR, Legal & IT – each department with individual headcount ramping annually at configurable growth rates, base salary by role, annual salary increase compounding throughout the forecast, and benefits load – Manufacturing sub-roles broken down by Assembly Workers, Machine Operators, Welders & Fabricators, and Quality Control Technicians – productivity metrics including Revenue per Employee, Gross Profit per Employee, Labour Cost per Employee, and Attrition Rate tracked across all years – the exact workforce economics any industrial company PE sponsor, lender, or acquirer needs to underwrite your labour cost base with precision
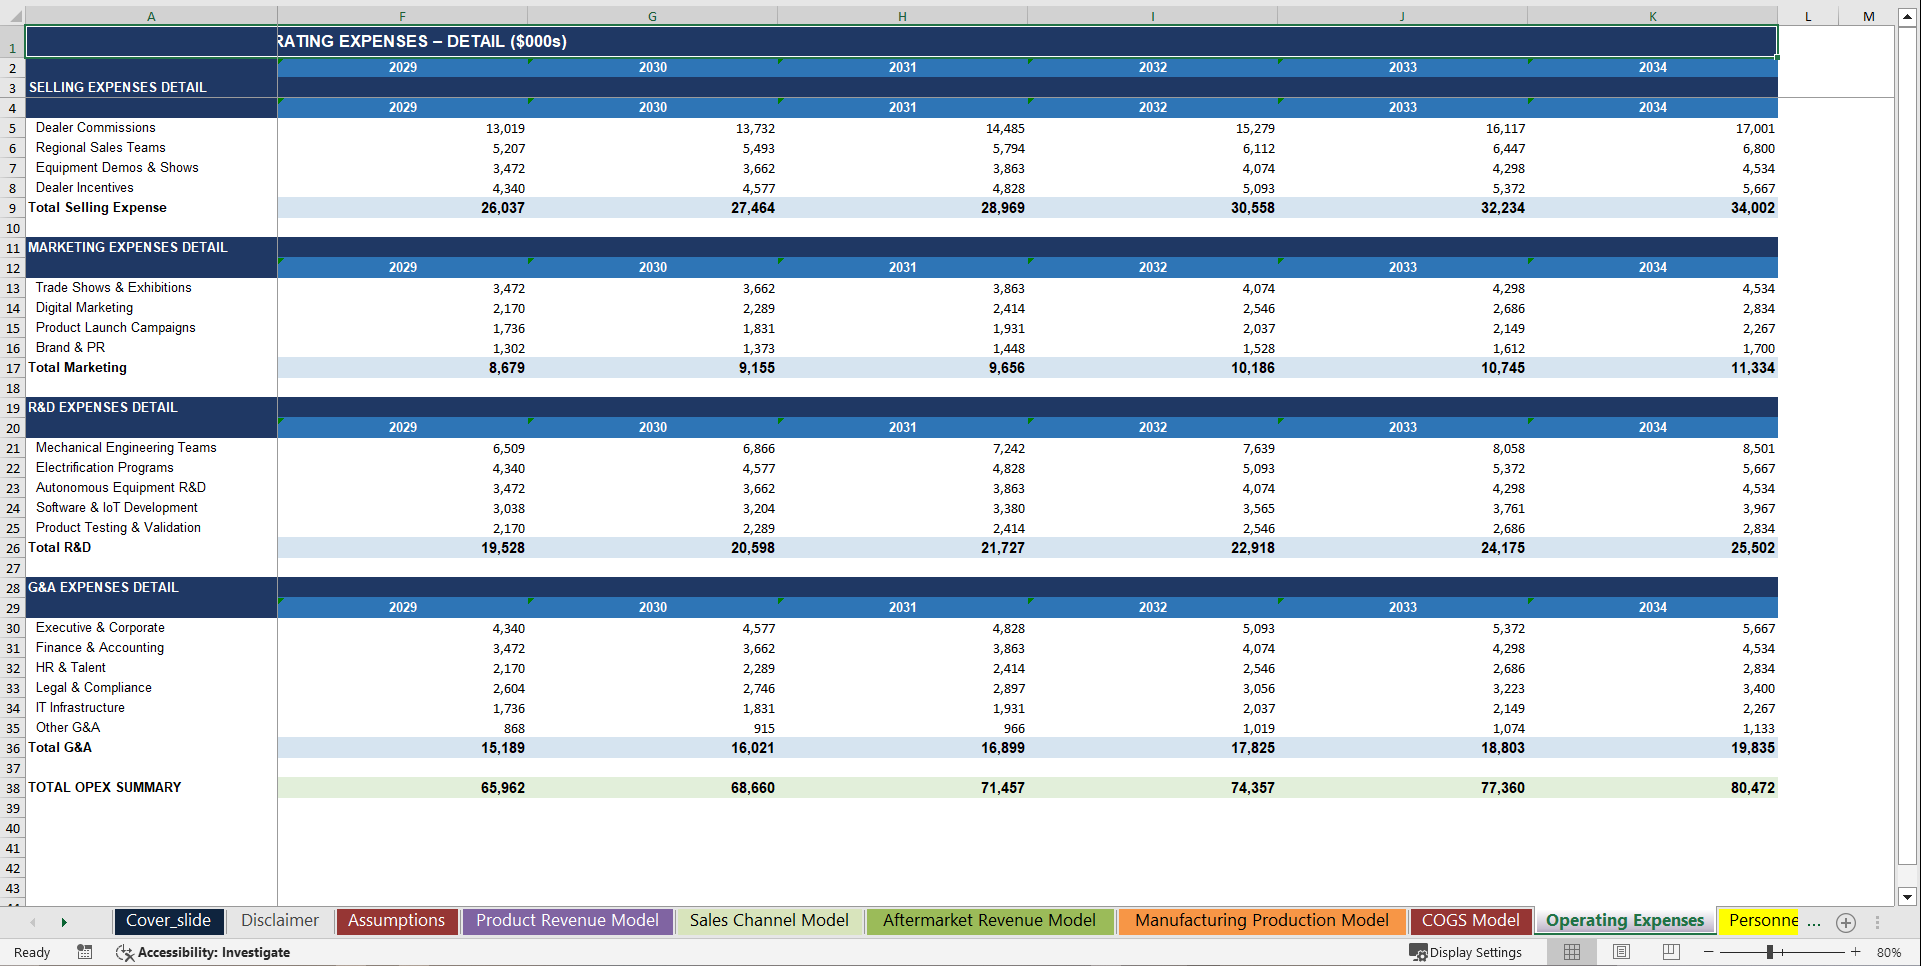
• 🔩 Operating Expense Engine with Granular Line Items – Selling Expenses broken down by Dealer Commissions, Regional Sales Teams, and Demos & Travel – R&D broken down by Engineering & Product Development, Electrification Programs, and Autonomous Equipment R&D – G&A covering executive compensation, finance, HR, IT, and legal – each line inflating at the configurable annual rate – OpEx efficiency metrics including Selling Expense Ratio, R&D Intensity, G&A Ratio, and OpEx per Employee calculated annually – every overhead dollar visible, defensible, and auditable
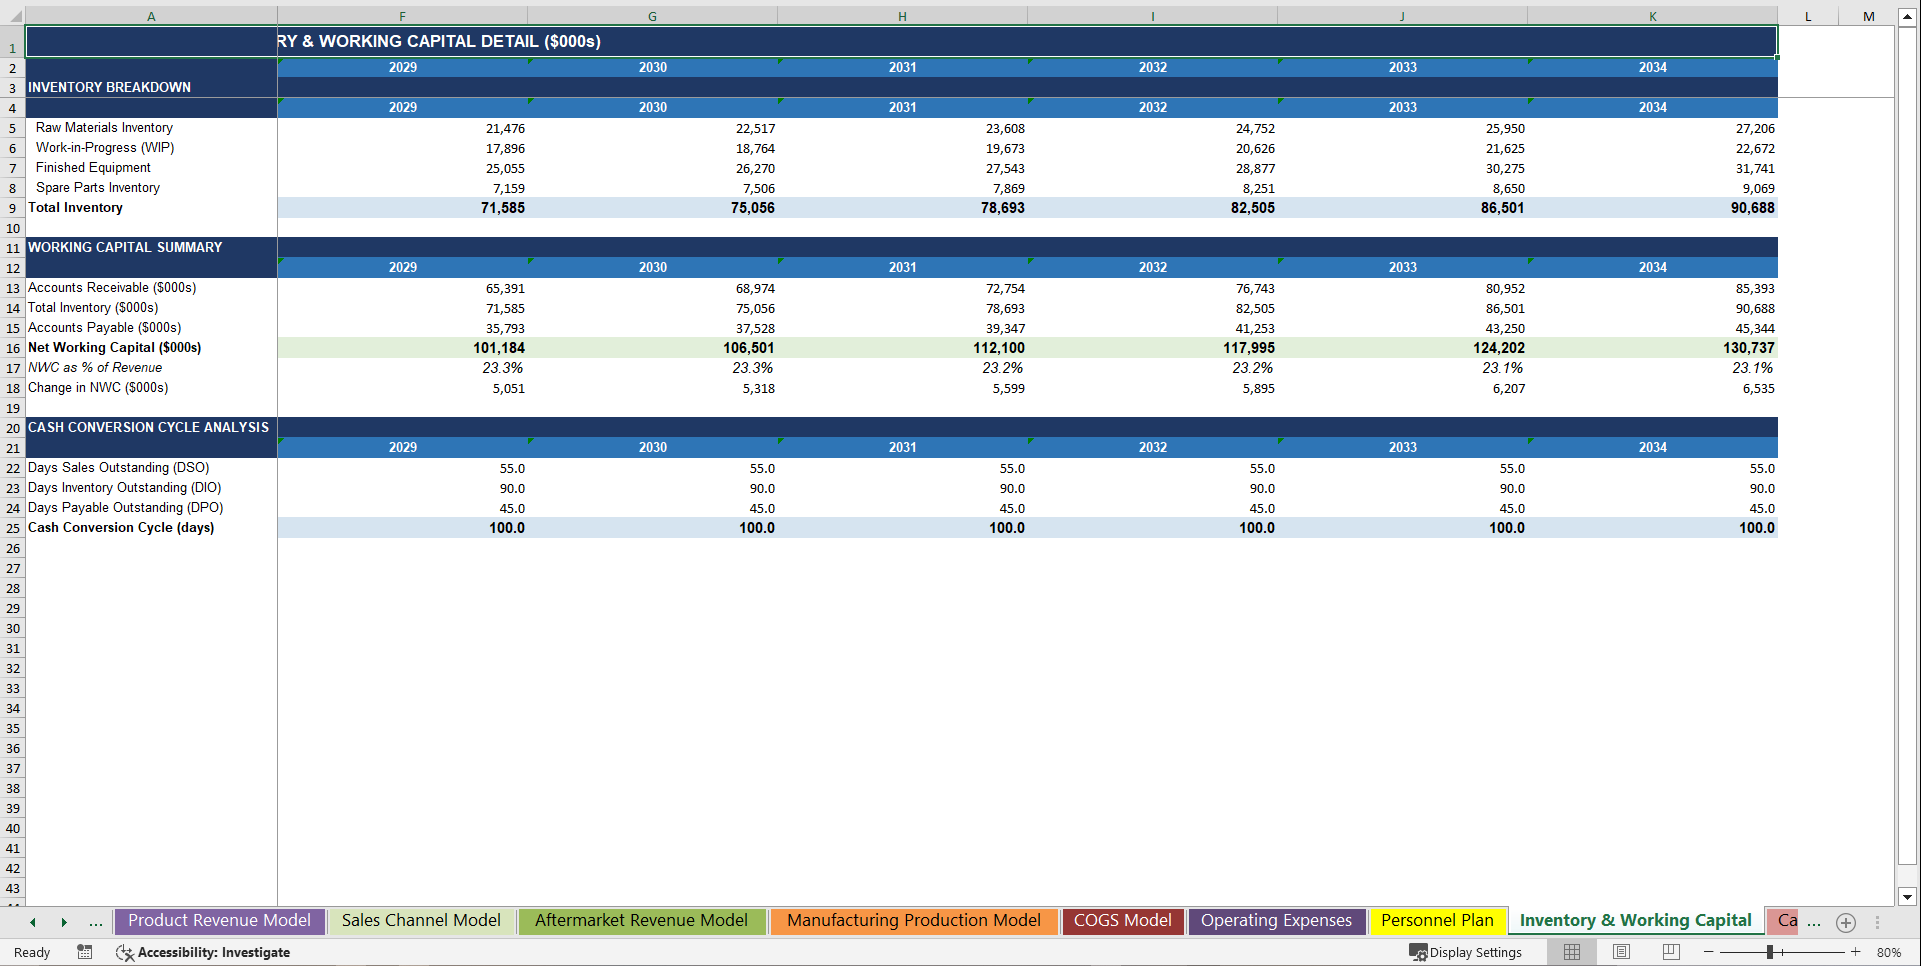
• 📦 Working Capital Model with Full Inventory Architecture – Accounts Receivable sized against configurable DSO, Inventory sized against configurable DIO decomposed into Raw Material, Work-in-Progress, Finished Goods, and Spare Parts sub-categories, Accounts Payable sized against configurable DPO – Cash Conversion Cycle, Inventory Turnover, AR Turnover, and AP Turnover tracked annually – the exact working capital intensity any industrial company lender, leveraged buyout model, or trade finance provider needs to evaluate your cash cycle with precision
• 🏦 CapEx Schedule with Asset Class Breakdown and Return Analysis – Maintenance CapEx as a percentage of revenue, Growth CapEx for factories, robotics, and assembly line automation growing at a configurable rate, Technology & ERP Systems investment separately modeled – Growth CapEx decomposed into Manufacturing Equipment, Facilities & Warehouses, and Technology & Automation Systems – CapEx Intensity, Return on CapEx, and FCF before Growth CapEx tracked annually – the complete capital investment programme any industrial company credit committee, leveraged finance desk, or infrastructure equity investor demands to validate your asset base
• 📉 Depreciation Schedule with Multi-Asset-Class Roll-Forward – Straight-line PP&E depreciation on opening balance across configurable useful life – D&A decomposed by Manufacturing Equipment, Facilities & Buildings, Technology & IT Systems, and Vehicles & Fleet – Intangible Amortisation broken down by Patents & Technology, Software & ERP, and Customer Relationships – the full asset base transparency any industrial company auditor, tax advisor, or M&A due diligence team needs to validate your depreciation policy
• 💳 Debt Schedule with Leverage and Coverage Metrics – Term loan roll-forward with opening balance, annual repayment, closing balance, and interest on opening balance – Revolving Credit Facility with drawn and available capacity tracked annually – leverage metrics including Net Debt / EBITDA, Interest Coverage Ratio, Debt / (Debt + Equity), and Annual Debt Service – covenant compliance trackable across all forecast years – the exact debt management transparency any leveraged finance provider, syndicated lending desk, or credit rating agency demands from an industrial company financial model
📤 Outputs
• 📈 10-Year Fully Integrated 3-Statement Financial Model – Income Statement, Balance Sheet, and Cash Flow Statement fully cross-linked and auto-balancing across all years – revenue growing steadily on realistic industrial assumptions, gross margin expanding year on year, EBITDA margin improving throughout the forecast, and Free Cash Flow positive from Year 1 – every number traceable to its operational and manufacturing driver – the financial backbone any heavy equipment company needs to present to a bank syndicate, private equity sponsor, or strategic acquirer with complete institutional confidence
• 🎯 Income Statement with Full Margin Suite and KPI Layer – From equipment revenue and aftermarket through COGS, selling expenses, marketing, R&D, G&A, D&A, interest, and tax – EBITDA, EBIT, Pre-Tax Income, and Net Income with full margin percentages – plus a KPI layer covering EBITDA Margin, Return on Invested Capital, Net Debt / EBITDA, Revenue per Employee, CapEx Intensity, FCF Margin, and Free Cash Flow – the complete P&L transparency any PE sponsor, debt provider, or strategic buyer demands from an industrial company
• 🏆 Comprehensive Balance Sheet with Auto-Balancing Verification – Cash tied to the Cash Flow Statement, Accounts Receivable, Inventory, Prepaid Expenses, Other Receivables, Deferred Revenue, Net PP&E, Intangibles, Goodwill, Right-of-Use Assets, Accounts Payable, Accrued Expenses, Warranty Reserve, Current Portion of LTD, Lease Liabilities, Pension Liabilities, Deferred Tax, Long-Term Debt, Paid-In Capital, and Retained Earnings – Assets = Liabilities + Equity confirmed for every year with a highlighted balance check row – the audit-ready balance sheet any industrial company lender, institutional auditor, or M&A advisor needs to see
• 🔄 Cash Flow Statement – Full Indirect Method with Complete Line-Item Detail – Net Income, D&A add-back, Stock-Based Compensation, Other Non-Cash Items, Deferred Revenue Change, Working Capital movements for Receivables, Inventory, Payables, and Other WC – Capital Expenditures, Asset Disposal Proceeds, Acquisitions – Debt Repayment, Dividends Paid, Share Repurchases – Operating Cash Flow, Investing Cash Flow, Financing Cash Flow, Net Change in Cash, Closing Cash Balance, and Free Cash Flow – every cash movement visible, traceable, and defensible
• 📐 Sensitivity & Scenario Engine with Colour-Coded Heat Maps – EBITDA sensitivity matrix across Volume Index × Gross Margin with green/amber/red heat map – Net Income sensitivity across Interest Rate × Debt Level – full three-scenario comparison across Base Case, Recession, and High Infrastructure Spending covering Revenue, Gross Margin, EBITDA Margin, FCF, and Net Margin – instant scenario data points giving you complete downside visibility without touching a single formula
• 🎨 Executive Dashboard with Live Charts and KPI Tiles – Revenue by Segment stacked bar chart, EBITDA & Net Income clustered bar chart, Margin Trends line chart, Free Cash Flow vs CapEx bar chart, Headcount Growth line chart, and Long-Term Debt decline line chart – plus KPI tiles covering Total Revenue, Gross Margin %, EBITDA, EBITDA Margin %, Net Income, Net Margin %, and Free Cash Flow – all charts plotting live from embedded data – the boardroom-ready dashboard any industrial company management team needs to present to a bank, PE sponsor, or board of directors with complete visual impact
🏆 Why This Model Stands Out
✅ Fully integrated across all 17 tabs – change one assumption and formulas update instantly across every sheet – unit volume flows to equipment revenue, which flows to aftermarket and channel economics, which flows to EBITDA, which flows to retained earnings, which balances the equity stack
✅ Private equity and lender-ready from day one – structured and formatted to answer the exact questions any industrial company PE sponsor, leveraged finance provider, or strategic acquirer asks on page one of their due diligence process: What does the margin expansion story look like over the forecast horizon? What is the FCF conversion rate at peak utilisation? How does the debt service coverage ratio hold up in a demand downturn? What is the revenue per employee trajectory as the business scales? What does the installed base look like in the outer years of the forecast?
✅ Heavy equipment industry-realistic – built around how industrial manufacturers actually generate and protect economics: aftermarket attachment rates compounding with the installed base, margin expansion unlocked through procurement discipline and factory automation, working capital intensity reflecting genuine heavy equipment inventory cycles and extended receivables, CapEx phased to match capacity expansion – not generic manufacturing model assumptions with an equipment label applied
✅ Institutional colour-coding throughout – blue inputs, black formulas, green cross-sheet links – Financial Modeling World Cup colour conventions used throughout so any investment bank analyst, PE associate, credit committee member, or M&A advisor can open it and immediately understand the logic, trace every number to its source, and audit every formula without a guide
✅ Fully unlocked – no protected sheets, no black-box formulas, no hidden logic – every assumption visible, every formula auditable – present it to any bank syndicate, private equity data room, strategic buyer's financial advisor, or institutional lender with complete confidence
📋 Model Structure – 17 Fully Integrated Tabs
• Dashboard – Live charts plus KPI tiles plus multi-year summary table covering all key revenue, margin, and operational metrics – auto-updating from Assumptions
• Assumptions – Every model input in one place – blue-coded for instant editing – the single source of truth for all 17 sheets
• Income Statement – Full P&L from equipment revenue through net income – EBITDA, EBIT, margins, and KPI layer
• Balance Sheet – Full asset, liability, and equity stack – auto-balancing check every year
• Cash Flow – Full indirect method – OCF, investing, financing, FCF, and ending cash tied to Balance Sheet
• Product Revenue – Five equipment segments modeled by units and price – aftermarket income streams – channel mix breakdown
• Sales Channel Model – Dealer, Direct, Leasing, and Export revenue and margin by channel
• Aftermarket Revenue Model – Parts, service contracts, warranties, and installed base compounding year on year
• Manufacturing Model – Capacity utilisation, throughput, cost per unit, order backlog, and delivery metrics
• COGS Model – Gross margin ramp, COGS breakdown by five cost categories, and manufacturing efficiency ratios
• OpEx – Selling, Marketing, R&D, and G&A with sub-line detail and efficiency metrics
• Personnel Plan – Six departments, manufacturing role detail, headcount growth, and productivity KPIs
• Working Capital – AR, Inventory, and AP driven by DSO, DIO, and DPO – full inventory sub-category breakdown – cash cycle metrics
• CapEx Schedule – Maintenance, Growth, and Technology CapEx – asset class breakdown – return analysis
• Depreciation – Straight-line PP&E roll-forward – D&A by asset class – intangible amortisation detail
• Debt Schedule – Term loan and revolver – leverage and coverage metrics – covenant tracking across all forecast years
• Sensitivity Analysis – EBITDA heat map – net income matrix – three-scenario comparison across Base, Recession, and High Infrastructure Spending
Key Words:
Strategy & Transformation, Growth Strategy, Strategic Planning, Strategy Frameworks, Innovation Management, Pricing Strategy, Core Competencies, Strategy Development, Business Transformation, Marketing Plan Development, Product Strategy, Breakout Strategy, Competitive Advantage, Mission, Vision, Values, Strategy Deployment & Execution, Innovation, Vision Statement, Core Competencies Analysis, Corporate Strategy, Product Launch Strategy, BMI, Blue Ocean Strategy, Breakthrough Strategy, Business Model Innovation, Business Strategy Example, Corporate Transformation, Critical Success Factors, Customer Segmentation, Customer Value Proposition, Distinctive Capabilities, Enterprise Performance Management, KPI, Key Performance Indicators, Market Analysis, Market Entry Example, Market Entry Plan, Market Intelligence, Market Research, Market Segmentation, Market Sizing, Marketing, Michael Porter's Value Chain, Organizational Transformation, Performance Management, Performance Measurement, Platform Strategy, Product Go-to-Market Strategy, Reorganization, Restructuring, SWOT, SWOT Analysis, Service 4.0, Service Strategy, Service Transformation, Strategic Analysis, Strategic Plan Example, Strategy Deployment, Strategy Execution, Strategy Frameworks Compilation, Strategy Methodologies, Strategy Report Example, Value Chain, Value Chain Analysis, Value Innovation, Value Proposition, Vision Statement, Corporate Strategy, Business Development, Business plan pdf, business plan, PDF, Business Plan DOC, Business Plan Template, PPT, Market strategy playbook, strategic market planning, competitive analysis tools, market segmentation frameworks, growth strategy templates, product positioning strategy, market execution toolkit, strategic alignment playbook, KPI and OKR frameworks, business growth strategy guide, cross-functional strategy templates, market risk management, market strategy PowerPoint doc, guide, ebook, e-book ,McKinsey Change Playbook, Organizational change management toolkit, Change management frameworks 2025, Influence model for change, Change leadership strategies, Behavioral change in organizations, Change management PowerPoint templates, Transformational leadership in change, supply chain KPIs, supply chain KPI toolkit, supply chain PowerPoint template, logistics KPIs, procurement KPIs, inventory management KPIs, supply chain performance metrics, manufacturing KPIs, supply chain dashboard, supply chain strategy KPIs, reverse logistics KPIs, sustainability KPIs in supply chain, financial supply chain KPIs, warehouse KPIs, digital supply chain KPIs, 1200 KPIs, supply chain scorecard, KPI examples, supply chain templates, Corporate Finance SOPs, Finance SOP Excel Template, CFO Toolkit, Finance Department Procedures, Financial Planning SOPs, Treasury SOPs, Accounts Payable SOPs, Accounts Receivable SOPs, General Ledger SOPs, Accounting Policies Template, Internal Controls SOPs, Finance Process Standardization, Finance Operating Procedures, Finance Department Excel Template, FP&A Process Documentation, Corporate Finance Template, Finance SOP Toolkit, CFO Process Templates, Accounting SOP Package, Tax Compliance SOPs, Financial Risk Management Procedures.
NOTE: Our digital products are sold on an "as is" basis, making returns and refunds unavailable post-download. Please preview and inquire before purchasing. Please contact us before purchasing if you have any questions! This policy aligns with the standard Flevy Terms of Usage.
Got a question about the product? Email us at support@flevy.com or ask the author directly by using the "Ask the Author a Question" form. If you cannot view the preview above this document description, go here to view the large preview instead.
Source: Best Practices in Integrated Financial Model Excel: Heavy Equipment Manufacturer 10-Year Financial Model Excel (XLSX) Spreadsheet, SB Consulting
ABOUT THE AUTHOR
SB Consulting is dedicated to empowering businesses to communicate their ideas with impact. This consulting firm specializes in teaching organizations how to create effective corporate and management presentations. With training from top-tier global consulting firms, including McKinsey, BCG, and Porsche Consulting, extensive expertise in presentation design and ... [read more]
Ask the Author a Question
You must be logged in to contact the author.
