
Fast Moving Consumer Goods (FMCG) Company Financial Model – Excel XLSX
Excel (XLSX)
BENEFITS OF THIS DOWNLOADABLE EXCEL DOCUMENT
- Provides a complete financial framework for modeling, funding, and scaling a Fast Moving Consumer Goods business across a 10-year forecast horizon.
- Built for FMCG founders, CFOs, and investors who need an institutional-grade 3-statement model with full trade promotion, channel, and working capital architecture.
- Delivers a fully integrated, investor-ready CPG financial model covering every revenue, cost, and cash flow driver from gross-to-net waterfall to exit.
CONSUMER PACKAGED GOODS EXCEL DESCRIPTION
Curated by McKinsey-trained Executives
🛒 FMCG Financial Model | Integrated 3-Statement 10-Year Forecast
Turn your consumer goods operation into a fundable, bankable, investor-ready enterprise – modeled with institutional-grade precision used by the world's leading CPG, food & beverage, and household products manufacturers.
Whether you're a consumer goods founder raising Series B growth capital, a private equity firm evaluating a CPG acquisition, a CFO preparing for a leveraged buyout or debt refinancing, an investment banker running a consumer sector M&A process, or a strategic planner stress-testing your brand portfolio economics – this fully integrated 3-Statement Financial Model gives you the exact financial infrastructure to plan, pitch, fund, and exit with complete confidence.
💡 What's Inside
This model covers every financial dimension of building and scaling a Fast Moving Consumer Goods business – from your opening revenue ramp through a 10-year path to stabilized operations, distribution channel maturity, and full exit. Built on Financial Modeling World Cup best practices, it's fully dynamic, cross-linked across 17 tabs, and ready to customize for your specific SKU portfolio, trade promotion strategy, and channel mix.
📥 Inputs
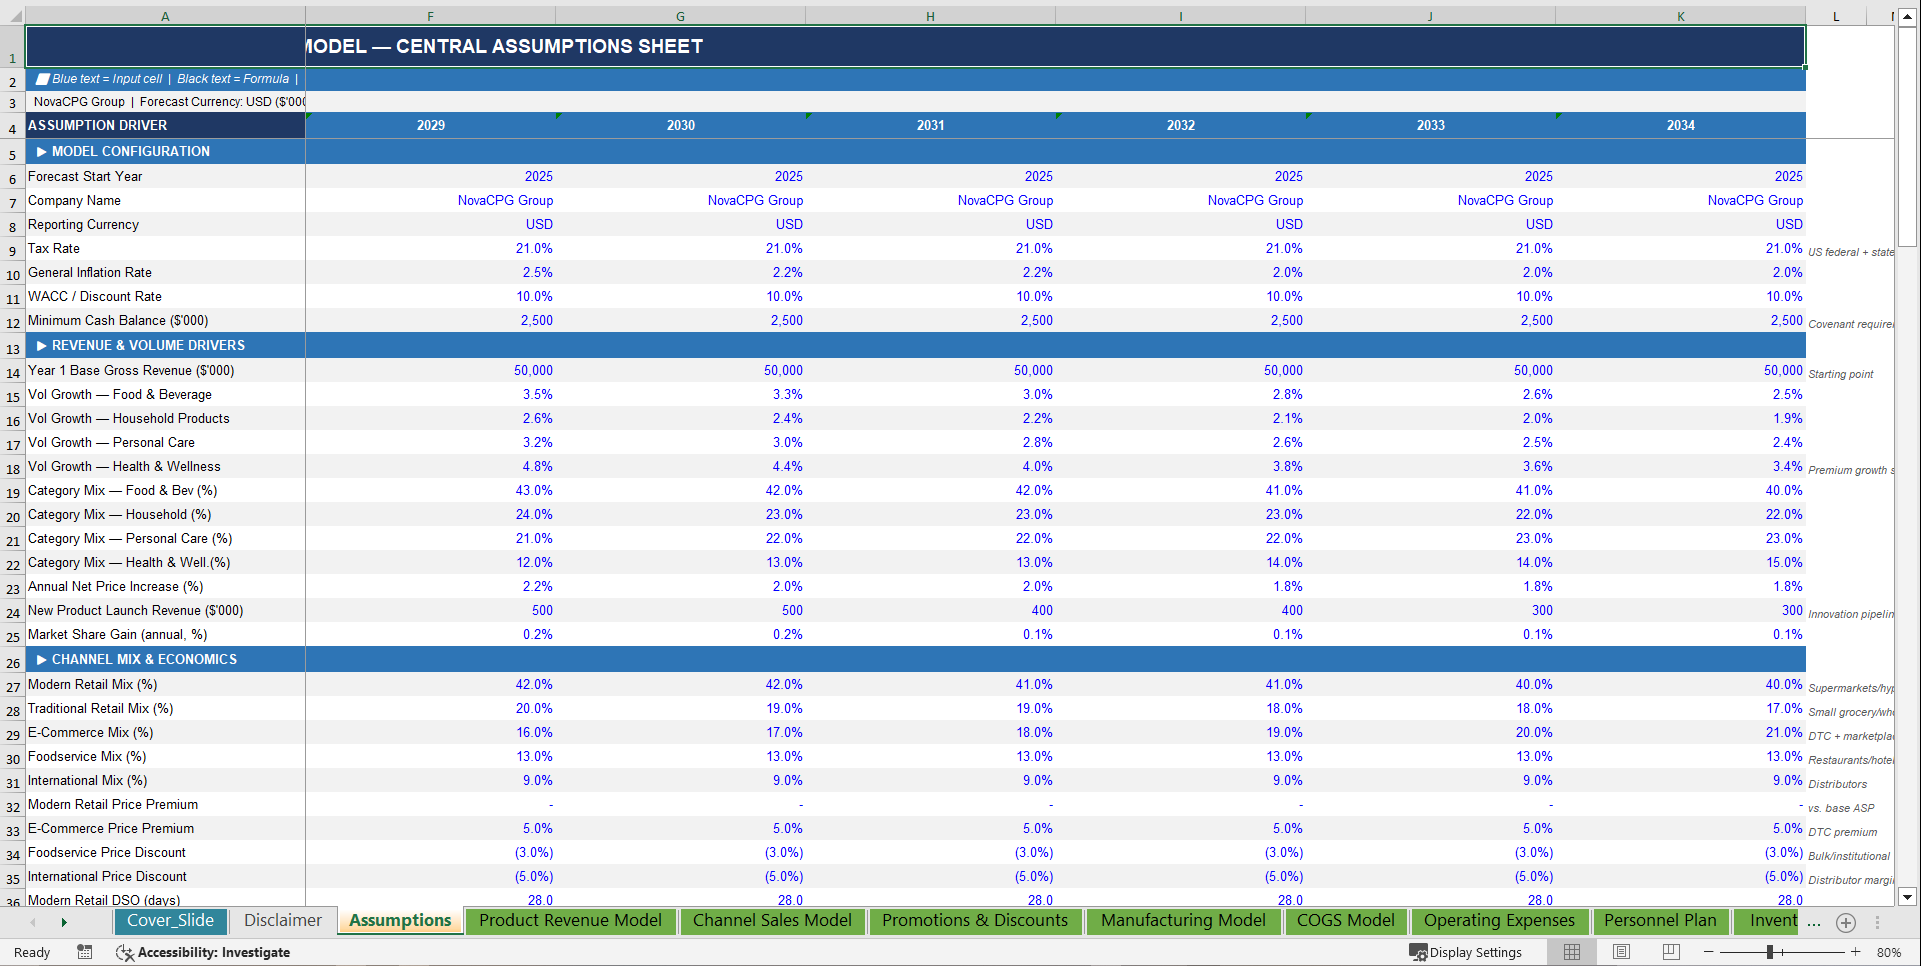
• 🎯 Multi-Category Revenue Engine – Separate modeling for Food & Beverage, Household Products, Personal Care, Health & Wellness, and Baby & Family Products – each with individual base year revenue, annual volume growth rates, price increase assumptions, and gross margin targets – plus a fully independent New Product Launch revenue stack – every revenue dollar modeled to its operational root cause, fully adjustable from a single Assumptions tab
• 🏪 5-Channel Sales Model with Channel Economics – Modern Retail (supermarkets, hypermarkets, mass merchants), Traditional Retail (small grocery, wholesale), E-Commerce (DTC + marketplace platforms), Foodservice (restaurants, hotels, institutional buyers), and International Distributors – each channel with its own pricing premium or discount, DSO assumption, and revenue mix trajectory – the exact channel intelligence every CPG investor and trade lender interrogates on page one of their due diligence checklist
• 🎁 Gross-to-Net Waterfall with Full Trade Promotion Architecture – Trade Discounts modeled individually by channel, Temporary Price Reductions, Retailer Slotting Fees, Coupon and Rebate Redemptions, In-Store Promotional Support, and Volume Discounts for large accounts – every deduction individually sized and fully flowing into Net Revenue – the complete gross-to-net bridge any FMCG CFO, trade marketing director, or consumer sector lender needs to audit your realized selling price
• 🏭 Manufacturing & COGS Engine with 6-Component Cost Structure – Raw Materials broken into agricultural inputs, ingredients, and chemicals – Packaging Materials across labels, cartons, and containers – Direct Labor split between manufacturing workers and quality technicians – Manufacturing Overhead across plant utilities, quality control, and production security – Logistics & Supply Chain covering inbound freight, distribution center handling, and outbound delivery – Waste & Spoilage tracked separately – each with individual cost inflation rates, procurement savings compounding annually, and production efficiency improvements from lean manufacturing and automation investment
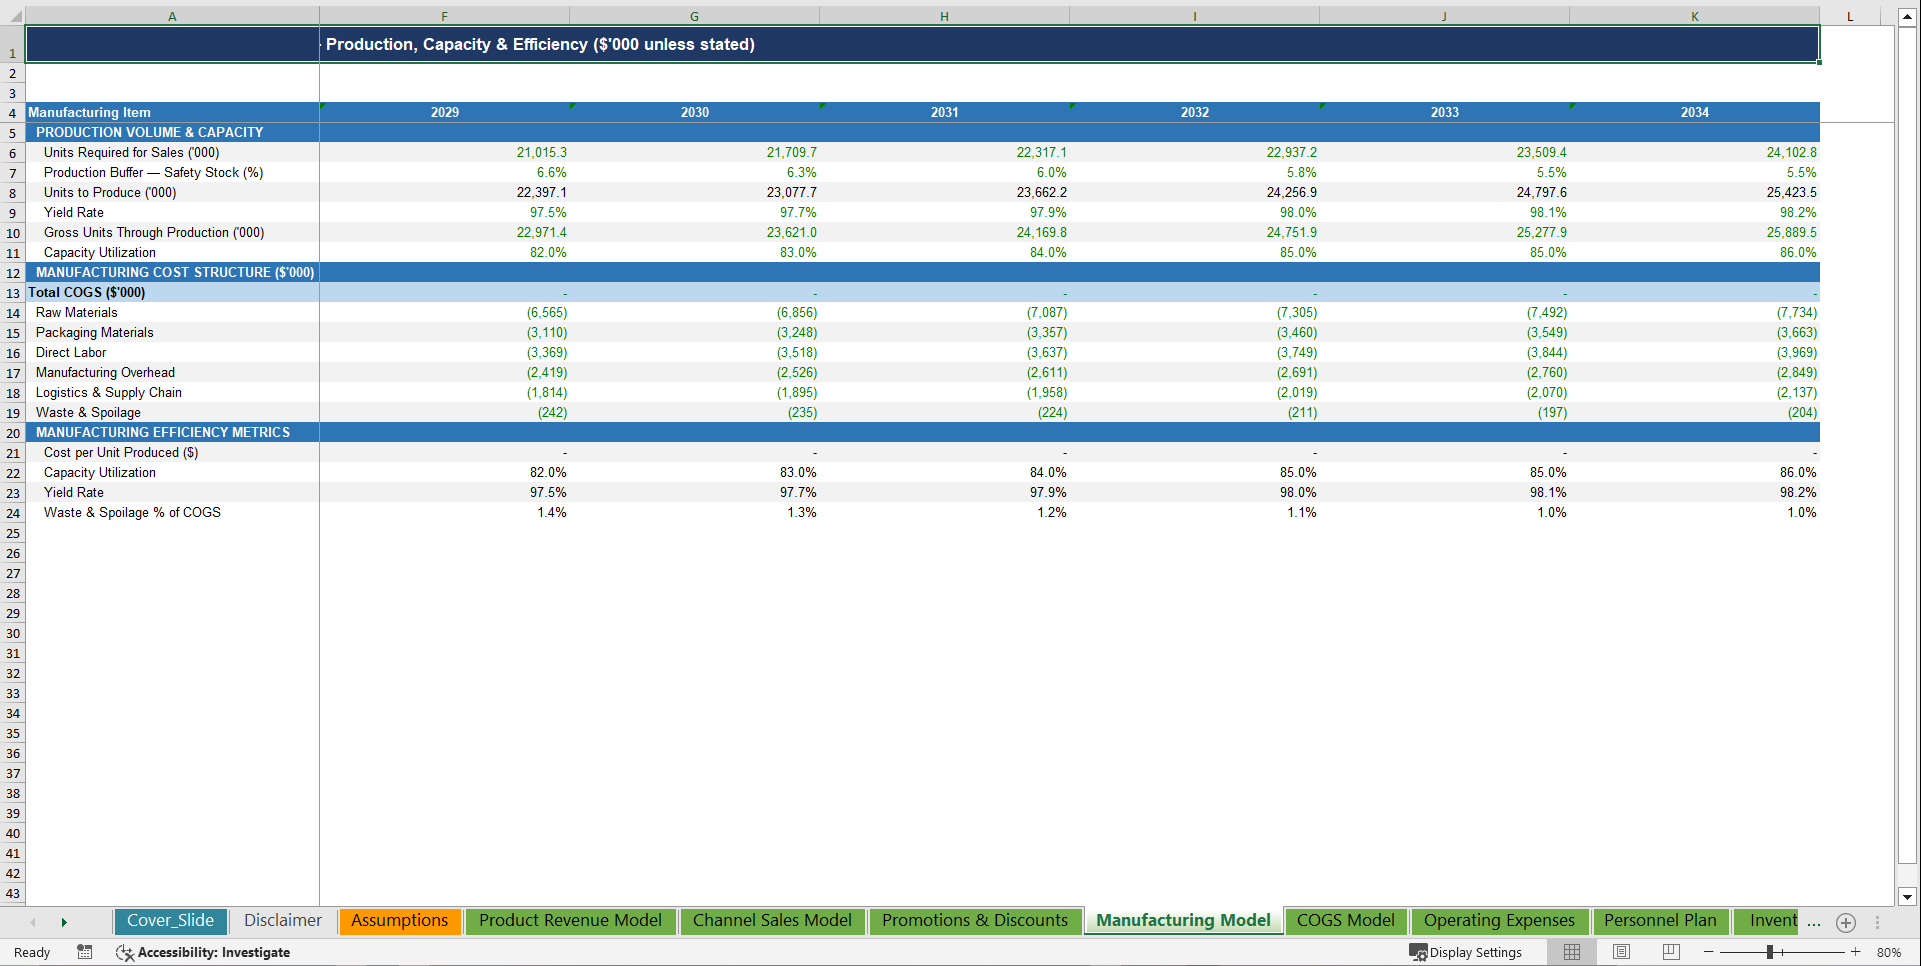
• 🔗 Production Model with Capacity Utilization & Yield Tracking – Factory utilization rate ramping annually, production yield rates improving over the forecast horizon, safety stock buffer sizing, units required vs. units produced reconciliation, cost per unit produced tracked year over year, and manufacturing efficiency metrics at the production floor level – operational transparency that every operational due diligence team and manufacturing lender demands
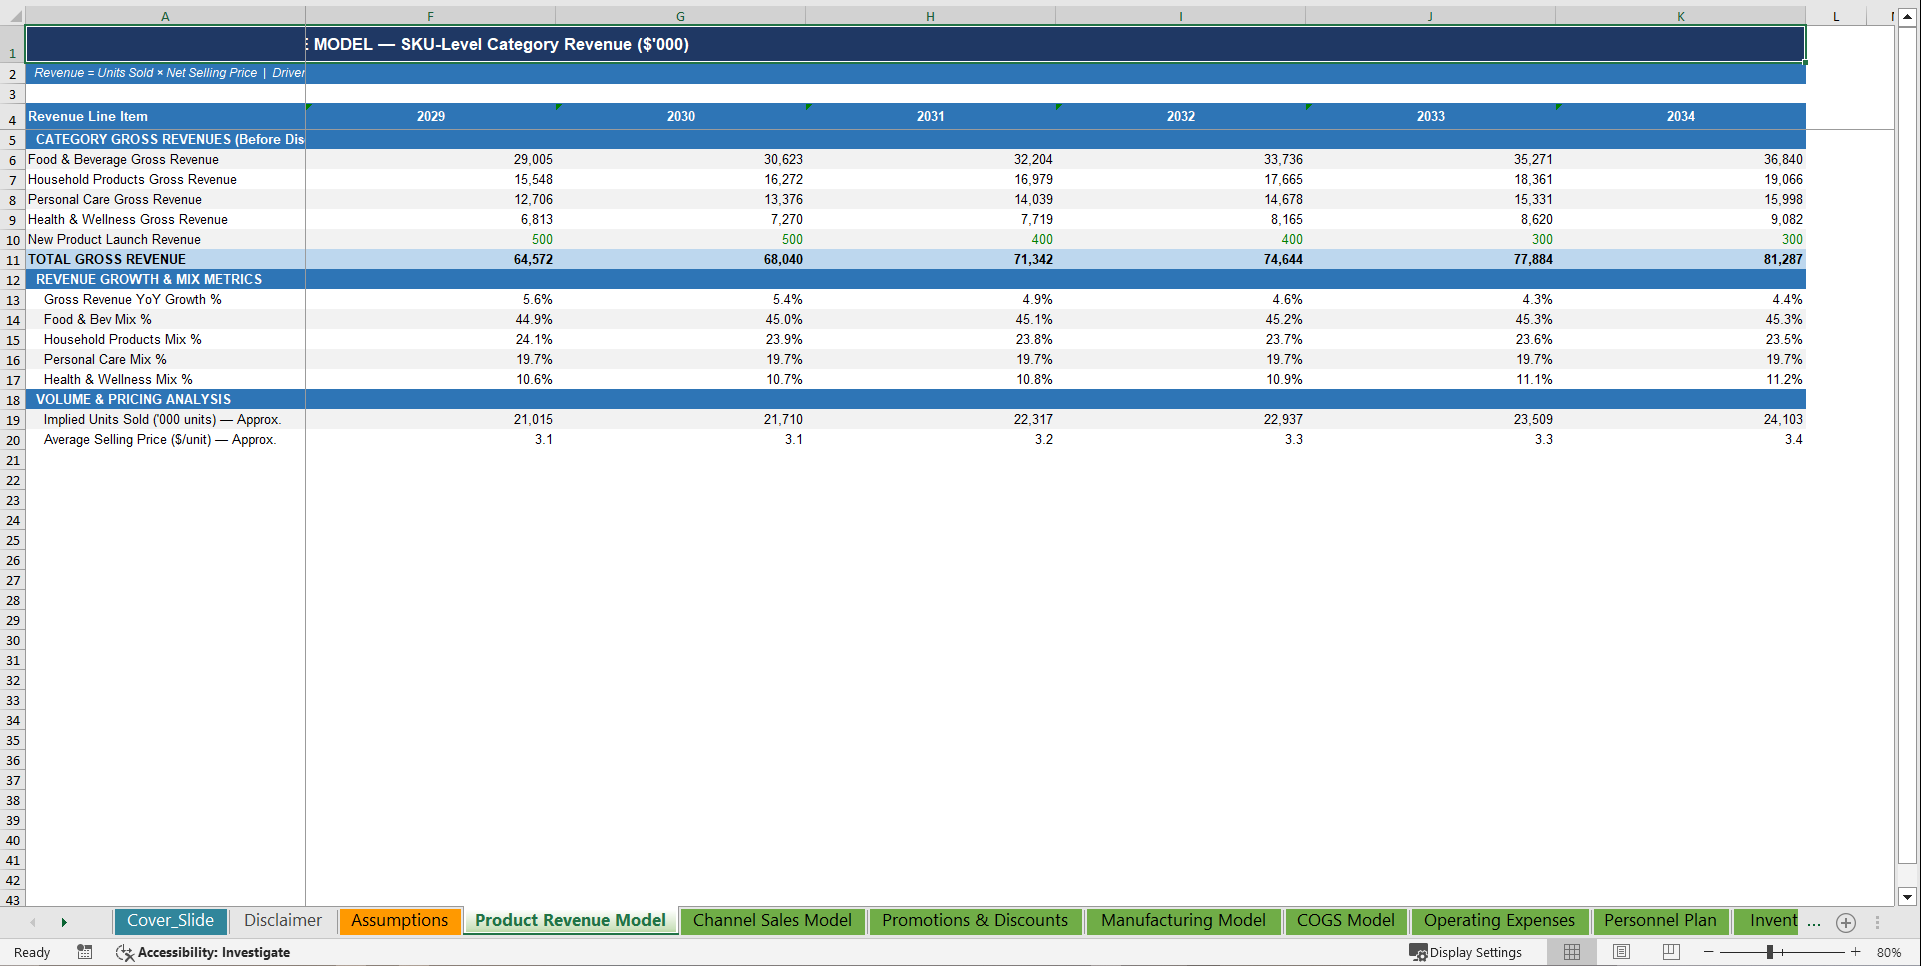
• 🔬 SKU-Level Revenue Model with Volume, Price & Market Share Drivers – Revenue built from the ground up: units sold × net selling price – volume growth driven by population growth, category expansion, distribution gains, marketing spend effectiveness, and market share capture – price increases modeled separately from volume – New Product Launch revenue on its own independent track – SKU lifecycle curves embedded – the exact bottom-up revenue build that separates institutional-quality FMCG models from generic growth rate assumptions
• 👥 18-Role Personnel Plan with Full Compensation Stack – Executive Leadership, CFO and Finance Team, Chief Marketing Officer, Brand Managers, Digital Marketing Specialists, Sales Managers, Key Account Managers, Trade Marketing, Operations and Supply Chain Managers, Plant Managers, Manufacturing Production Staff, Maintenance Technicians, Quality Assurance, Logistics Coordinators, HR, Legal and Compliance, and IT – each with individual Year 1 headcount and average salary, compounding annually at a configurable raise rate – plus Benefits and Health Insurance, Payroll Taxes, Retirement contributions, and Variable Pay and Bonus loaded on top as individual line items – total compensation, headcount, and average cost per employee tracked across all 10 years
• 🏗️ 3-Category CapEx with Granular Sub-Line Detail – Manufacturing CapEx split across new production lines, filling and packaging line upgrades, automation systems, and tooling and fixtures – Technology & IT CapEx covering ERP systems, supply chain management platforms, and CRM – Infrastructure CapEx across factory expansions, warehouse and distribution center construction, and IT network infrastructure – with a full PP&E roll-forward tracking gross PP&E, annual additions, accumulated depreciation, and net PP&E – plus a separate Intangibles and Brand Trademark roll with its own amortization schedule
• 🏦 Dual-Tranche Debt Capital Structure – Term Loan and Revolving Credit Facility modeled separately with individual interest rates, scheduled amortization, and covenant compliance – total debt roll-forward, closing balances, total interest expense, Net Debt / EBITDA leverage ratio, and Interest Coverage Ratio calculated for every year of the forecast
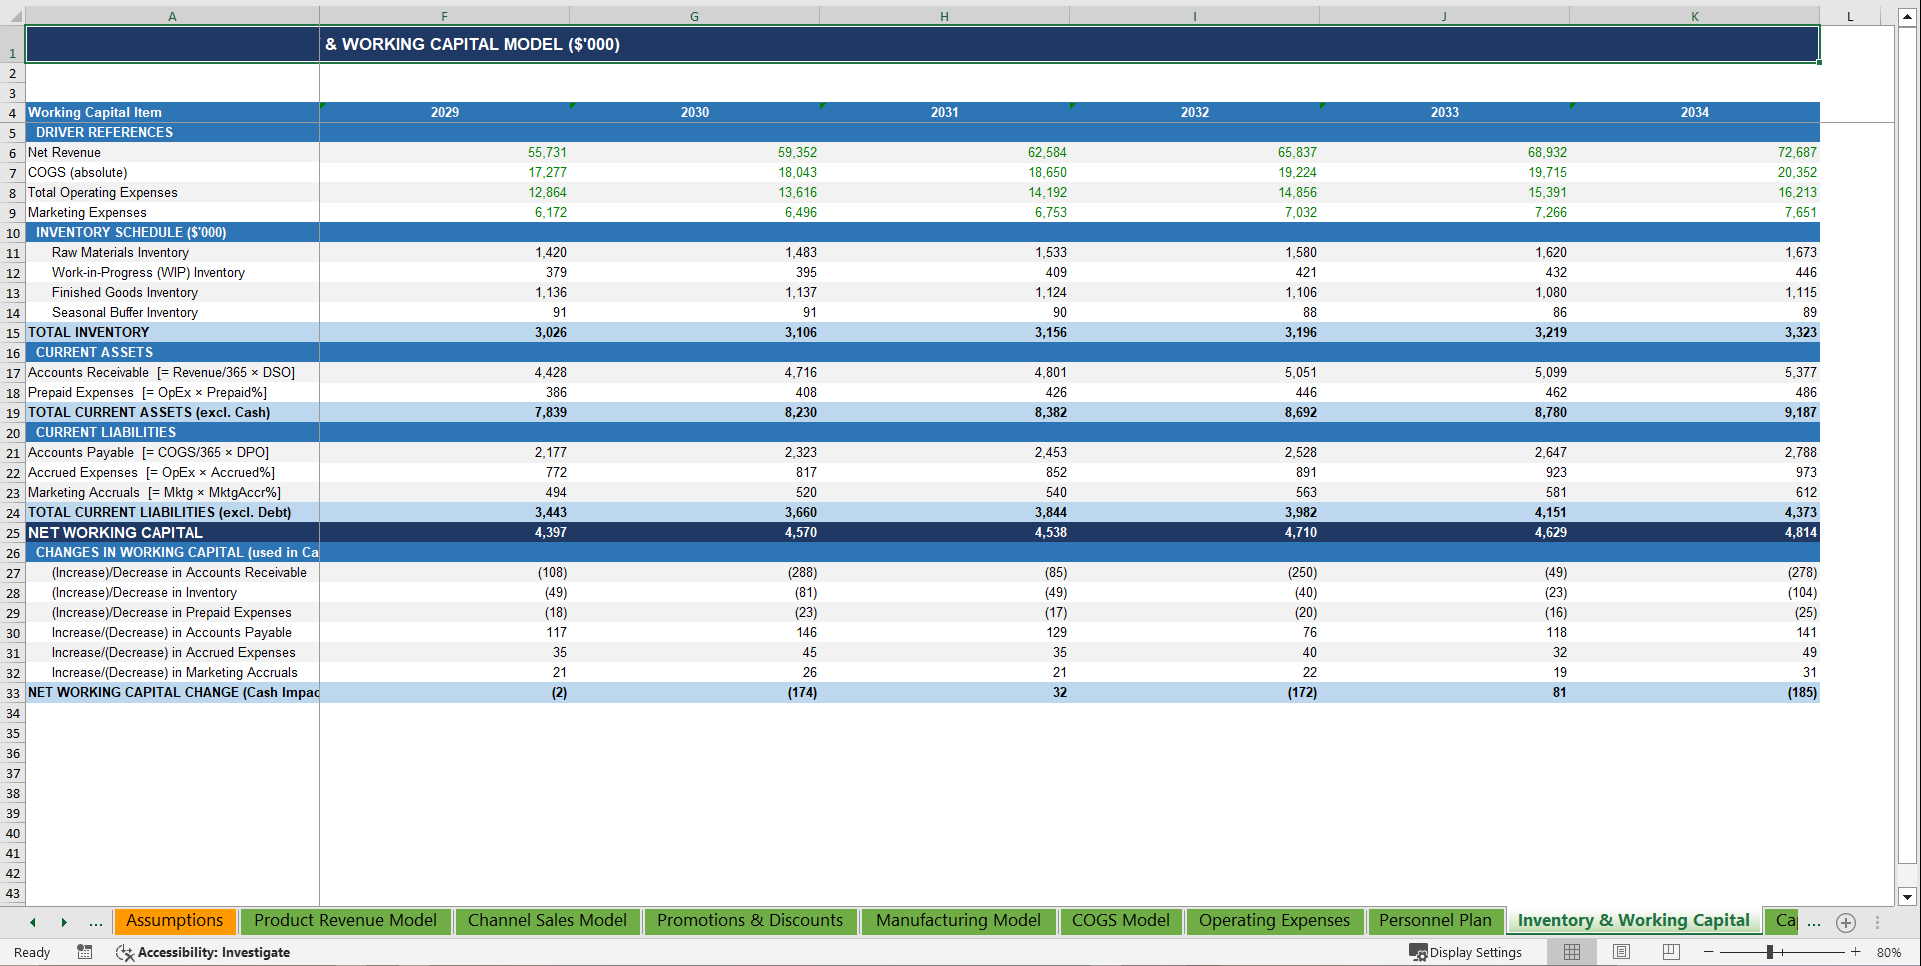
• 📦 4-Tier Inventory Model with Full Working Capital Architecture – Raw Materials, Work-in-Progress, Finished Goods, and Seasonal Buffer Inventory – each sized against Days Inventory Outstanding – with Accounts Receivable split by DSO, Accounts Payable driven by DPO, Accrued Expenses, Marketing Accruals, and full working capital change flows directly feeding the Cash Flow Statement – Net Working Capital and the complete NWC cycle tracked annually
• 📊 4-Table Sensitivity & Scenario Engine – Year-5 EBITDA Margin matrix across Volume Growth vs. Gross Margin, Year-5 Free Cash Flow matrix across CapEx% vs. Marketing Spend%, Year-5 Net Margin across Marketing Investment vs. Raw Material Inflation, 10-Year Revenue CAGR across Price Increase vs. Volume Growth – plus a full scenario comparison table across Base Case, Conservative Case, and High Growth Case – giving you instant scenario answers across four independent risk dimensions without touching a single formula
📤 Outputs
• 📈 10-Year Fully Integrated 3-Statement Financial Model – Income Statement, Balance Sheet, and Cash Flow Statement fully cross-linked and auto-balancing across all 10 years – Net Revenue growing on realistic FMCG assumptions, Gross Margin expanding steadily, EBITDA Margin improving year over year, Free Cash Flow positive from Year 1 – every number traceable to its operational driver
• 🎯 6-Segment Revenue Waterfall with Sub-Line Transparency – Annual projections for Food & Beverage, Household Products, Personal Care, Health & Wellness, Baby & Family, and New Product Launches – gross revenue, channel-level trade discounts by channel, all promotional deductions, and Net Revenue – with year-over-year growth rates, blended gross margin by category, and full revenue mix visibility across all 10 years – the exact revenue architecture every consumer sector lender and PE buyer interrogates in their commercial due diligence
• 🛒 Channel Sales Intelligence Dashboard – 5-channel revenue split with mix shift modeled over 10 years – E-Commerce share growing as modern retail gradually steps down – channel economics including pricing premiums, DSO by channel, and gross-to-net by channel – the channel evolution story every consumer goods M&A buyer and growth equity investor needs to see underwritten with real numbers
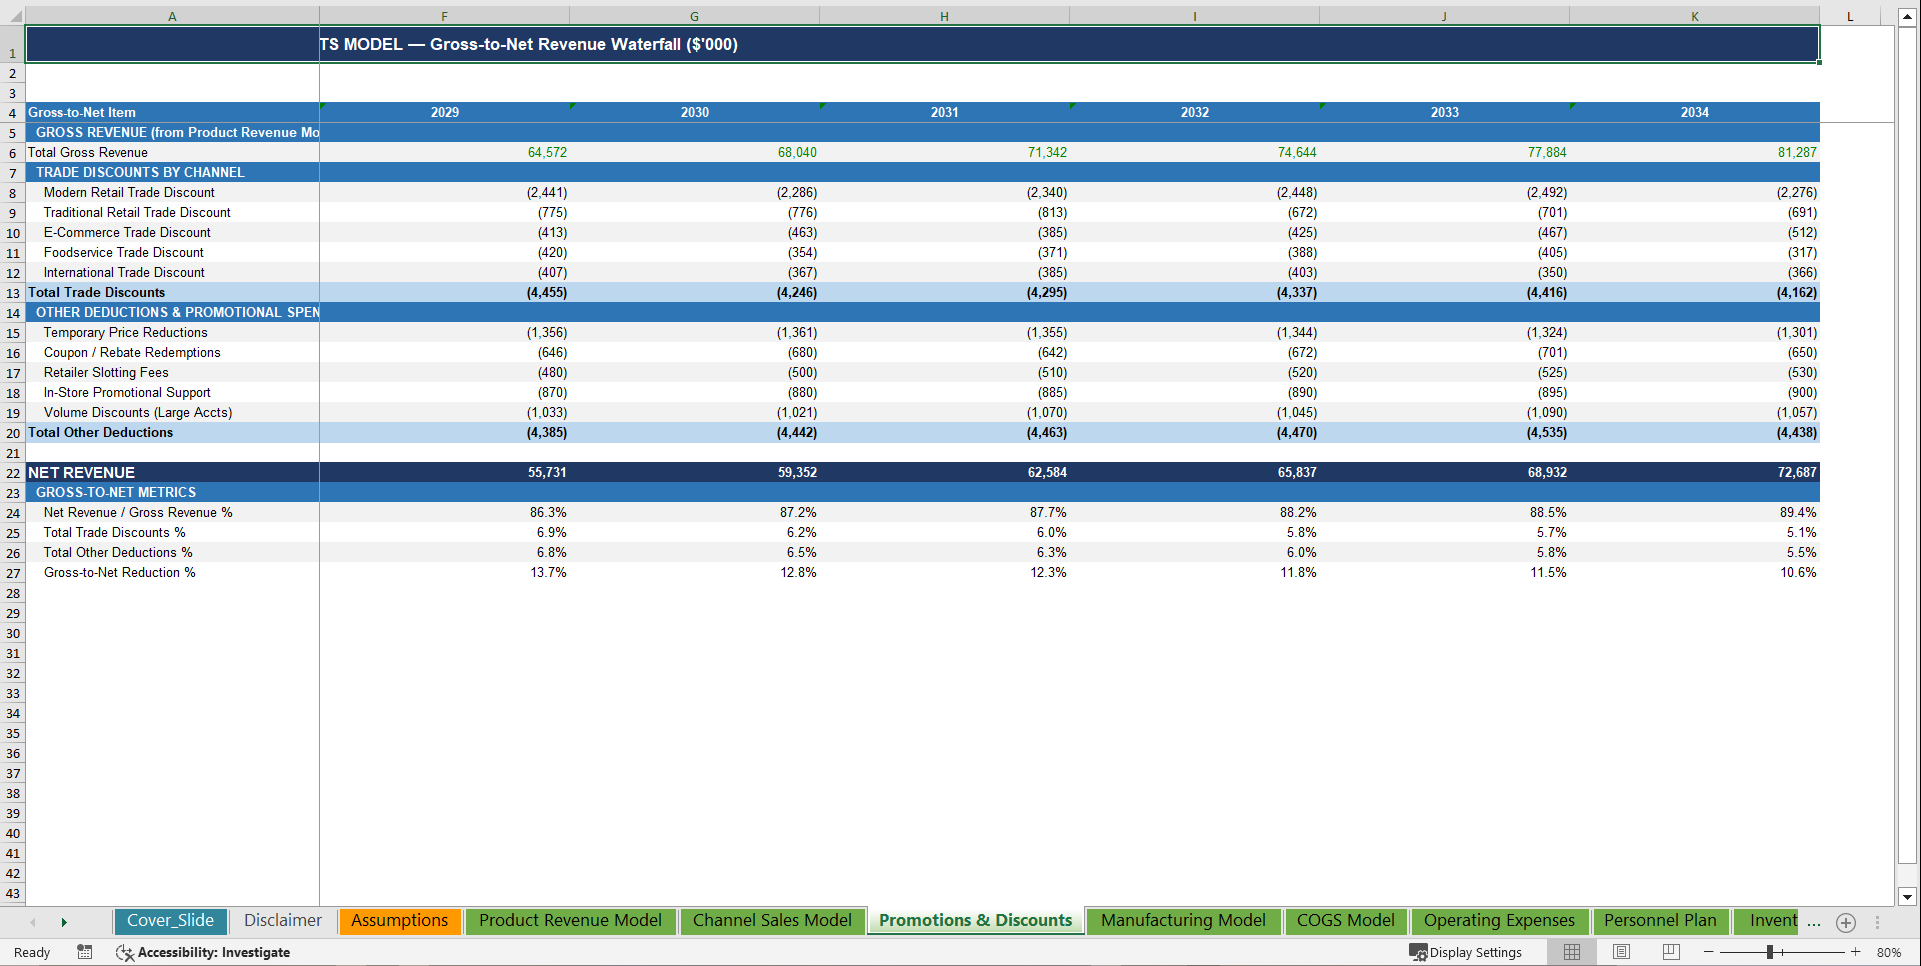
• 🎁 Gross-to-Net Revenue Bridge – Full waterfall from Gross Revenue to Net Revenue: trade discounts by channel, temporary price reductions, slotting fees, coupon and rebate redemptions, in-store promotional support, and volume discounts – Gross-to-Net reduction % tracked annually – net revenue / gross revenue ratio improving as promotional efficiency gains compound – the exact P&L discipline that defines best-in-class FMCG financial management
• 🔩 Cost of Goods Manufactured Waterfall – Raw Materials, Packaging, Direct Labor, Manufacturing Overhead, Logistics & Supply Chain, and Waste & Spoilage – each component broken to sub-line level, individual inflation rates embedded, procurement savings compounding annually, yield rate improvements flowing directly into cost per unit – total COGS reconciled back to Gross Profit with blended Gross Margin % for every year – with component mix % as a reference structure embedded in the model
• 🔬 Marketing Investment & Brand Efficiency Tracker – Total marketing spend as % of Net Revenue, Above-the-Line Advertising vs. Digital Marketing split, Influencer and Social Campaigns, Brand Awareness and PR, Market Research, Sponsorships and Events, and New Product Launch support – all modeled individually and flowing into the Income Statement – marketing ROI tracked implicitly through volume growth response – the complete brand investment picture any consumer goods PE sponsor, strategic acquirer, or growth equity investor needs to evaluate your brand equity trajectory
• 🏭 Production Operations Dashboard – Factory utilization rate ramping toward capacity ceiling, yield rate improving annually, safety stock buffer optimization, cost per unit produced declining with scale and efficiency, waste and spoilage rate reducing year over year – every operational efficiency gain visible, defensible, and linked directly to gross margin improvement
• 💼 Personnel Cost Schedule – 18 roles with individual headcount and salary inputs, full compensation stack with benefits, payroll taxes, and variable pay compounding annually, total headcount growing from year one through year ten, total compensation cost, and average compensation per employee – fully flowing into the Income Statement as a transparent, auditable operating expense
• 🏛️ CapEx & PP&E Schedule – 3-category CapEx with 10 individual sub-lines, total CapEx and CapEx as % of revenue for every year, gross PP&E, annual additions, accumulated depreciation, Net PP&E – plus a separate Intangibles and Brand Trademark schedule with its own amortization tracking – PP&E / Revenue ratio and Depreciation schedule fully linked into the Income Statement and Balance Sheet
• 📦 Inventory & Working Capital Schedules – Inventory broken into Raw Materials, WIP, Finished Goods, and Seasonal Buffer with full roll-forward – DSO, DIO, and DPO tracked annually and improving over the forecast – Accounts Receivable, Accounts Payable, Prepaid Expenses, Accrued Expenses, and Marketing Accruals – Net Working Capital and Change in NWC fully linked into the Cash Flow Statement – the working capital discipline story every FMCG lender and operational PE firm needs to see modeled properly
• 🔄 Cash Flow Statement – Full Indirect Method – Net Income, D&A add-back, 6 individual working capital movement lines, CapEx investing outflows across 3 categories, term loan repayments, revolver activity, dividend payments, and equity issuance – Free Cash Flow, FCF Margin, and Opening-to-Closing Cash reconciliation calculated and tracked for every year – Closing Cash tied directly to the Balance Sheet
• 📊 Balance Sheet with 5 Analytical Ratios – Current Assets (Cash, AR, Inventory, Prepaid), Non-Current Assets (Net PP&E, Intangibles, Brand Trademarks), Current Liabilities (AP, Accrued Expenses, Marketing Accruals, Short-term Debt), Long-Term Liabilities (Term Loan, Revolving Facility, Deferred Tax), and Full Equity stack (Paid-in Capital, Retained Earnings) – with auto-balancing check confirming Assets = Liabilities + Equity for every year – plus Current Ratio, EBITDA Margin, Net Margin, Return on Assets, and Return on Equity tracked annually
• 📐 Executive Dashboard with 8 Live Charts & 12 KPI Cards – Revenue & Gross Profit bar chart, EBITDA & Net Income bar chart, Gross / EBITDA / Net Margin trend lines, Cash Balance vs. Total Debt, Free Cash Flow trend, Headcount growth, Inventory & Working Capital cycle, CapEx vs. Gross Revenue – plus 12 live KPI cards covering Total Revenue, Gross Profit, EBITDA, EBITDA Margin %, Gross Margin %, Net Income, Net Margin %, Free Cash Flow, Cash Balance, Debt/EBITDA, CapEx/Revenue, and Marketing/Revenue – all auto-updating when any assumption changes
🏆 Why This Model Stands Out
✅ Fully integrated – every sheet talks to every other sheet. Change one assumption and 2,822 formulas update instantly across all 17 tabs
✅ Lender and investor-ready – structured and formatted to answer the exact questions consumer goods lenders, growth equity investors, private equity buyers, and strategic acquirers ask on day one: What is stabilized EBITDA? What is the gross-to-net revenue leakage? When does the brand reach FCF breakeven? What does the working capital cycle look like at scale? What is the exit EBITDA at an 8× multiple?
✅ FMCG industry realistic – built around how consumer goods businesses actually generate and protect revenue: trade promotions eroding gross price, working capital swelling with inventory as the business scales, marketing investment driving volume growth rather than just burning margin, procurement savings compounding through strategic sourcing – not generic manufacturing assumptions with an FMCG label pasted on top
✅ Institutional color-coding throughout – blue inputs, black formulas, green cross-sheet links, yellow flagged assumptions – Financial Modeling World Cup color conventions used throughout, so any lender, investor, operator, or acquirer can open it and immediately understand the logic, trace every number to its source, and audit every formula without a guide
✅ Fully unlocked – no protected sheets, no black-box formulas, no hidden logic. Every assumption is visible. Every formula is auditable. Own it, customize it, present it to any FMCG investor, consumer sector lender, acquisition buyer, or debt refinancing committee with complete confidence
📋 Model Structure – 17 Sheets
• Executive Dashboard – 8 live charts + 12 KPI summary cards covering all key revenue, margin, working capital, headcount, and cash metrics, auto-updating from a single Assumptions tab
• Assumptions – Every input centralized: 120+ individually configurable drivers covering all 6 revenue categories, 5 distribution channels, gross-to-net waterfall, COGS structure, marketing investment, 18-role personnel plan, 3-category CapEx, working capital days, dual-tranche debt terms, tax rate, production capacity, and 3-scenario toggles – all blue-coded for instant editing
• Product Revenue Model – All 5 product categories plus New Product Launches fully formula-driven from volume, price, market share, and category growth assumptions – units sold and average selling price tracked – building up to Total Gross Revenue for every year
• Channel Sales Model – 5-channel revenue split with channel-specific pricing economics, mix shift modeled annually, E-Commerce share growing from year one through year ten – channel revenue and channel mix % for all 10 years
• Promotions & Discounts – Full gross-to-net waterfall with 5 trade discount lines by channel, TPRs, slotting fees, coupon redemptions, in-store support, and volume discounts – Net Revenue confirmed and flowing to COGS Model
• Manufacturing Model – Factory utilization ramp, yield rate improvement, safety stock buffer, units required vs. produced, and cost per unit – operational transparency at the production floor level
• COGS Model – 6-component cost structure with individual inflation and savings rates, gross profit reconciliation, component mix %, and gross margin % – fully reconciled to the Income Statement
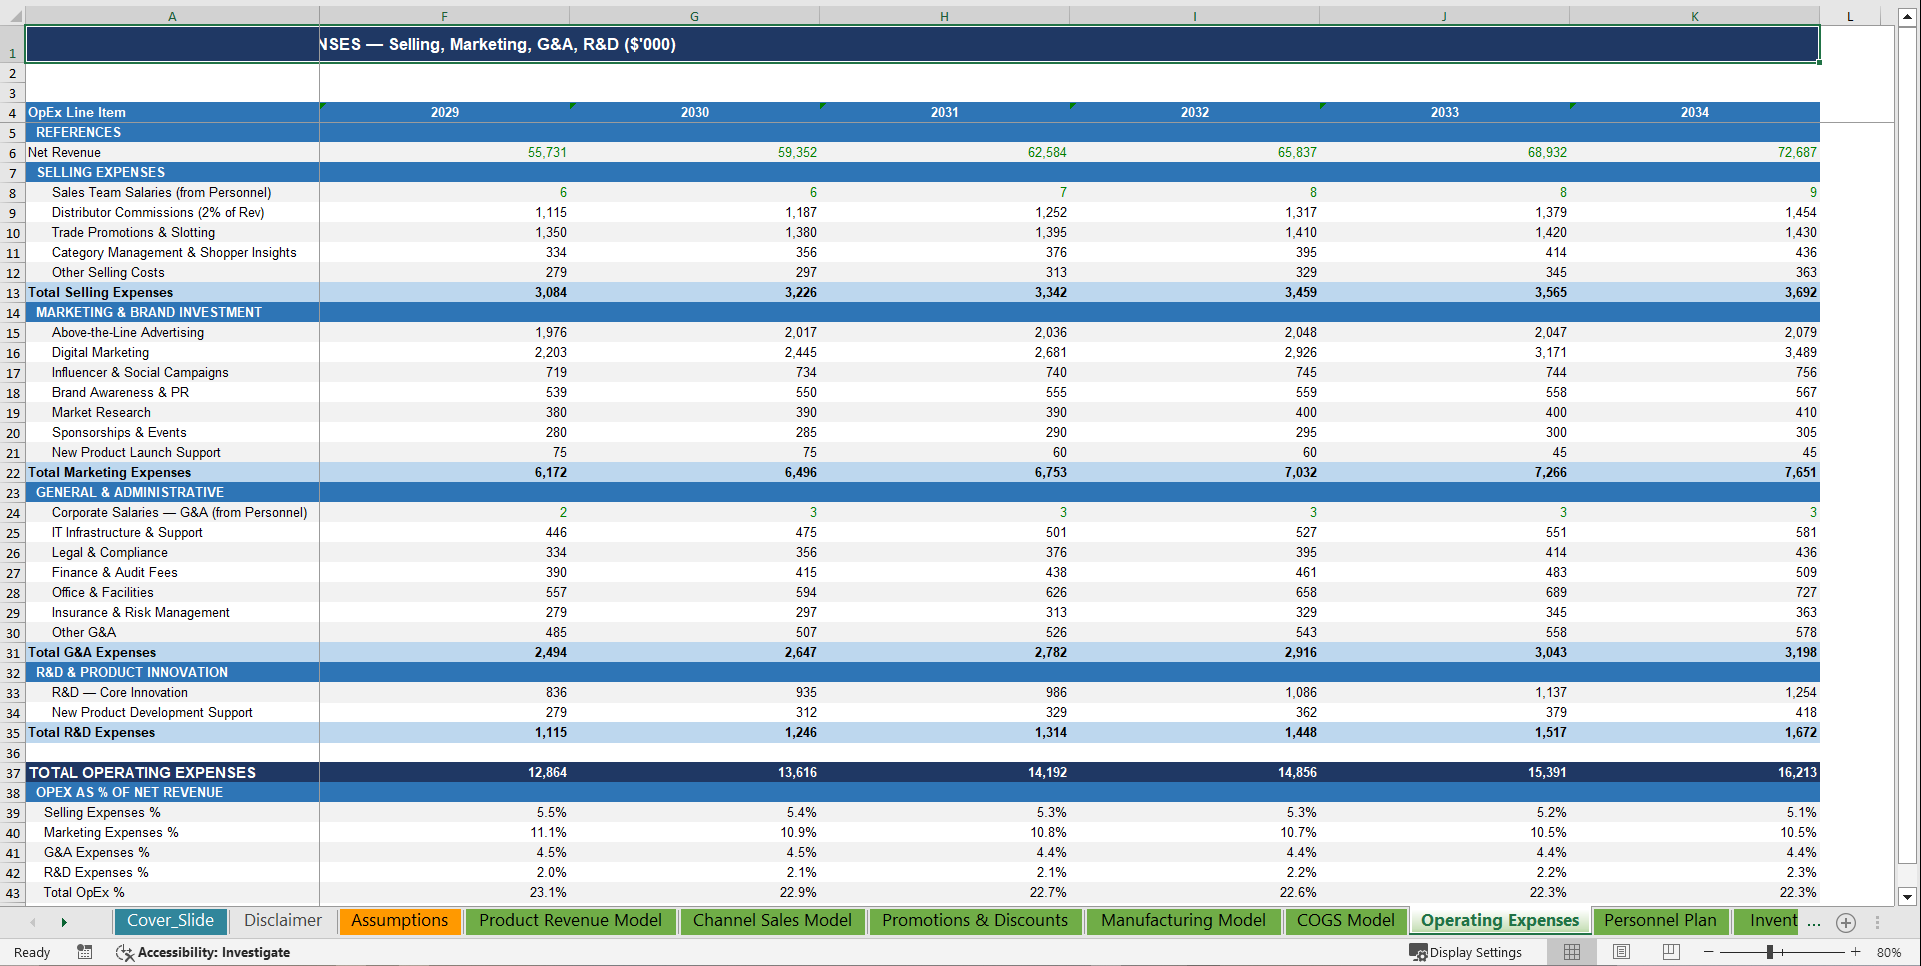
• Operating Expenses – Selling Expenses (5 lines), Marketing & Brand Investment (7 lines), G&A (7 lines), R&D & Innovation (2 lines) – each as % of Net Revenue with individual assumptions – total OpEx and all margin ratios tracked annually
• Personnel Plan – 18 roles with individual headcount and salary, 3-component compensation stack compounding annually, total headcount, total compensation, and average cost per employee across all 10 years
• Inventory & Working Capital – 4-tier inventory with full roll-forward, AR and AP driven by DSO/DPO, prepaid and accrued liabilities, marketing accruals, Net Working Capital, and Change in NWC fully linked to the Cash Flow Statement
• CapEx Schedule – 3-category CapEx with 4 individual sub-lines, total CapEx and CapEx as % of revenue annually
• Depreciation Schedule – Full PP&E gross roll-forward, depreciation by asset class, accumulated depreciation, Net PP&E – linked to Income Statement and Balance Sheet
• Debt Schedule – Term Loan and Revolver each individually modeled with full roll, interest calculations, Net Debt/EBITDA, and Interest Coverage Ratio for all 10 years
• Income Statement – Net Revenue → Gross Profit → EBITDA → EBIT → EBT → Net Income with 4-segment OpEx detail, Gross / EBITDA / EBIT / Net Margin % for every year
• Balance Sheet – Full asset, liability, and equity stack with auto-balancing check confirming Assets = Liabilities + Equity for every year
• Cash Flow Statement – Full indirect method with 8 operating adjustments, 3 investing lines, 4 financing lines, OCF, FCF, and FCF Margin – all linked to the Balance Sheet
• Sensitivity Analysis – 4 independent stress-test tables across EBITDA Margin, Free Cash Flow, Revenue CAGR, and Net Margin – plus full 3-scenario comparison table across Conservative, Base, and High Growth cases – 80+ instant scenario data points color-coded for at-a-glance risk assessment
Key Words:
Strategy & Transformation, Growth Strategy, Strategic Planning, Strategy Frameworks, Innovation Management, Pricing Strategy, Core Competencies, Strategy Development, Business Transformation, Marketing Plan Development, Product Strategy, Breakout Strategy, Competitive Advantage, Mission, Vision, Values, Strategy Deployment & Execution, Innovation, Vision Statement, Core Competencies Analysis, Corporate Strategy, Product Launch Strategy, BMI, Blue Ocean Strategy, Breakthrough Strategy, Business Model Innovation, Business Strategy Example, Corporate Transformation, Critical Success Factors, Customer Segmentation, Customer Value Proposition, Distinctive Capabilities, Enterprise Performance Management, KPI, Key Performance Indicators, Market Analysis, Market Entry Example, Market Entry Plan, Market Intelligence, Market Research, Market Segmentation, Market Sizing, Marketing, Michael Porter's Value Chain, Organizational Transformation, Performance Management, Performance Measurement, Platform Strategy, Product Go-to-Market Strategy, Reorganization, Restructuring, SWOT, SWOT Analysis, Service 4.0, Service Strategy, Service Transformation, Strategic Analysis, Strategic Plan Example, Strategy Deployment, Strategy Execution, Strategy Frameworks Compilation, Strategy Methodologies, Strategy Report Example, Value Chain, Value Chain Analysis, Value Innovation, Value Proposition, Vision Statement, Corporate Strategy, Business Development, Business plan pdf, business plan, PDF, Business Plan DOC, Business Plan Template, PPT, Market strategy playbook, strategic market planning, competitive analysis tools, market segmentation frameworks, growth strategy templates, product positioning strategy, market execution toolkit, strategic alignment playbook, KPI and OKR frameworks, business growth strategy guide, cross-functional strategy templates, market risk management, market strategy PowerPoint doc, guide, ebook, e-book ,McKinsey Change Playbook, Organizational change management toolkit, Change management frameworks 2025, Influence model for change, Change leadership strategies, Behavioral change in organizations, Change management PowerPoint templates, Transformational leadership in change, supply chain KPIs, supply chain KPI toolkit, supply chain PowerPoint template, logistics KPIs, procurement KPIs, inventory management KPIs, supply chain performance metrics, manufacturing KPIs, supply chain dashboard, supply chain strategy KPIs, reverse logistics KPIs, sustainability KPIs in supply chain, financial supply chain KPIs, warehouse KPIs, digital supply chain KPIs, 1200 KPIs, supply chain scorecard, KPI examples, supply chain templates, Corporate Finance SOPs, Finance SOP Excel Template, CFO Toolkit, Finance Department Procedures, Financial Planning SOPs, Treasury SOPs, Accounts Payable SOPs, Accounts Receivable SOPs, General Ledger SOPs, Accounting Policies Template, Internal Controls SOPs, Finance Process Standardization, Finance Operating Procedures, Finance Department Excel Template, FP&A Process Documentation, Corporate Finance Template, Finance SOP Toolkit, CFO Process Templates, Accounting SOP Package, Tax Compliance SOPs, Financial Risk Management Procedures.
NOTE: Our digital products are sold on an "as is" basis, making returns and refunds unavailable post-download. Please preview and inquire before purchasing. Please contact us before purchasing if you have any questions! This policy aligns with the standard Flevy Terms of Usage.
Got a question about the product? Email us at support@flevy.com or ask the author directly by using the "Ask the Author a Question" form. If you cannot view the preview above this document description, go here to view the large preview instead.
Source: Best Practices in Consumer Packaged Goods, Integrated Financial Model Excel: Fast Moving Consumer Goods (FMCG) Company Financial Model Excel (XLSX) Spreadsheet, SB Consulting
ABOUT THE AUTHOR
SB Consulting is dedicated to empowering businesses to communicate their ideas with impact. This consulting firm specializes in teaching organizations how to create effective corporate and management presentations. With training from top-tier global consulting firms, including McKinsey, BCG, and Porsche Consulting, extensive expertise in presentation design and ... [read more]
Ask the Author a Question
You must be logged in to contact the author.
