

Energy & Utilities Company Advanced 10-Year Financial Model – Excel XLSX
Excel (XLSX)
BENEFITS OF THIS DOWNLOADABLE EXCEL DOCUMENT
- Models the complete financial infrastructure of an Energy & Utilities business across power generation, transmission, distribution, and renewable energy segments.
- Provides a framework for forecasting regulated tariff revenue, PPA contracts, and retail customer billing across a fully integrated 10-year three-statement model.
- Delivers institutional-grade project finance analytics including DSCR, leverage ratios, and scenario stress-testing built for infrastructure investors and utility CFOs.
ENERGY INDUSTRY EXCEL DESCRIPTION
Curated by McKinsey-trained Executives
🔋 Energy & Utilities Company Financial Model | Institutional-Grade 3-Statement 10-Year Forecast
Turn your power generation, transmission, distribution, or renewable energy business into a scalable, cash-generating, investor-ready platform – modeled with the same financial precision used by global infrastructure funds, utility holding companies, and institutional energy investors.
Whether you're a private equity or infrastructure fund underwriting a utility acquisition, a renewable energy developer stress-testing project economics, a corporate finance team building a 10-year strategic plan, a CFO presenting to a board or lender, an energy company evaluating generation mix transitions, or a project finance analyst sizing debt capacity and coverage – this fully integrated 3-Statement Financial Model gives you the exact infrastructure to forecast revenue across every segment, control capital-intensive cost structures, model multi-decade asset lifecycles, and scale profitably across a 10-year horizon.
💡 What's Inside
This model captures every financial and operational driver of a modern energy and utilities business – from regulated tariff revenue and long-term PPAs to grid modernisation CapEx and project finance debt structures. Built using institutional infrastructure and project finance modeling best practices, the model is fully dynamic, cross-linked across 14 dedicated sheets, and designed to simulate real-world constraints like capacity expansion timelines, degradation curves, fuel price volatility, and regulatory asset base evolution.
📥 Inputs
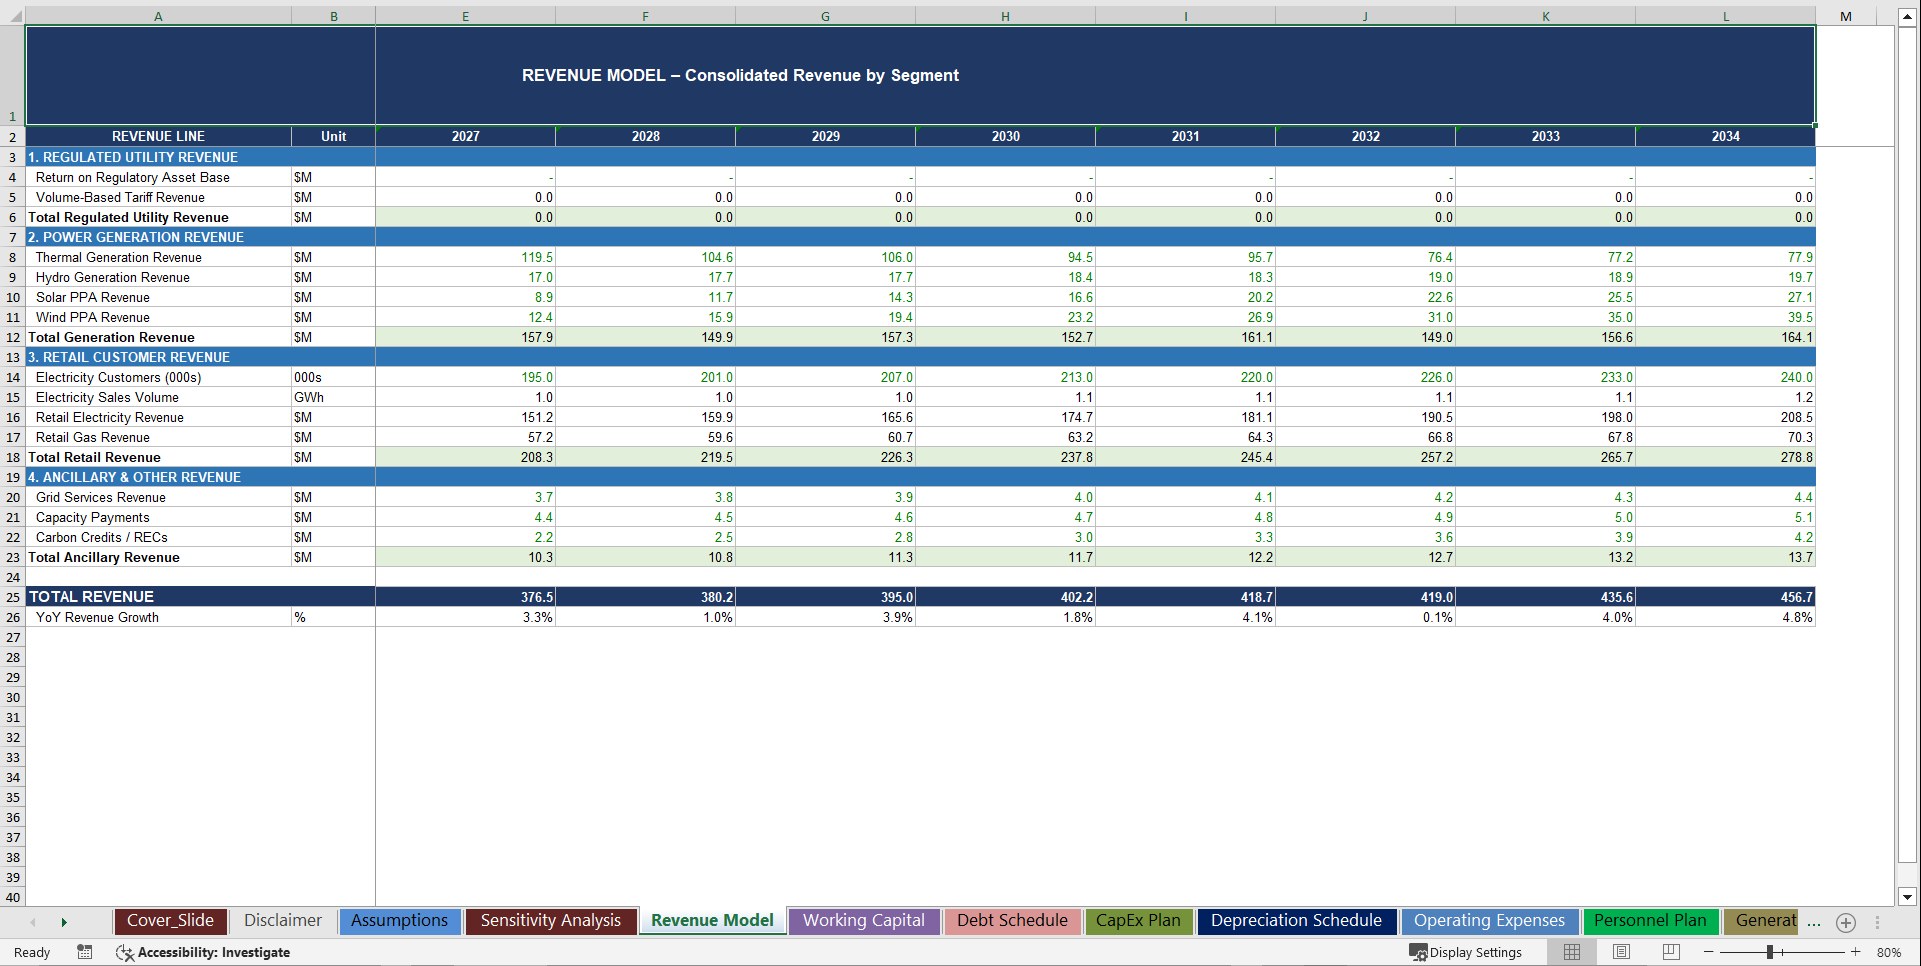
• ⚡ Multi-Segment Revenue Engine (4 Revenue Streams) – Regulated Utility, Power Generation, Retail Customer Billing, and Ancillary – each modeled with individual pricing, volume, tariff structures, and growth assumptions – every revenue line tied directly to operational capacity, customer base, and market dynamics – with volume-based tariff revenue, RAB return calculations, PPA pricing, and retail billing all running simultaneously
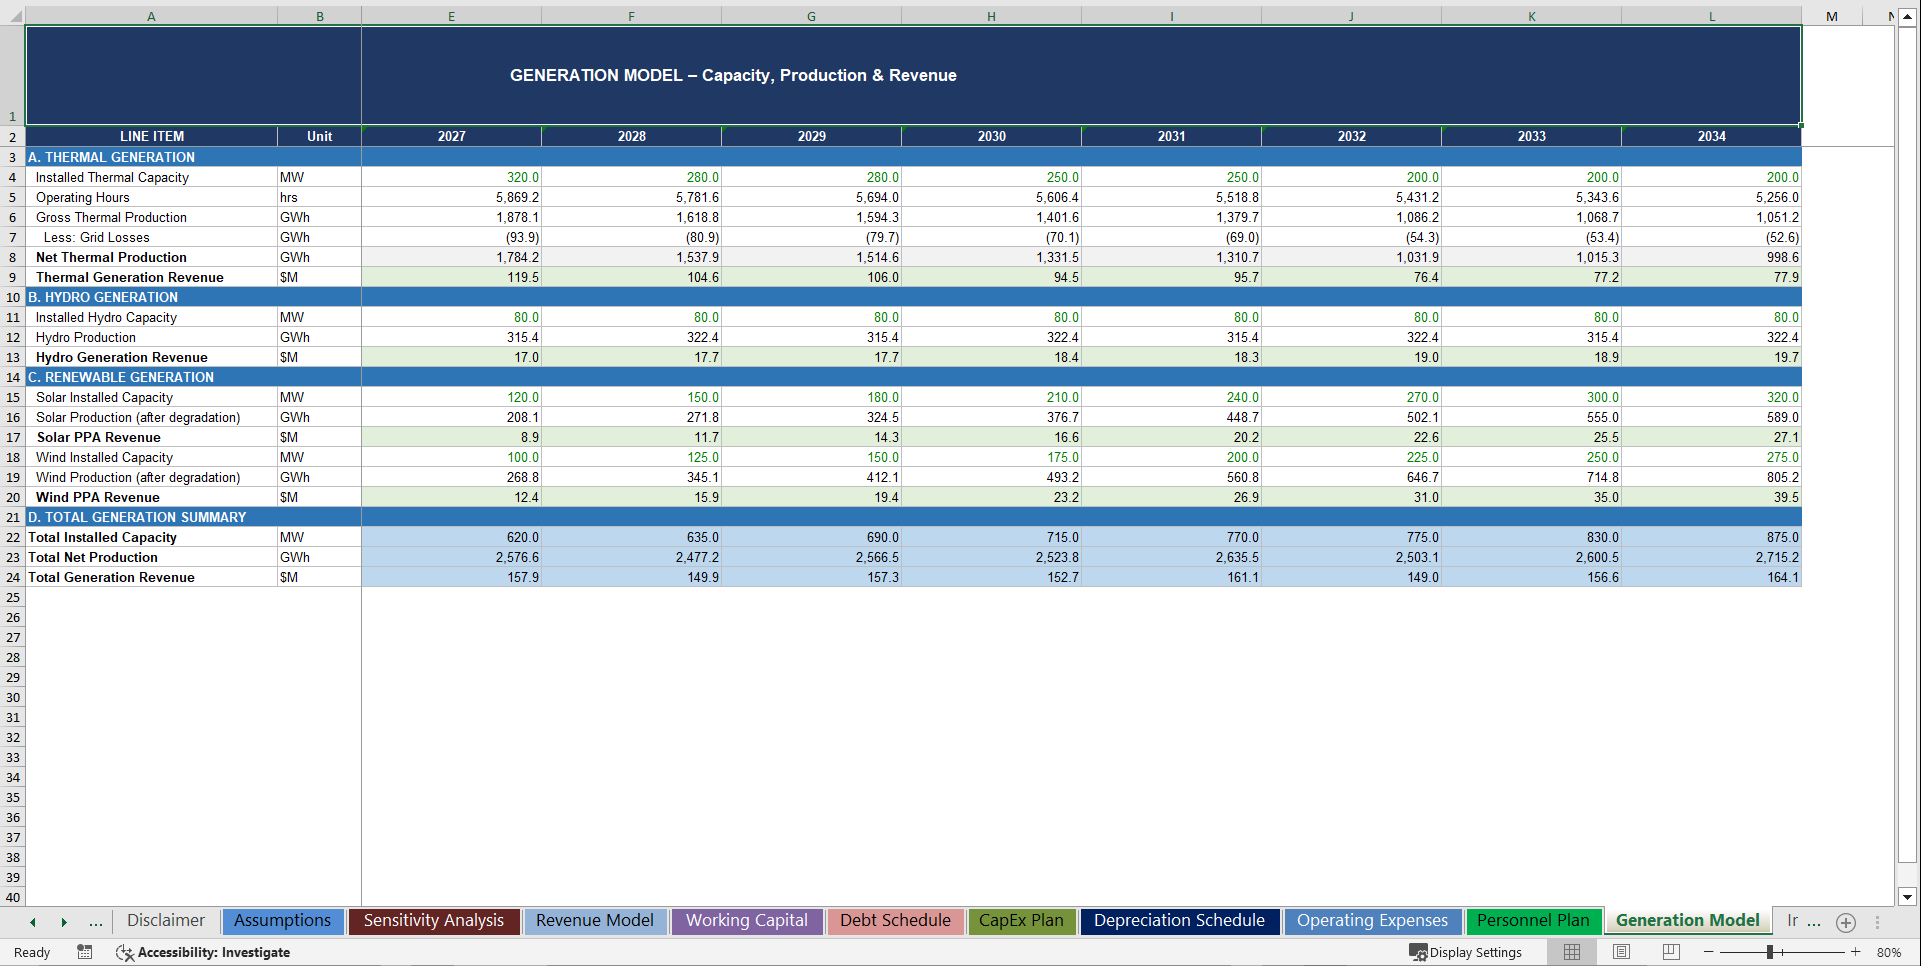
• 🏭 Generation Asset Capacity & Production Model – Thermal, Hydro, Solar, and Wind assets modeled individually with installed capacity (MW), capacity factors, operating hours, gross production (GWh), grid loss deductions, and net production feeding directly into segment revenue – the exact operational logic every energy investor and grid operator requires
• 🌱 Renewable Energy Expansion Engine – Solar and Wind capacity scaling year-by-year with load factors, PPA pricing, degradation rates, and curtailment – enabling realistic renewable revenue growth tied to actual MW additions and production physics – not arbitrary growth percentages
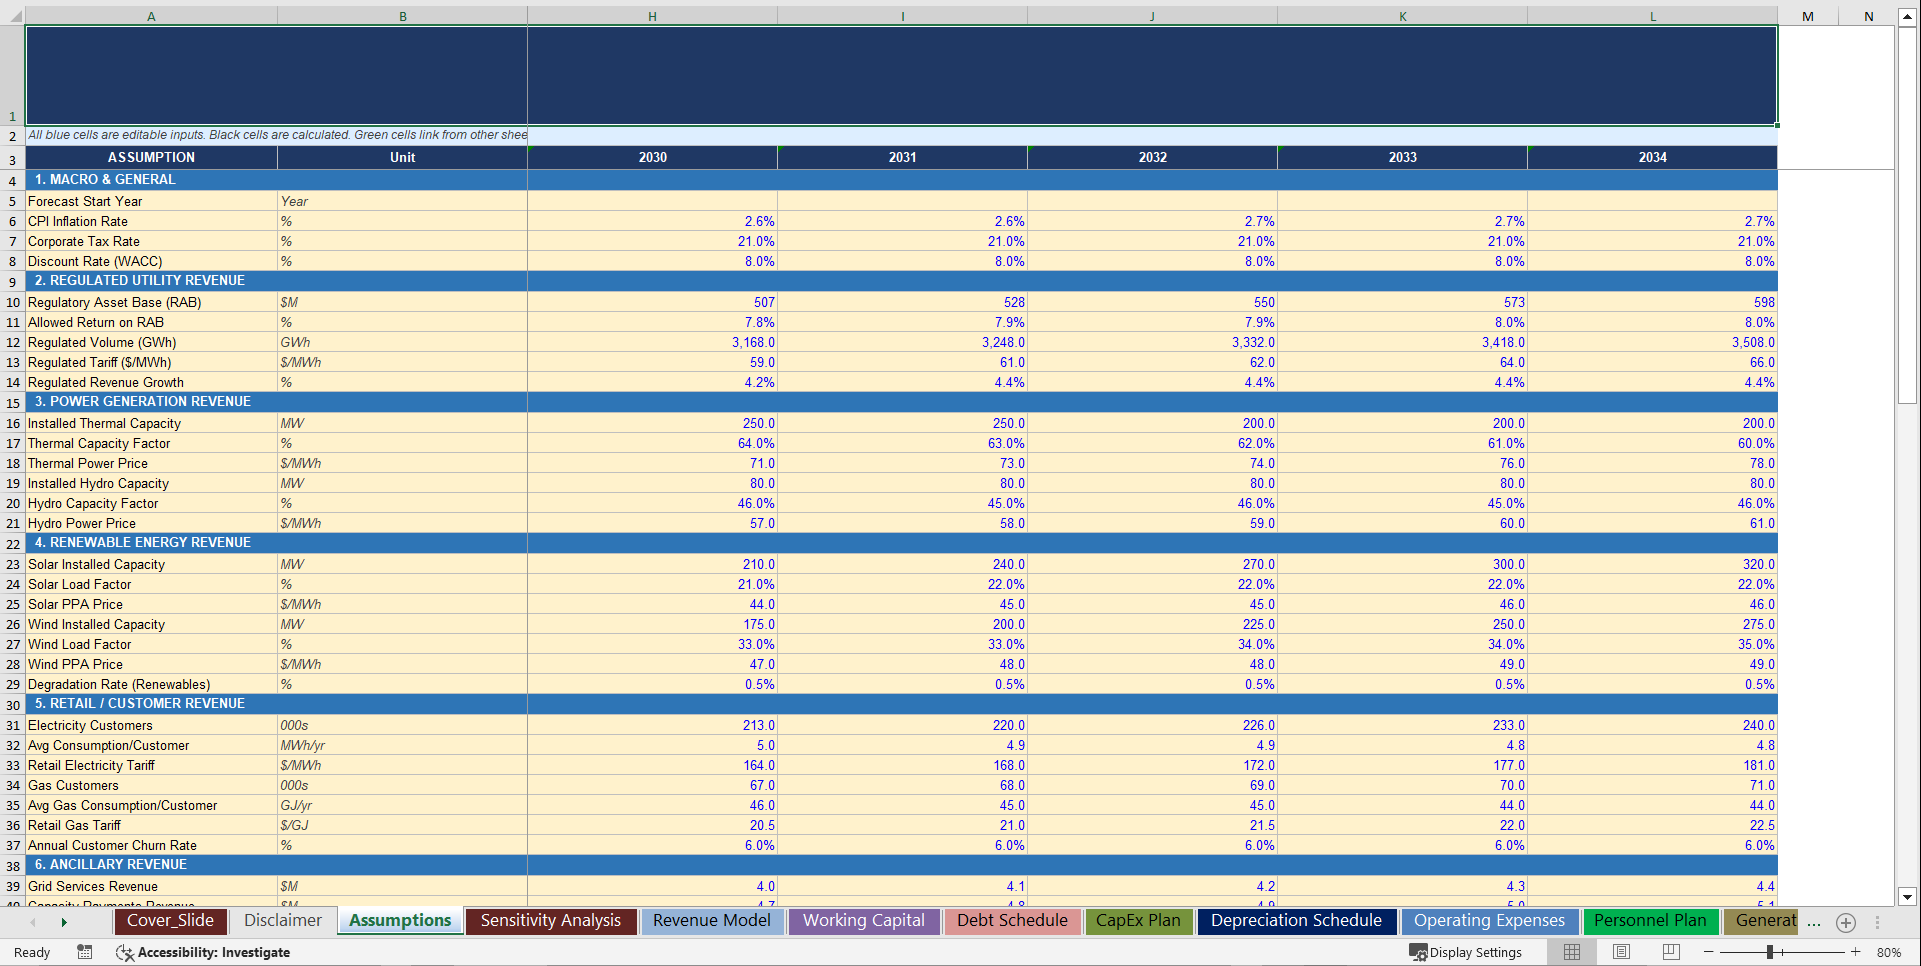
• 📊 Regulated Asset Base (RAB) & Tariff Model – Regulatory Asset Base with allowed return on capital, volume-based tariff revenue, regulated volume (GWh), and inflation-linked tariff adjustments – capturing the predictable, low-risk cash flow profile that makes regulated utilities so attractive to institutional capital
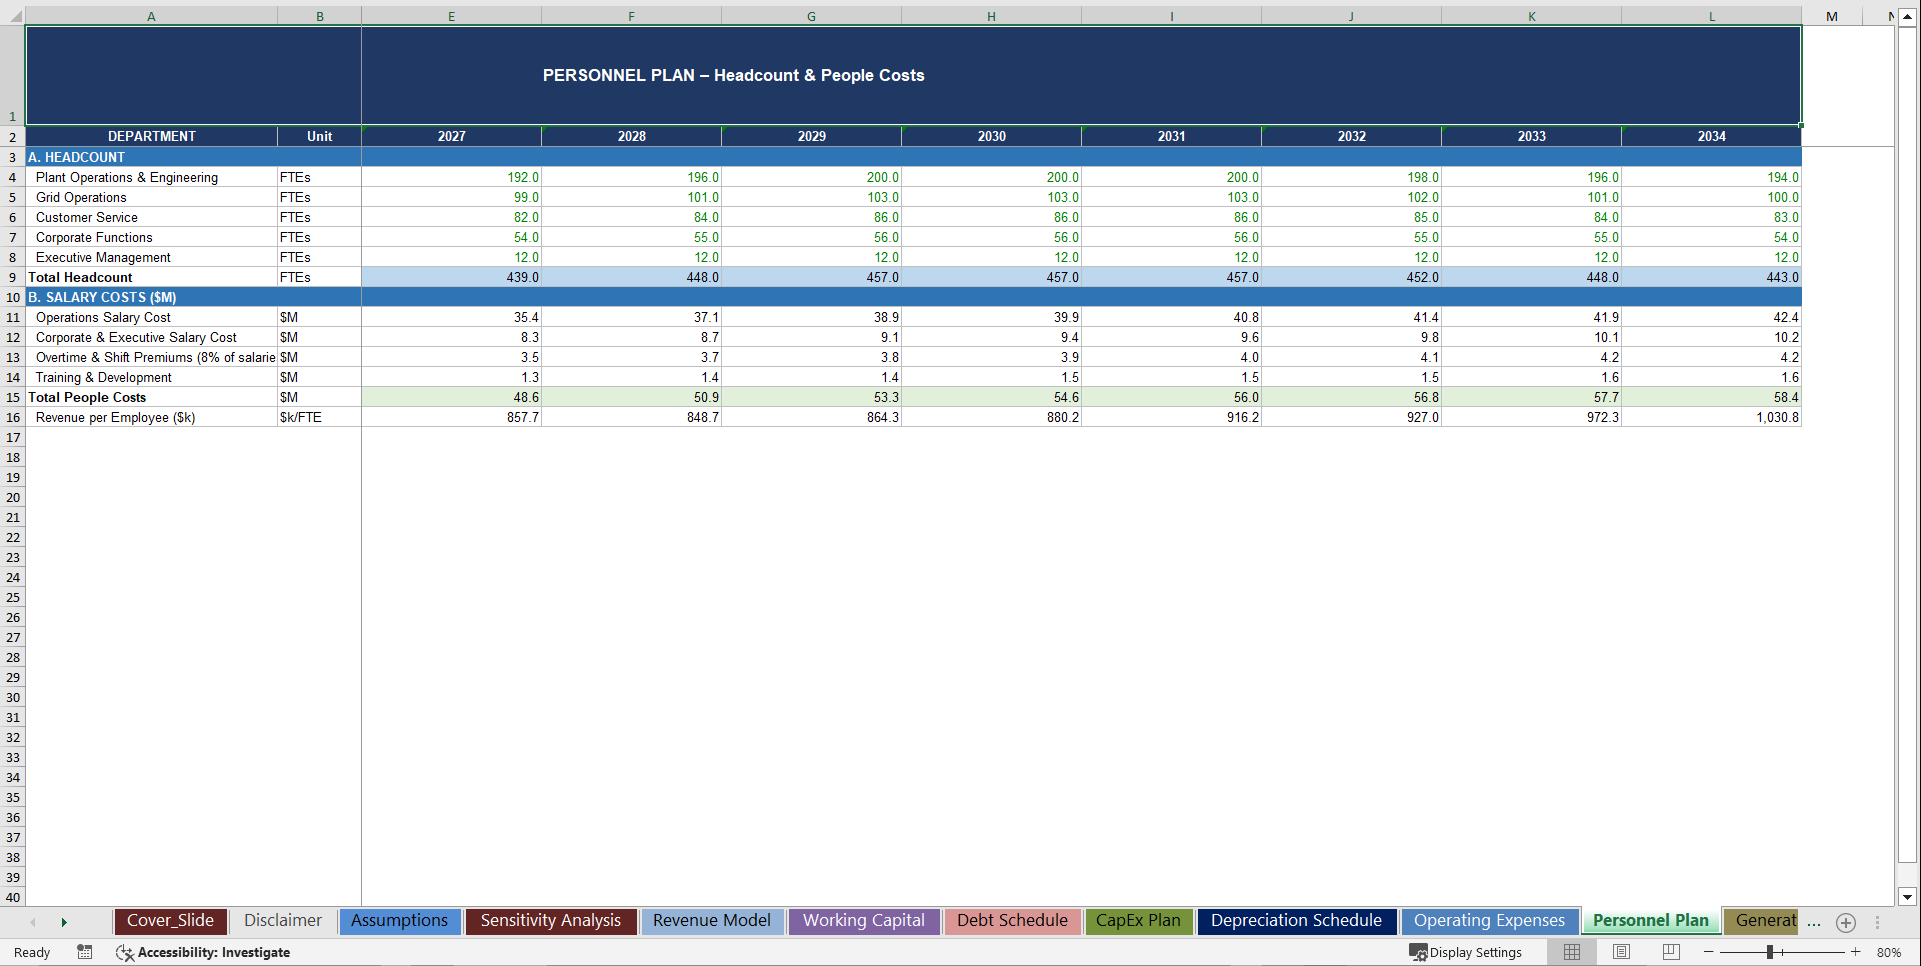
• 👥 Personnel & Hiring Plan (5 Departments) – Fully built-out org structure including Plant Operations & Engineering, Grid Operations, Customer Service, Corporate Functions, and Executive Management – with role-based salary scaling, benefits loading, overtime and shift premiums, and total people cost feeding directly into operating expenses
• 💸 Cost of Energy & Service Delivery Engine – Fuel costs (thermal generation), power purchase costs, grid losses, routine O&M per MW, equipment servicing, and field operations – all modeled as scalable cost drivers – feeding directly into gross margin and delivery efficiency metrics
• 🔧 Operating Expense Structure (OPEX) – Five cost categories: Cost of Energy, Operations & Maintenance, General & Administrative (including personnel), Customer & Commercial, and Technology & IT – with SCADA/grid management systems, smart metering, billing platforms, and cybersecurity – all scaling realistically against revenue
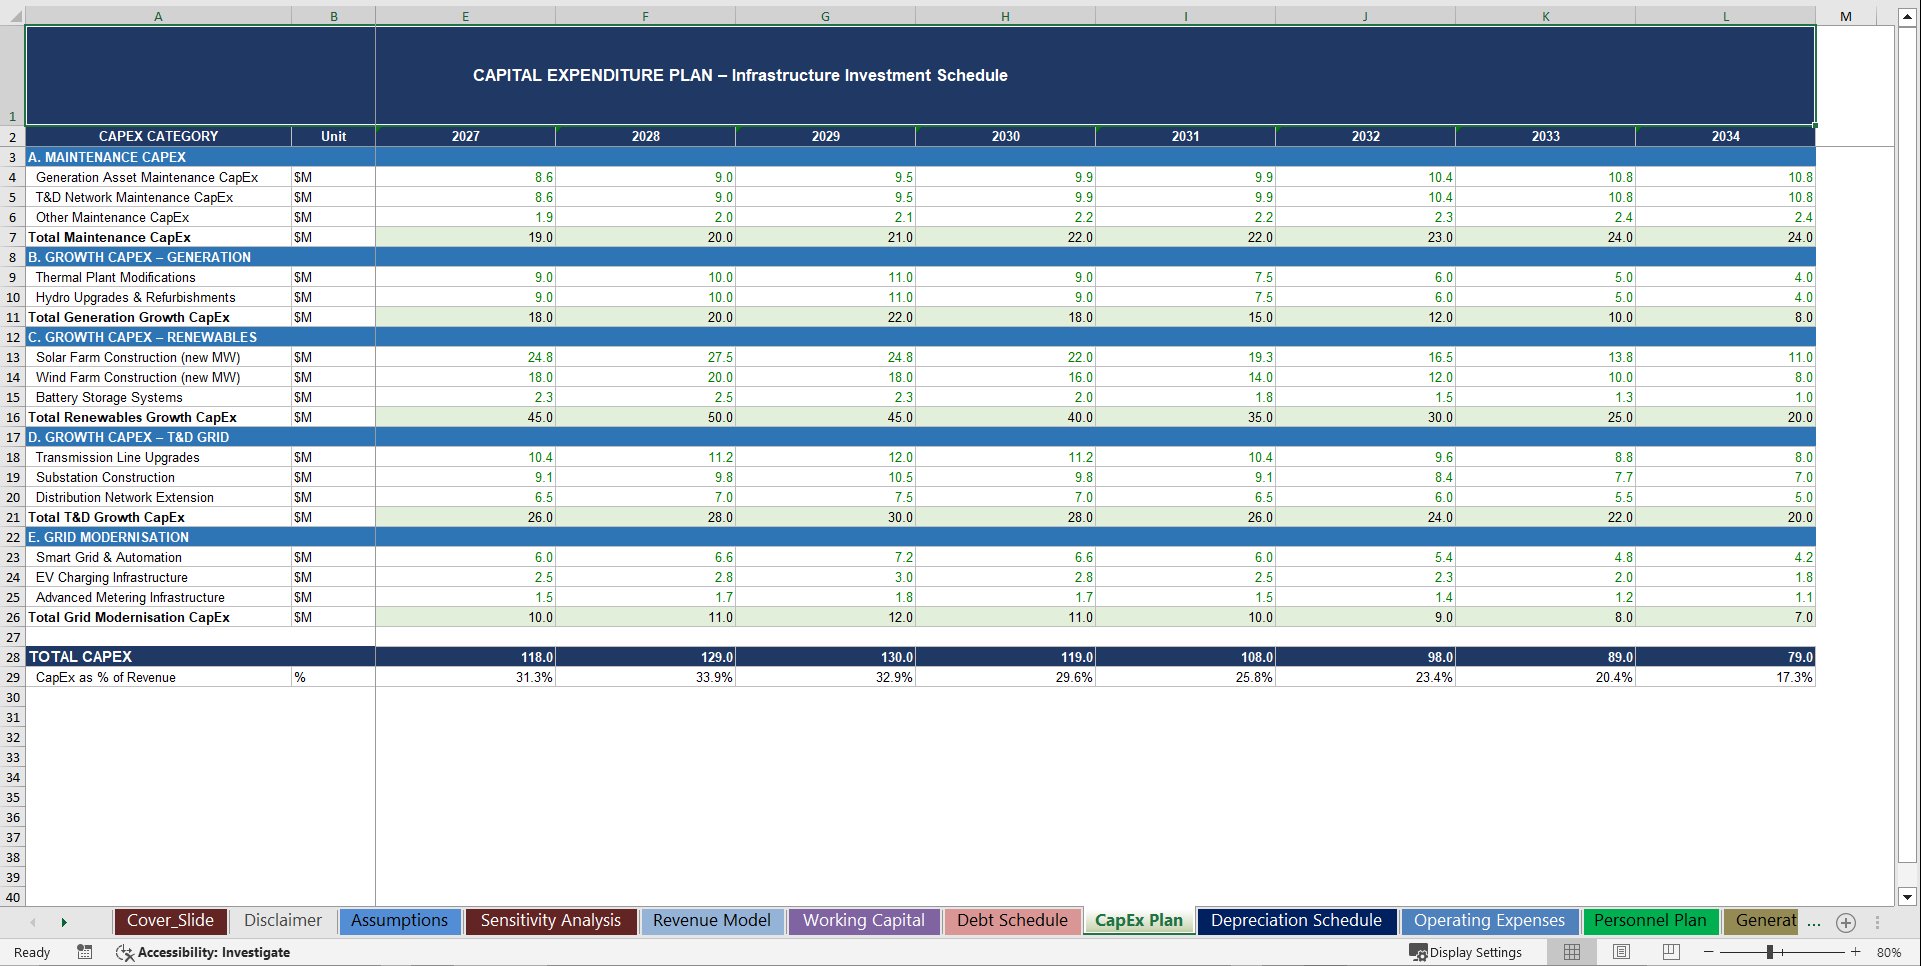
• 🏗️ Highly Detailed CapEx Plan (5 Categories) – Maintenance CapEx split by asset class, Generation Growth CapEx, Renewables CapEx (solar, wind, battery storage), T&D Grid CapEx (transmission lines, substations, distribution), and Grid Modernisation (smart grid, EV infrastructure, AMI) – with multi-year construction schedules and CapEx driving PP&E directly on the Balance Sheet
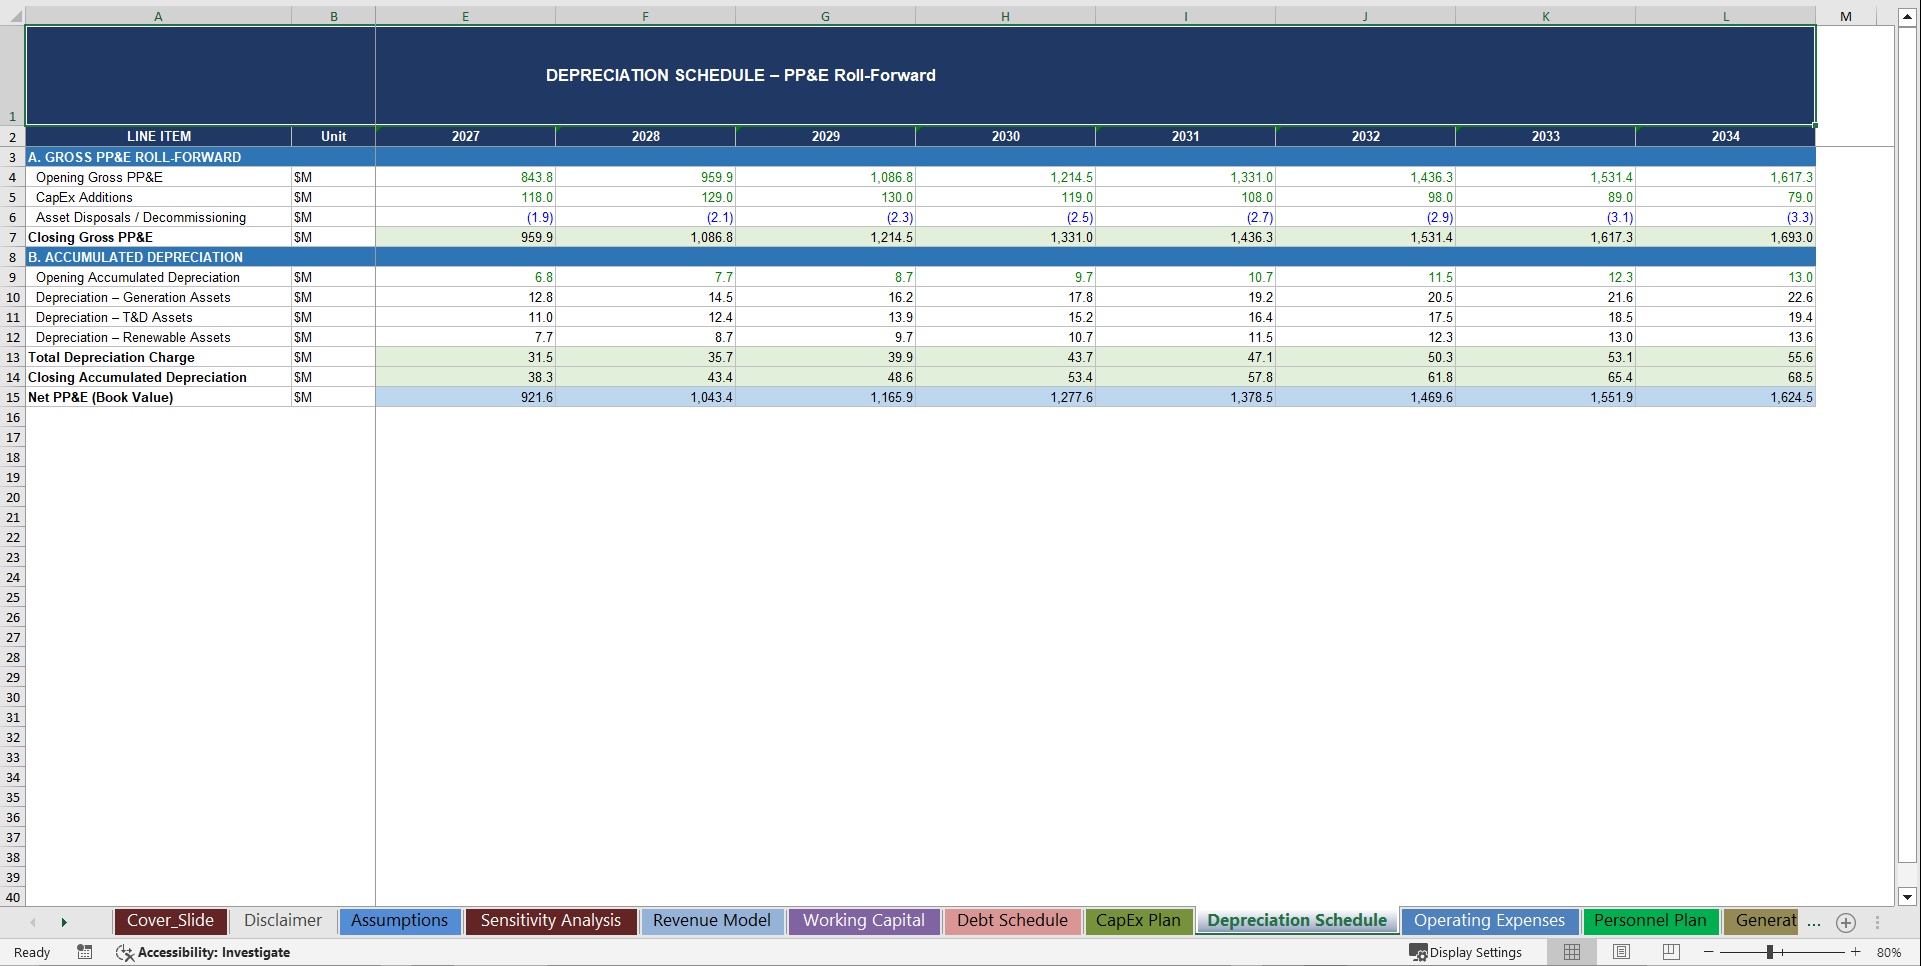
• 📉 Asset-Level Depreciation Schedule – Gross PP&E roll-forward with CapEx additions and asset disposals – accumulated depreciation tracked by generation assets (30-year life), T&D assets (35-year life), and renewable assets (25-year life) – straight-line methodology – net PP&E flowing directly into the Balance Sheet
• 🏦 Debt & Project Finance Structure – Opening long-term debt with annual new project finance drawdowns, scheduled amortisation, weighted average interest rate, and revolving credit facility – with interest expense flowing into the Income Statement and debt balances linked to the Balance Sheet – plus DSCR, Net Debt, and Net Debt/EBITDA calculated automatically every year
• 📦 Working Capital Model – Accounts receivable (DSO-driven), fuel and spare parts inventory (DIO-driven), accounts payable (DPO-driven), and accrued liabilities – all modeled as a function of revenue and cost structure – capturing real cash flow timing differences – with net working capital change fully integrated into the Cash Flow Statement
• 🔬 Regulatory & Pricing Assumption Framework – Regulated tariff structures, time-of-use pricing, PPA contracts (fixed vs variable), wholesale market price assumptions, inflation-linked tariff adjustments, and capacity payments – all centralized on the Assumptions sheet – zero hardcoding anywhere in the model
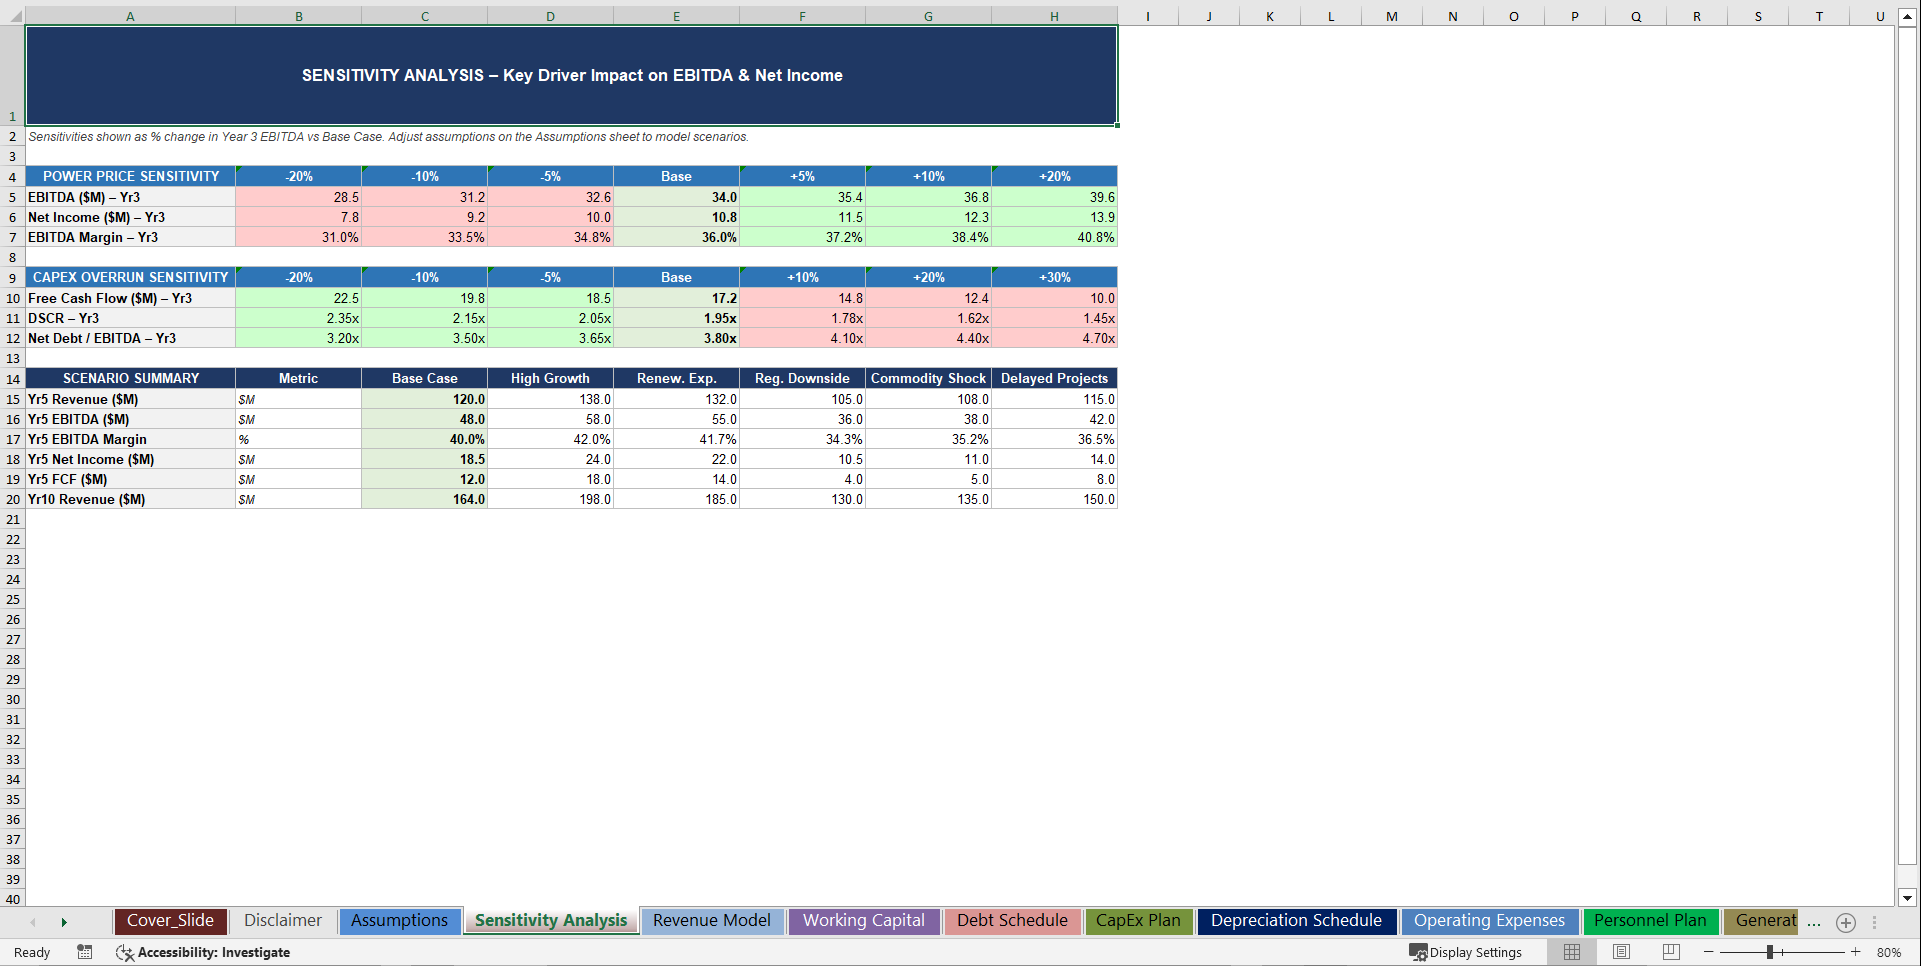
• 📊 Scenario & Sensitivity Framework – Six ready-to-run scenarios: Base Case, High Demand Growth, Renewable Expansion, Regulatory Downside, Commodity Price Shock, and Delayed Projects – plus sensitivity tables on power prices and CapEx overruns – giving instant answers to "what happens if" across your most critical value drivers
📤 Outputs
• 📈 10-Year Fully Integrated 3-Statement Model – Income Statement, Balance Sheet, and Cash Flow Statement fully linked and auto-balancing – every number driven by centralized assumptions – zero hardcoding outside the Assumptions sheet – full auditability across all 10 forecast periods – balance sheet check row confirms the model balances to zero every year
• 💰 Revenue Scaling Across All Four Segments – With clear breakdown across Regulated Utility, Power Generation, Retail, and Ancillary revenue – including year-on-year growth rates, segment mix evolution, and pricing trajectory – showing exactly how a diversified utility business scales as renewable capacity is added and customer base grows
• 📊 High-Margin EBITDA Profile – Gross profit, EBITDA, EBIT, EBT, and Net Income tracked annually with margin percentages on every line – demonstrating the inherent profitability of regulated and contracted energy businesses when capacity factors are optimised and cost structure is controlled
• ⚙️ Generation Capacity & Production Dashboard – Total installed capacity (MW) by asset type, total net production (GWh), cost per MWh, capacity utilisation rates, and energy production mix – making operational efficiency transparent, measurable, and investor-presentable every single year
• 💵 Cash Flow & Liquidity Build-Up – Operating cash flow, investing cash flow (CapEx), and financing cash flow (debt and equity) fully reconciled – closing cash balance feeding directly into the Balance Sheet – free cash flow and liquidity position visible at a glance across the full 10-year horizon
• 🔄 Full Cash Flow Statement (Indirect Method) – Net income, depreciation add-back, all working capital changes, CapEx outflows, new debt drawdowns, debt repayments, interest paid, equity raised, and dividends paid – fully reconciled to Balance Sheet cash – no plugs, no shortcuts
• 🏦 Balance Sheet with Automatic Balancing – Current assets (cash, AR, inventory, prepayments), non-current assets (net PP&E, regulatory assets, intangibles, deferred tax), current liabilities (AP, accruals, current debt, tax payable), non-current liabilities (LT debt, deferred tax, decommissioning provisions), and equity (paid-in capital, retained earnings) – auto-balances every year with a dedicated check formula
• 📉 Sensitivity Analysis Tables – Power price sensitivity showing EBITDA, net income, and EBITDA margin across a ±20% price range – CapEx overrun sensitivity showing free cash flow, DSCR, and leverage across a 20%–30% overrun range – plus a six-scenario summary with Year 5 and Year 10 revenue, EBITDA, and FCF
• 📺 Executive Dashboard – 12 KPI rows (revenue, EBITDA, net income, margins, CapEx, capacity, production, cash, DSCR, net debt, leverage) linked live to the model – plus six working charts: stacked revenue by segment, EBITDA margin trend, installed capacity by type, annual CapEx breakdown, EBITDA vs net income, and cash vs debt trajectory
🏆 Why This Model Stands Out
✅ Built for energy and utilities reality – Not a generic template. Every assumption reflects how utility businesses actually operate: regulated tariff structures, capacity factor constraints, degradation curves, multi-year CapEx programmes, project finance debt, and decommissioning provisions
✅ Regulated + merchant + renewable revenue – all in one model – Most models handle one revenue type. This one integrates RAB-based regulated returns, thermal and hydro generation, solar and wind PPAs, retail customer billing, and ancillary grid services simultaneously – exactly how diversified utilities are actually structured
✅ CapEx-first modeling approach – In energy businesses, capital expenditure drives everything. This model puts CapEx at the center – with five detailed categories, multi-year schedules, and direct PP&E linkage – ensuring depreciation, asset values, and cash flows are always consistent
✅ Project finance ready – DSCR calculated every year. Net Debt/EBITDA tracked annually. Debt service coverage, leverage ratios, and interest expense all flow automatically – answering the first questions any project finance lender or infrastructure investor will ask
✅ Fully integrated & dynamic – Change one assumption – a power price, a capacity factor, a tariff rate – and the entire model updates instantly across generation, revenue, costs, depreciation, debt service, and all three financial statements
✅ Investor & lender ready – Answers the key questions every infrastructure investor, utility acquirer, and project finance bank will ask:
• How scalable is the revenue base across regulated vs merchant vs renewable?
• What drives margins and how do they evolve as the generation mix shifts?
• How sensitive is EBITDA to power prices and capacity factors?
• Can the business service its debt? What is the DSCR?
• When does the business become self-financing and fully cash-generative?
✅ Fully transparent & auditable – No hidden logic, no locked cells, no hardcoded numbers outside the Assumptions sheet – every formula is traceable, every assumption visible, every output explainable in a due diligence process
📋 Model Structure – 14 Dedicated Sheets
• Executive Dashboard – Live KPI table with 12 metrics and 6 fully working charts
• Assumptions – Central control panel with 85+ rows of inputs across 12 categories
• Revenue Model – Four-segment revenue engine with totals and growth rates
• Generation Model – Asset-level capacity, production, and revenue for Thermal, Hydro, Solar, and Wind
• Personnel Plan – Headcount, salaries, benefits, overtime, and total people costs by department
• Operating Expenses – Five-category OPEX build: Cost of Energy, O&M, G&A, Commercial, Technology
• CapEx Plan – Five-category CapEx schedule: Maintenance, Generation, Renewables, T&D, Grid Modernisation
• Depreciation Schedule – Gross PP&E roll-forward, accumulated depreciation by asset class, net PP&E
• Debt Schedule – Project finance roll-forward, interest expense, DSCR, leverage ratios
• Working Capital – AR, inventory, AP, and accruals modeled on DSO/DPO/DIO basis
• Income Statement – Full P&L from revenue to retained earnings with margin analysis on every line
• Balance Sheet – Auto-balancing with dedicated balance check – assets always equal liabilities plus equity
• Cash Flow Statement – Indirect method, fully reconciled, closing cash linked to Balance Sheet
• Sensitivity Analysis – Power price tables, CapEx overrun tables, and six-scenario summary
🚀 Who This Is For
• Private equity and infrastructure funds evaluating utility or energy acquisitions
• Renewable energy developers modeling solar, wind, and storage project economics
• Corporate finance and FP&A teams building 10-year strategic plans
• CFOs presenting financial forecasts to boards, lenders, and investors
• Energy companies modeling generation mix transitions toward renewables
• Project finance analysts sizing debt, testing coverage, and stress-testing assumptions
• Institutional investors evaluating EBITDA scalability and cash flow quality in regulated utilities
• Founders and operators preparing for fundraising, strategic partnerships, or exit
🔥 Bottom Line
This isn't just a spreadsheet.
It's a scalable financial operating system for an energy and utilities business – built with the same rigor applied by infrastructure funds, utility holding companies, and project finance banks – designed to help you:
• Model revenue across regulated, merchant, renewable, and retail segments simultaneously
• Control capital-intensive cost structures and track multi-decade asset lifecycles
• Size project finance debt and demonstrate coverage to lenders
• Stress-test EBITDA and cash flow against power prices, capacity factors, and CapEx overruns
• Build a credible, investor-grade financial story that survives due diligence
If your business generates electrons, moves them through wires, sells them to customers, or finances the infrastructure that makes all of it possible – this model was built for you.
Key Words:
Strategy & Transformation, Growth Strategy, Strategic Planning, Strategy Frameworks, Innovation Management, Pricing Strategy, Core Competencies, Strategy Development, Business Transformation, Marketing Plan Development, Product Strategy, Breakout Strategy, Competitive Advantage, Mission, Vision, Values, Strategy Deployment & Execution, Innovation, Vision Statement, Core Competencies Analysis, Corporate Strategy, Product Launch Strategy, BMI, Blue Ocean Strategy, Breakthrough Strategy, Business Model Innovation, Business Strategy Example, Corporate Transformation, Critical Success Factors, Customer Segmentation, Customer Value Proposition, Distinctive Capabilities, Enterprise Performance Management, KPI, Key Performance Indicators, Market Analysis, Market Entry Example, Market Entry Plan, Market Intelligence, Market Research, Market Segmentation, Market Sizing, Marketing, Michael Porter's Value Chain, Organizational Transformation, Performance Management, Performance Measurement, Platform Strategy, Product Go-to-Market Strategy, Reorganization, Restructuring, SWOT, SWOT Analysis, Service 4.0, Service Strategy, Service Transformation, Strategic Analysis, Strategic Plan Example, Strategy Deployment, Strategy Execution, Strategy Frameworks Compilation, Strategy Methodologies, Strategy Report Example, Value Chain, Value Chain Analysis, Value Innovation, Value Proposition, Vision Statement, Corporate Strategy, Business Development, Business plan pdf, business plan, PDF, Business Plan DOC, Business Plan Template, PPT, Market strategy playbook, strategic market planning, competitive analysis tools, market segmentation frameworks, growth strategy templates, product positioning strategy, market execution toolkit, strategic alignment playbook, KPI and OKR frameworks, business growth strategy guide, cross-functional strategy templates, market risk management, market strategy PowerPoint doc, guide, ebook, e-book ,McKinsey Change Playbook, Organizational change management toolkit, Change management frameworks 2025, Influence model for change, Change leadership strategies, Behavioral change in organizations, Change management PowerPoint templates, Transformational leadership in change, supply chain KPIs, supply chain KPI toolkit, supply chain PowerPoint template, logistics KPIs, procurement KPIs, inventory management KPIs, supply chain performance metrics, manufacturing KPIs, supply chain dashboard, supply chain strategy KPIs, reverse logistics KPIs, sustainability KPIs in supply chain, financial supply chain KPIs, warehouse KPIs, digital supply chain KPIs, 1200 KPIs, supply chain scorecard, KPI examples, supply chain templates, Corporate Finance SOPs, Finance SOP Excel Template, CFO Toolkit, Finance Department Procedures, Financial Planning SOPs, Treasury SOPs, Accounts Payable SOPs, Accounts Receivable SOPs, General Ledger SOPs, Accounting Policies Template, Internal Controls SOPs, Finance Process Standardization, Finance Operating Procedures, Finance Department Excel Template, FP&A Process Documentation, Corporate Finance Template, Finance SOP Toolkit, CFO Process Templates, Accounting SOP Package, Tax Compliance SOPs, Financial Risk Management Procedures.
NOTE: Our digital products are sold on an "as is" basis, making returns and refunds unavailable post-download. Please preview and inquire before purchasing. Please contact us before purchasing if you have any questions! This policy aligns with the standard Flevy Terms of Usage.
Got a question about the product? Email us at support@flevy.com or ask the author directly by using the "Ask the Author a Question" form. If you cannot view the preview above this document description, go here to view the large preview instead.
Source: Best Practices in Energy Industry, Integrated Financial Model Excel: Energy & Utilities Company Advanced 10-Year Financial Model Excel (XLSX) Spreadsheet, SB Consulting
ABOUT THE AUTHOR
SB Consulting is dedicated to empowering businesses to communicate their ideas with impact. This consulting firm specializes in teaching organizations how to create effective corporate and management presentations. With training from top-tier global consulting firms, including McKinsey, BCG, and Porsche Consulting, extensive expertise in presentation design and ... [read more]
Ask the Author a Question
You must be logged in to contact the author.
