
 Click main image to view in full screen.
Data Center Project Finance Suite (5 Models + 6 Manuals) – Excel XLSX
Excel (XLSX) + Zip archive file (ZIP)


BENEFITS OF THIS DOWNLOADABLE EXCEL DOCUMENT
- Takes a data center project from a list of candidate sites all the way to a defensible investment committee decision, through one connected chain of five Excel instruments.
- Ties physical energy capacity to commercially billable capacity, so you never underwrite megawatts the site cannot actually energize.
- Includes over 100 pages of user manuals and a checks panel in every workbook, so any number can be traced back to a sourced input in minutes.
PROJECT FINANCE EXCEL DESCRIPTION
A data center is a factory whose raw material is electricity and whose product is computing capacity. Deciding whether to build one is not a single calculation; it is a sequence of five questions that have to be answered in order, by different specialists, without any of them quietly overwriting the others. This suite is that sequence, built as five connected Excel instruments and documented in more than one hundred and fifty pages of manuals.
WHAT THE FIVE INSTRUMENTS DO
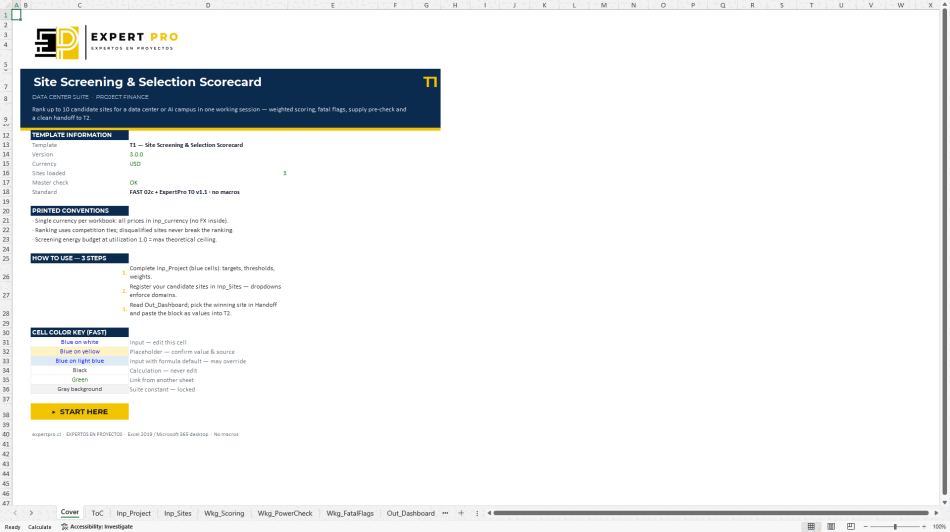
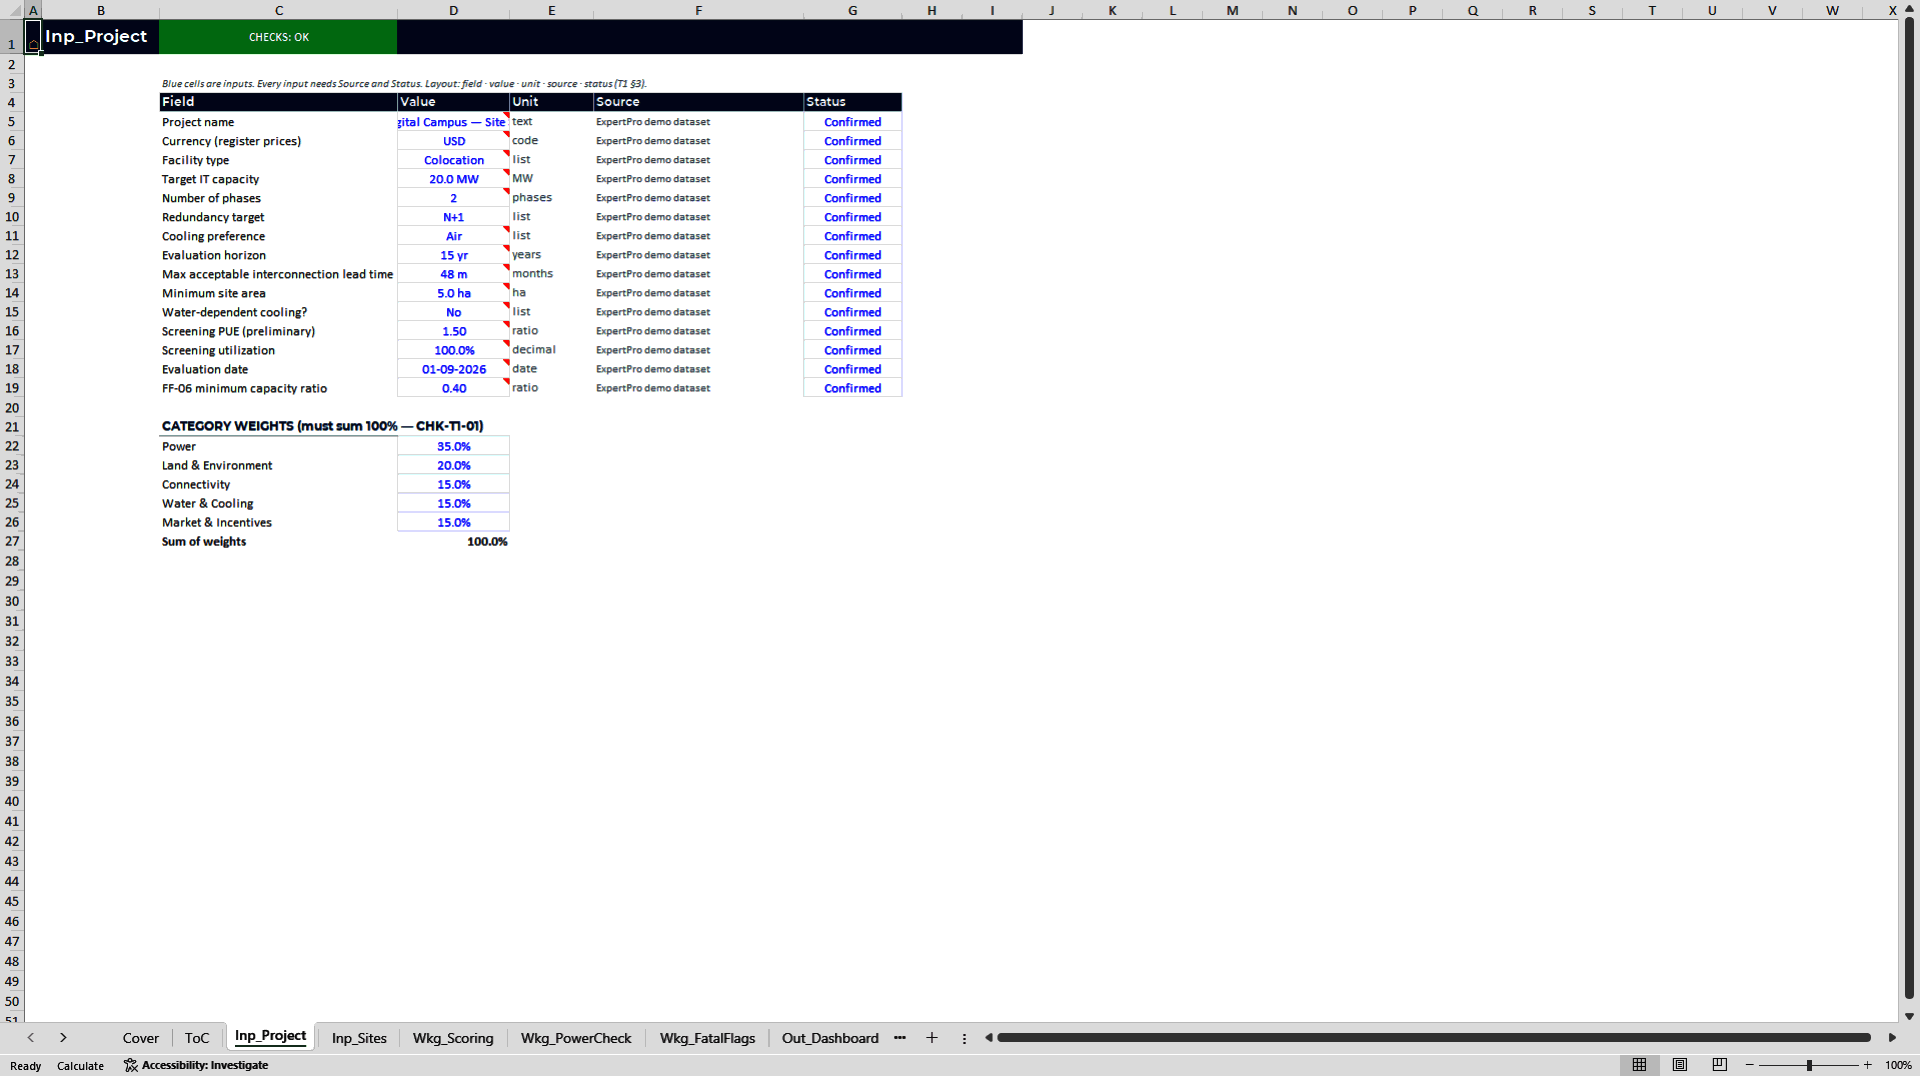
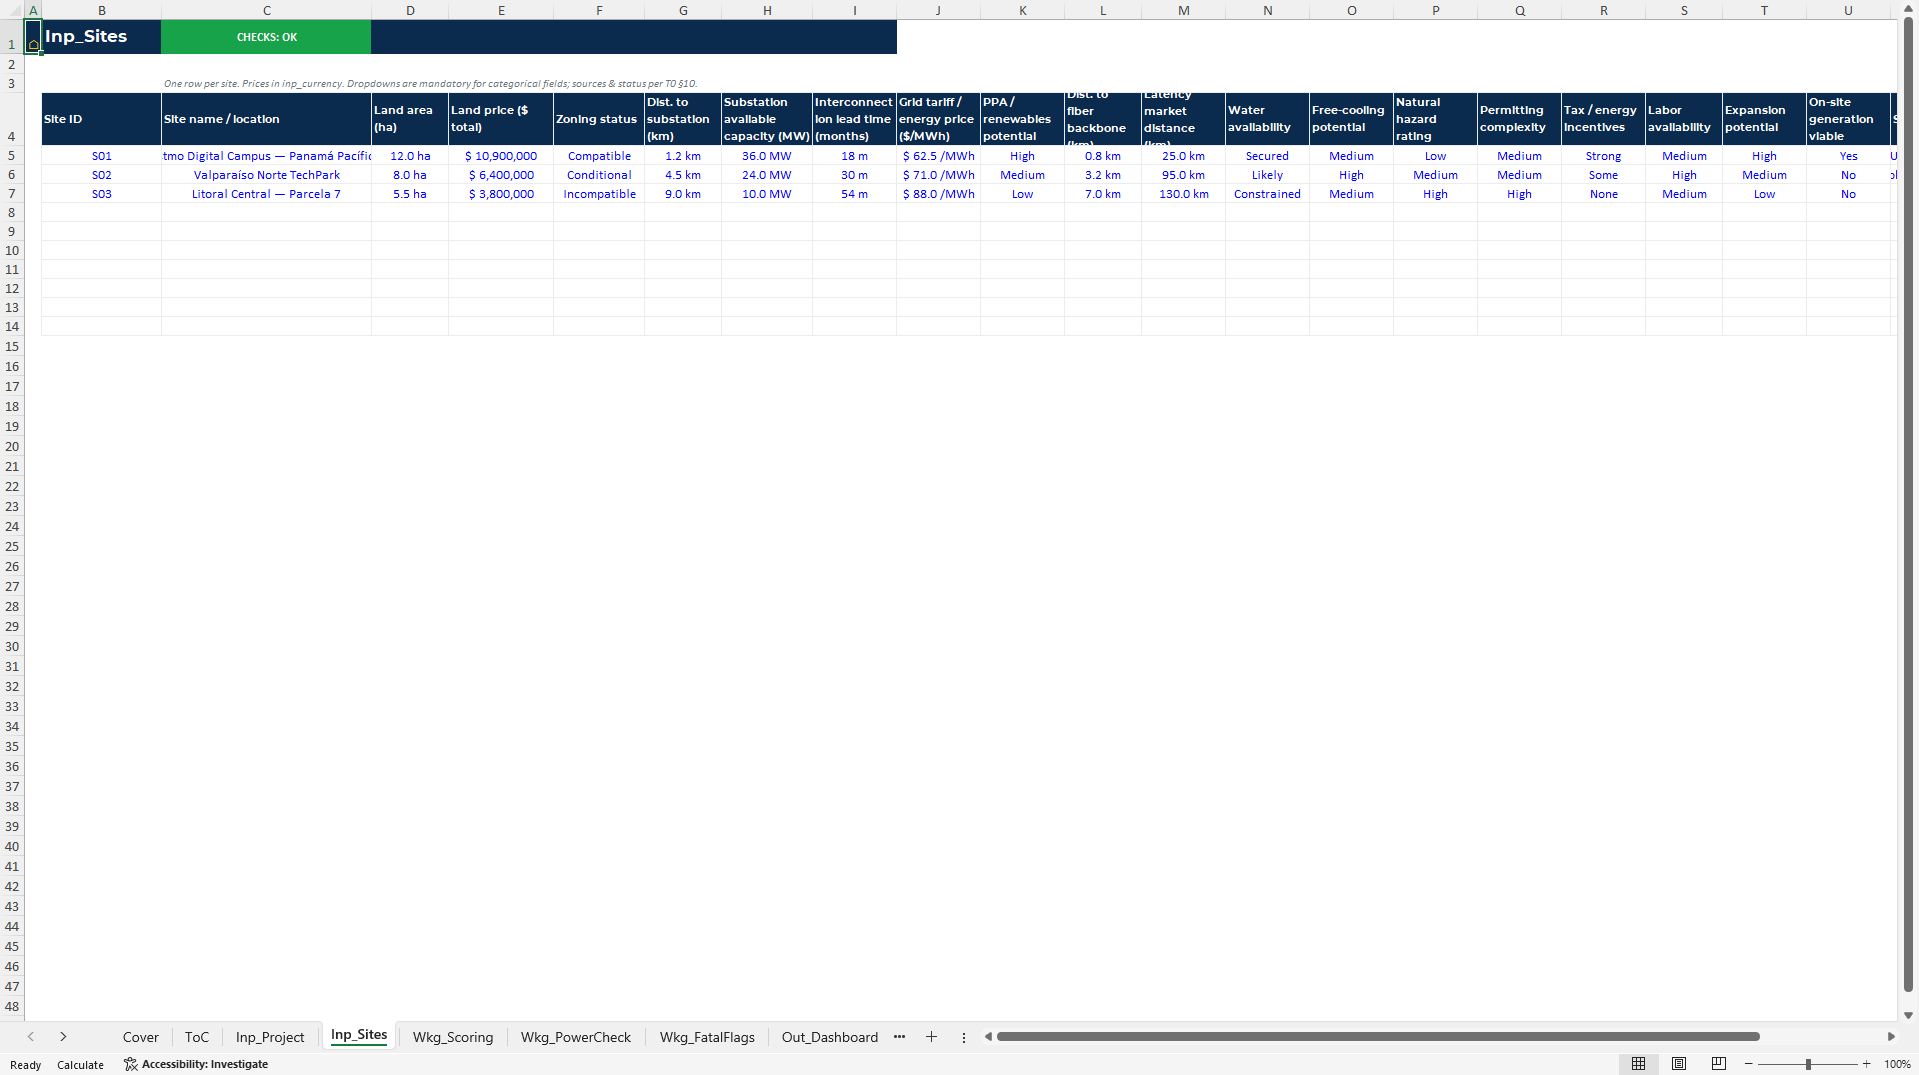
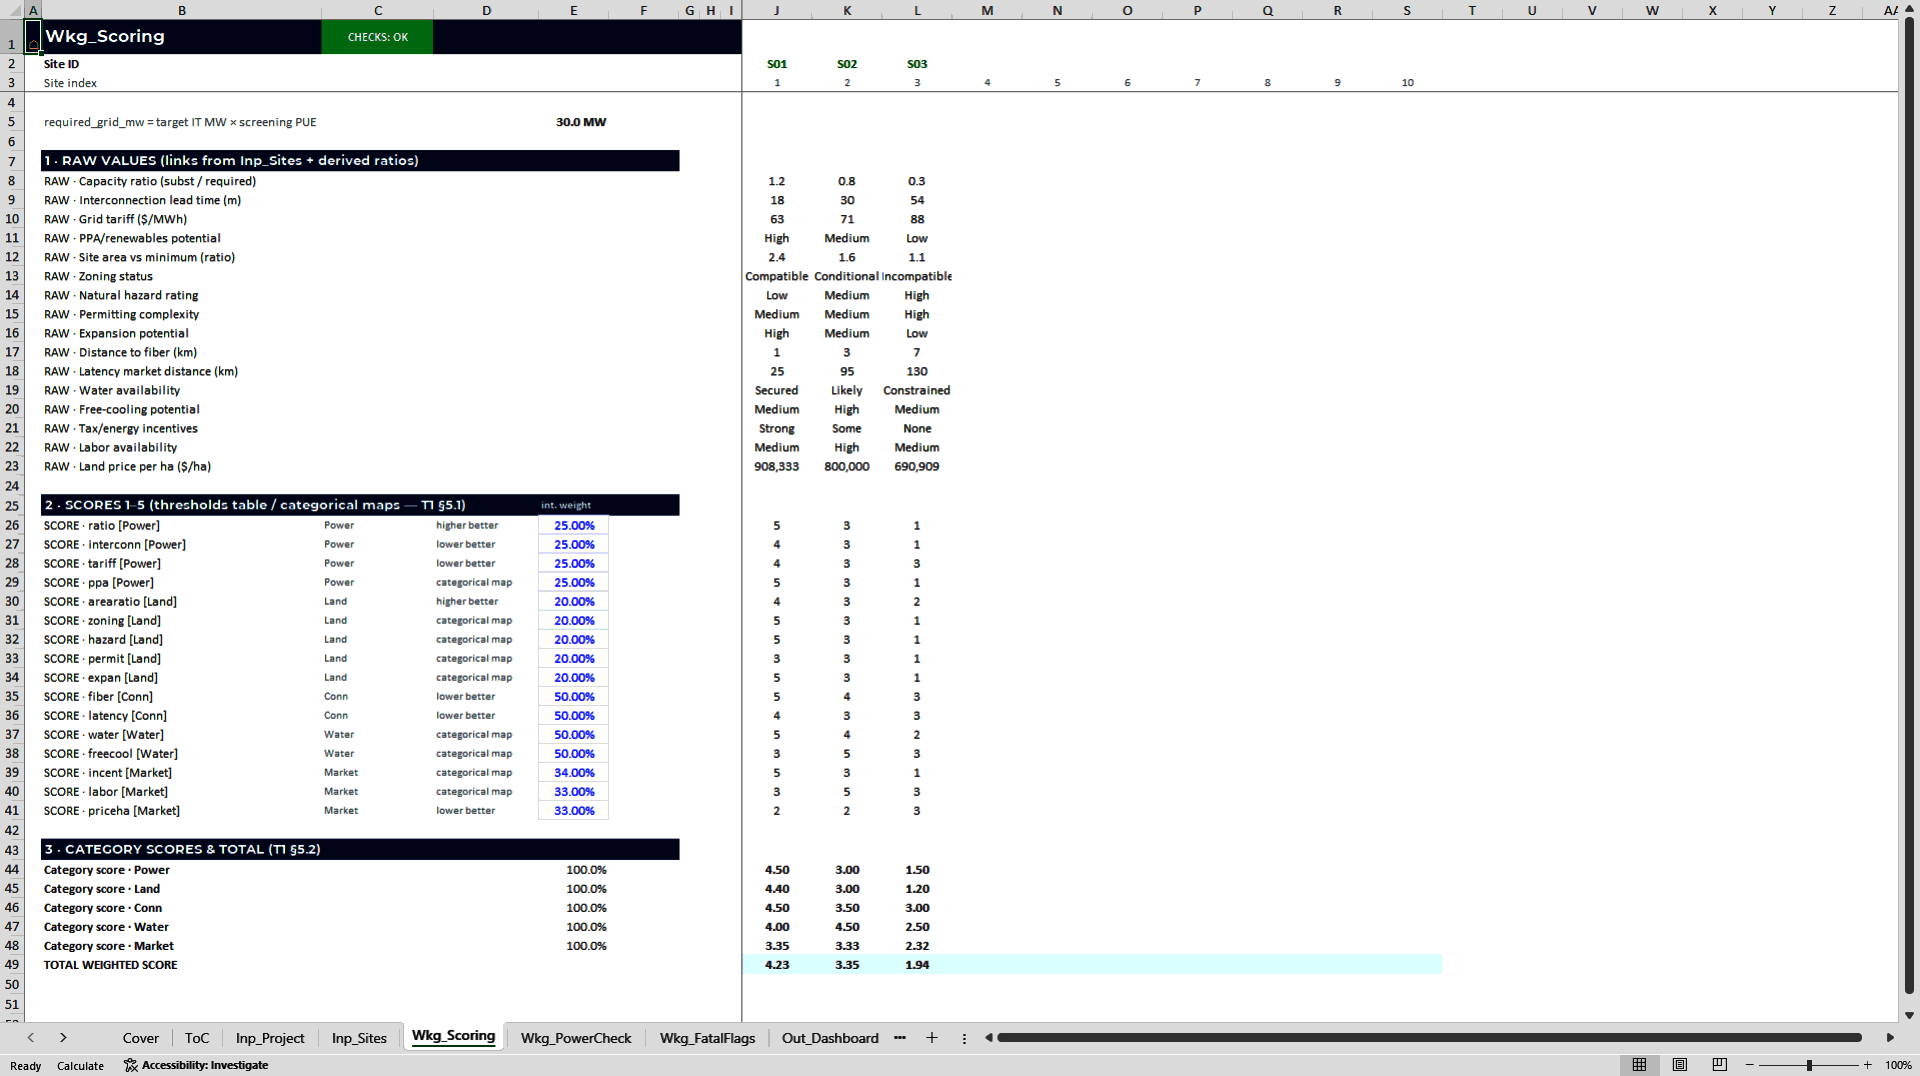
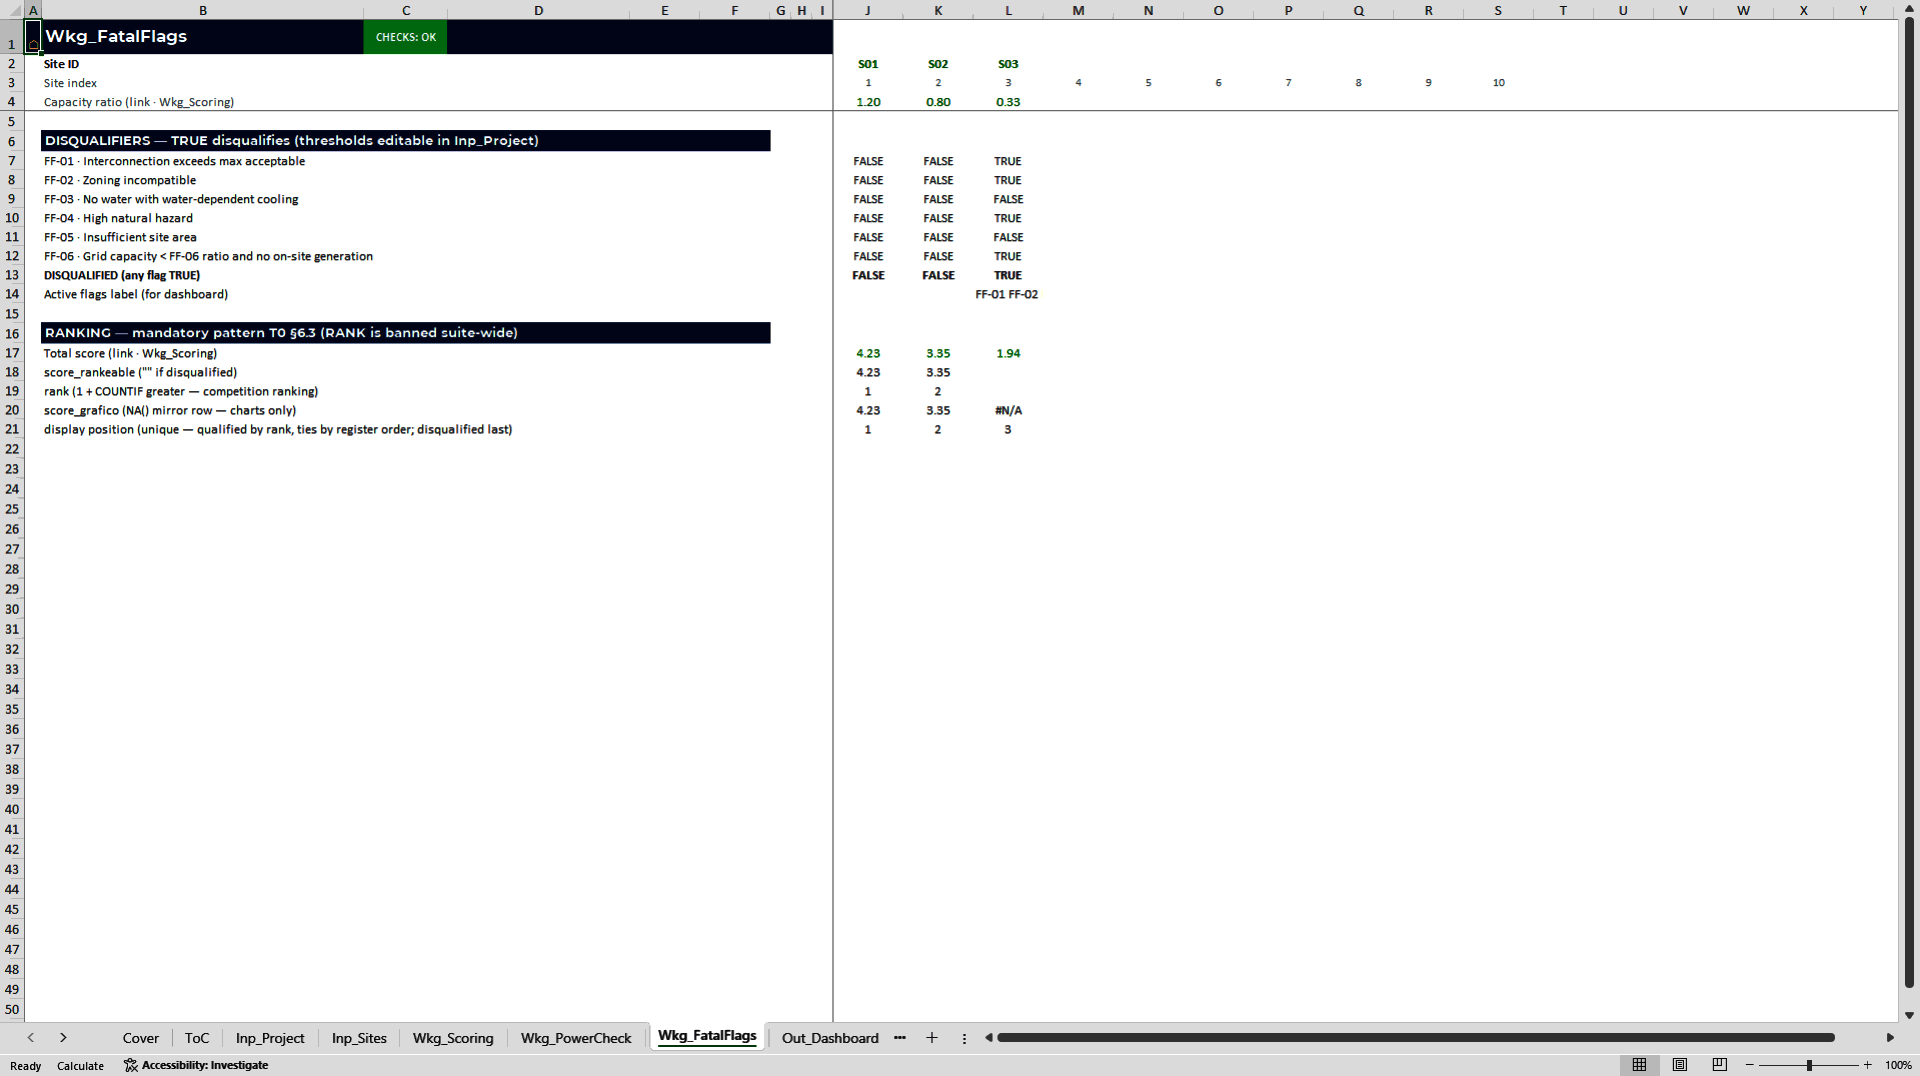
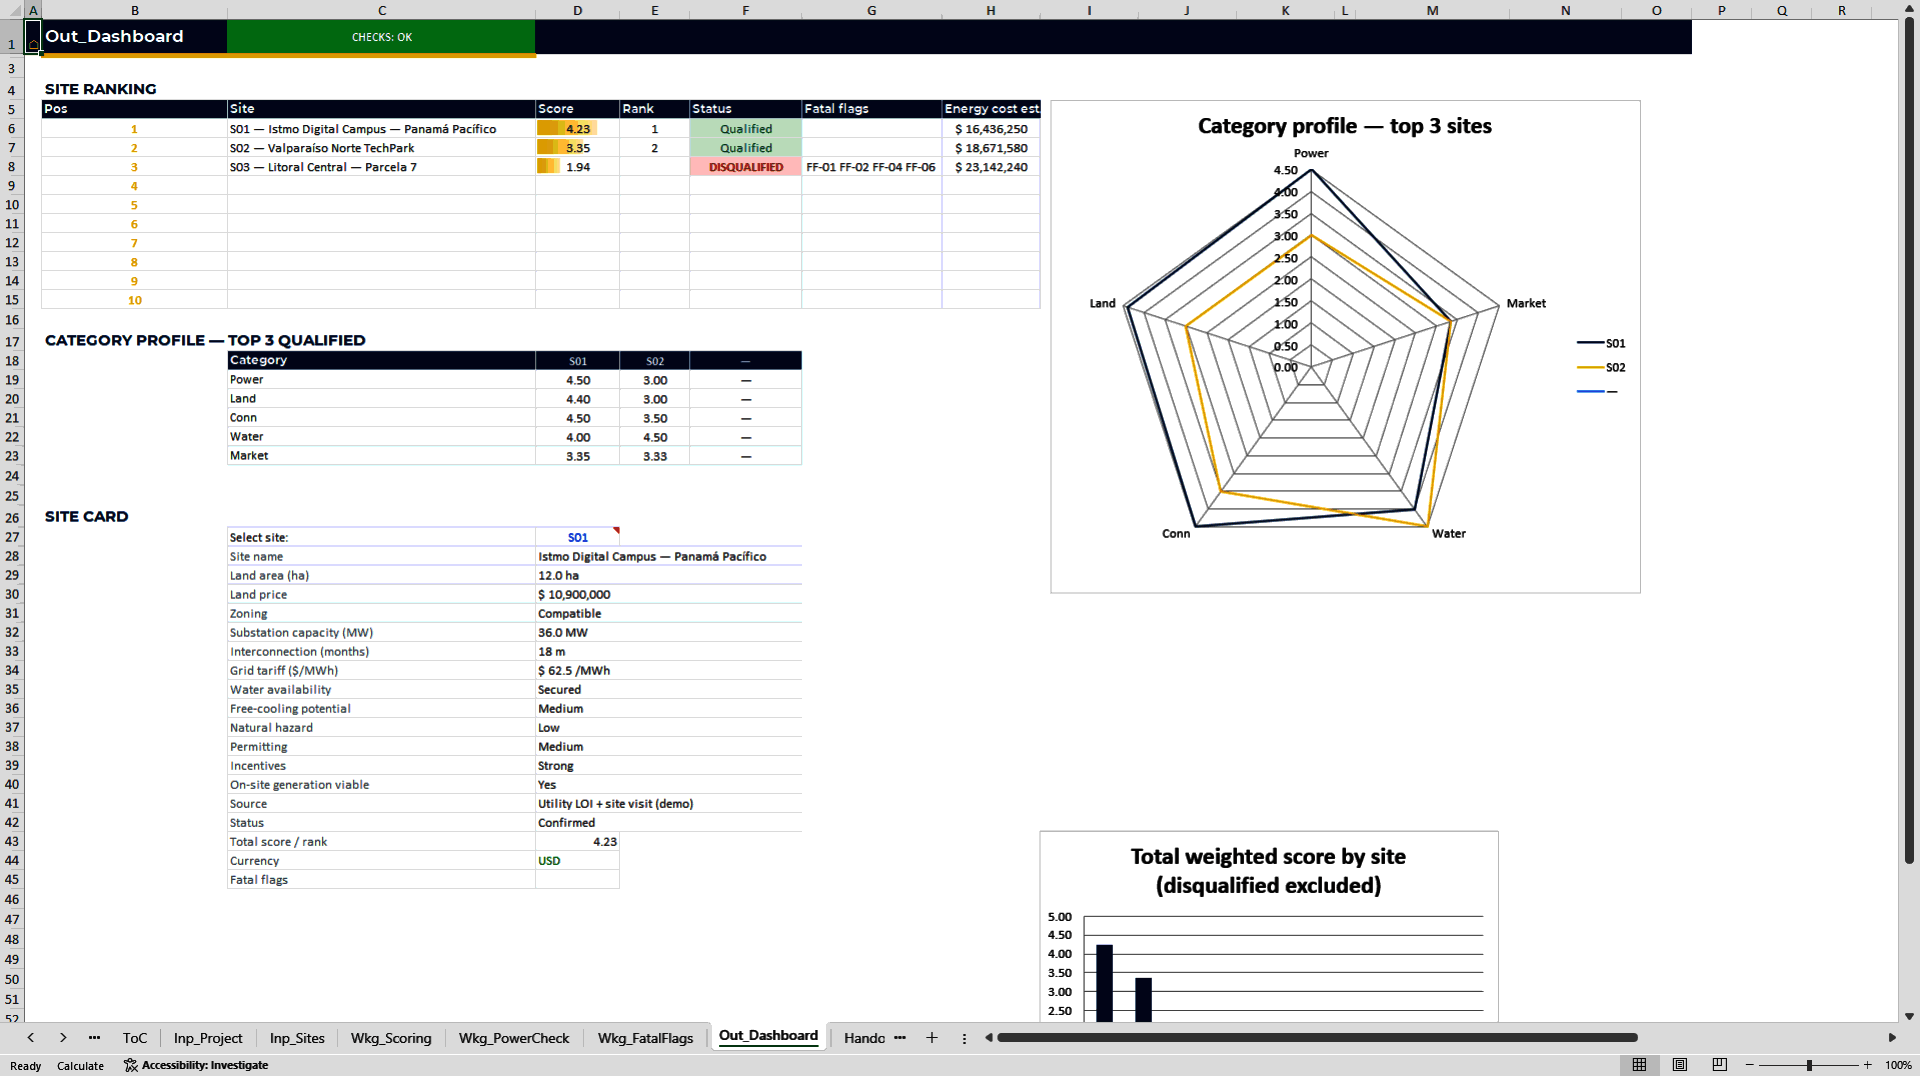
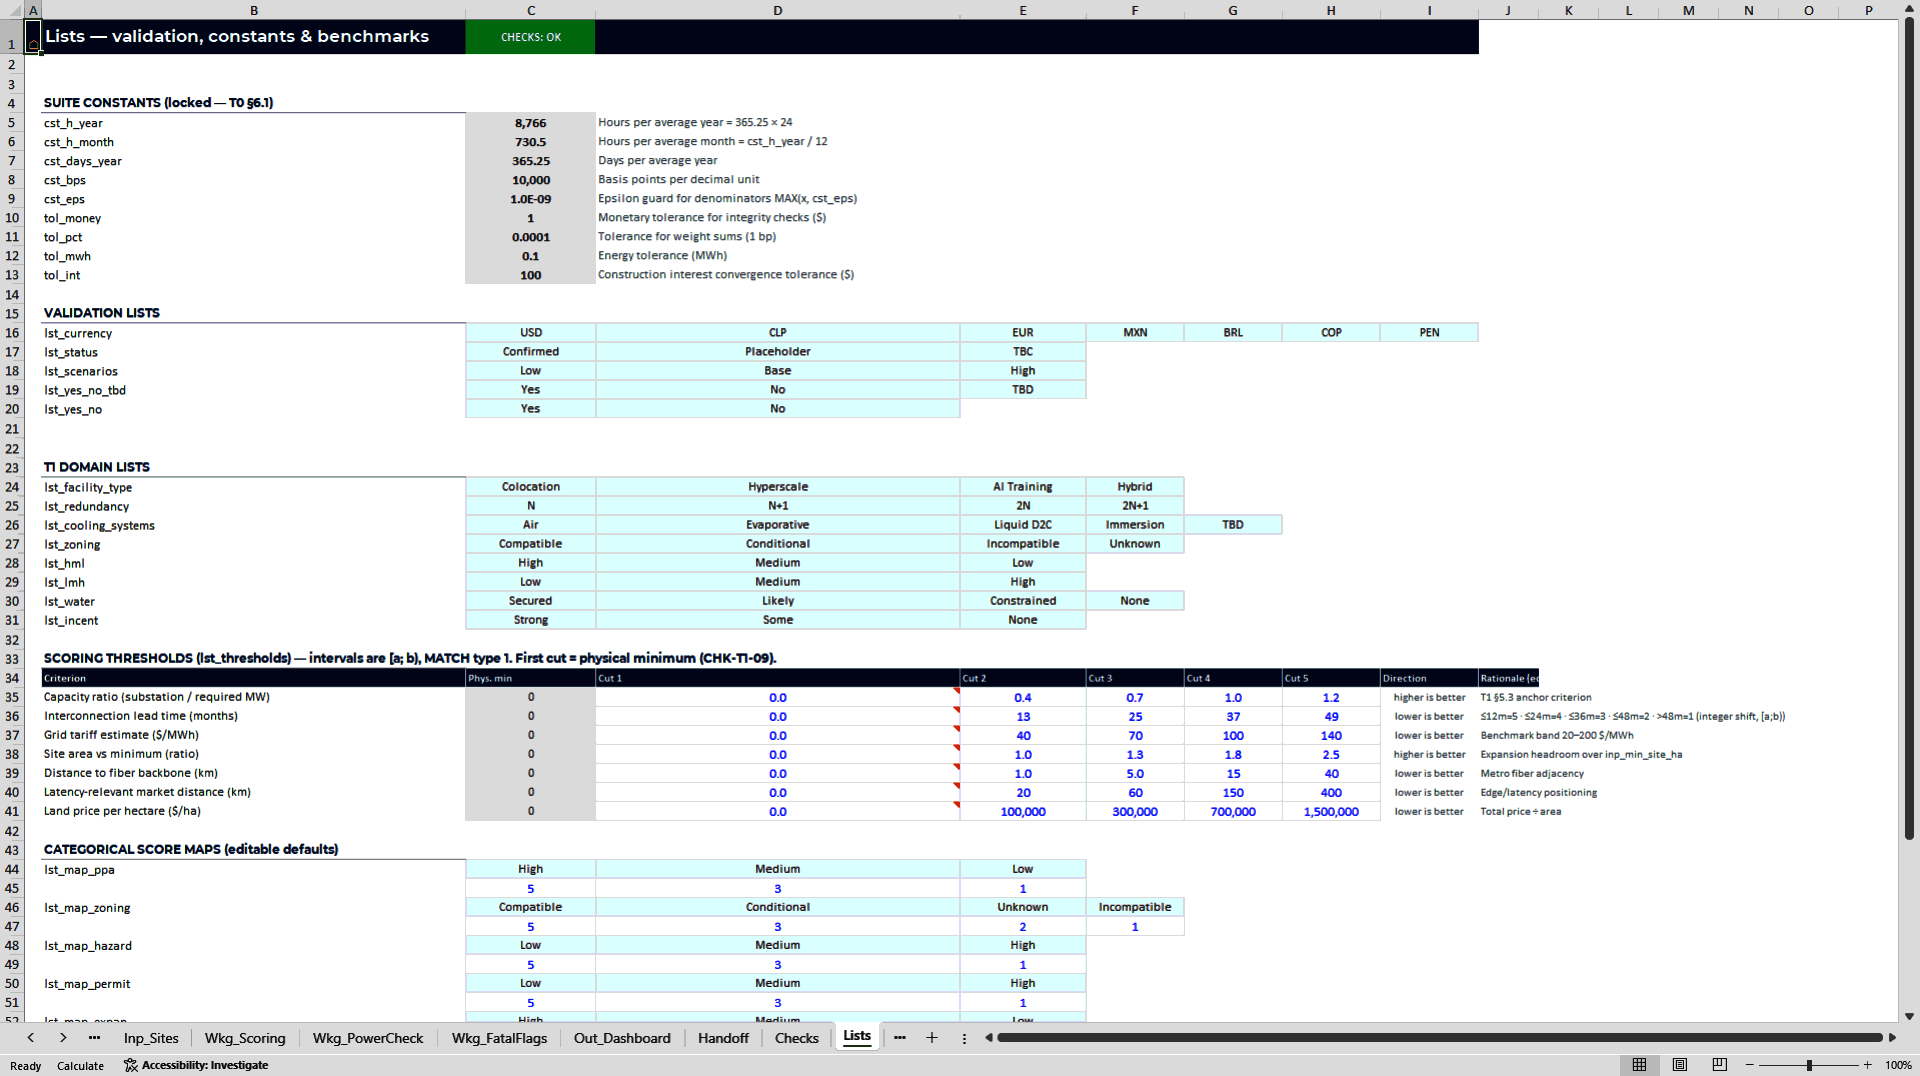
T1 – Site Screening Scorecard. Evaluates up to 10 candidate sites against 7 quantitative criteria, 9 categorical criteria and 6 fatal flags, covering land price and zoning, substation capacity, interconnection lead time, power tariff, distance to fiber and to market, water availability, free cooling potential, natural hazards, permitting complexity, incentives and onsite generation potential. Weights encode your strategy; fatal flags stay separate, so a site with an unacceptable condition is disqualified no matter how high it scores. Outputs a ranking, category profiles, comparison charts and a one-page site card. T1 answers where diligence money should go, not whether the project is feasible.
T2 – Power and Energy Assessment. Builds 120 months of electrical demand from the bottom up: capacity blocks, halls, pods or phases, kW per rack or per GPU, utilization, deployment dates and ramps, then PUE, auxiliary loads and seasonality. Against that, up to 5 supply options, each with capacity, availability date, ramp, price, escalation, firmness, emissions, associated CapEx, O and M and dispatch priority, resolved month by month through merit-order dispatch. Tells you when the facility is fully energizable, whether gap months exist, the blended cost per MWh and per kW per month, how much IT the available supply can really carry, and the water and emissions footprint. Low, Base and High scenarios are run and exported separately, never blended.
T3 – Technical Sizing and CapEx Budget. Converts the energy plan into a 32-line budget across land, hard costs and soft costs, including civil works, core and shell, electrical fit-out, mechanical and cooling, interconnection, security, BESS, design, permitting, legal, commissioning, insurance, contingency and development fee. Every line carries its own start month, end month and disbursement curve, straight-line, S-curve or manual, producing a monthly CapEx calendar of up to 60 months, the project S-curve, peak-spend months, and CapEx per MW of IT and per square meter for benchmarking. Deliberately pre-financing: no construction interest or IDC, because those belong to T4.
T4 – Financial Model. A 180-month model that receives the T2 energy plan and the T3 budget and adds revenue contracts, operating costs and capital structure. Customer contracts carry contracted capacity, start date, term, initial rent per kW per month and escalation, and billable capacity is capped against the physical energy limit from T2. OpEx covers utilities, maintenance, staffing and security, insurance, property taxes, G and A, management fee, vacancy and recoveries, producing trended and untrended NOI. Financing covers senior and mezzanine construction debt, LTC, rates, fees, current-pay or capitalized interest, and a permanent loan sized by the binding minimum of LTV, DSCR and debt yield. Construction interest circularity is resolved through a visible frozen-interest routine instead of Excel iteration. Exit modeling uses cap rate, selling costs and debt payoff. Reports levered and unlevered IRR, equity multiples, net profit, yield-on-cost, development spread, DSCR, debt yield and loan sizing, organized for three audiences: sponsor, equity and lender. Sensitivities run on contract pricing, exit cap rate, vacancy, energy cost, construction duration and CapEx. Metrics are pre-corporate-tax by design.
T5 – Comparison Dashboard. The committee room. Receives up to 12 sealed T4 runs, validates that they are structurally consistent in currency, vintage and origin, normalizes their KPIs and scores them against an explicit objective, whether maximizing IRR, minimizing energy risk or a balanced blend. Absolute hurdles such as minimum IRR or minimum DSCR act as constraints independent of score. Produces a ranking, a hurdle verdict, comparison charts, a sensitivity tornado and a Committee Card summarizing the recommended run.
HOW THEY CONNECT
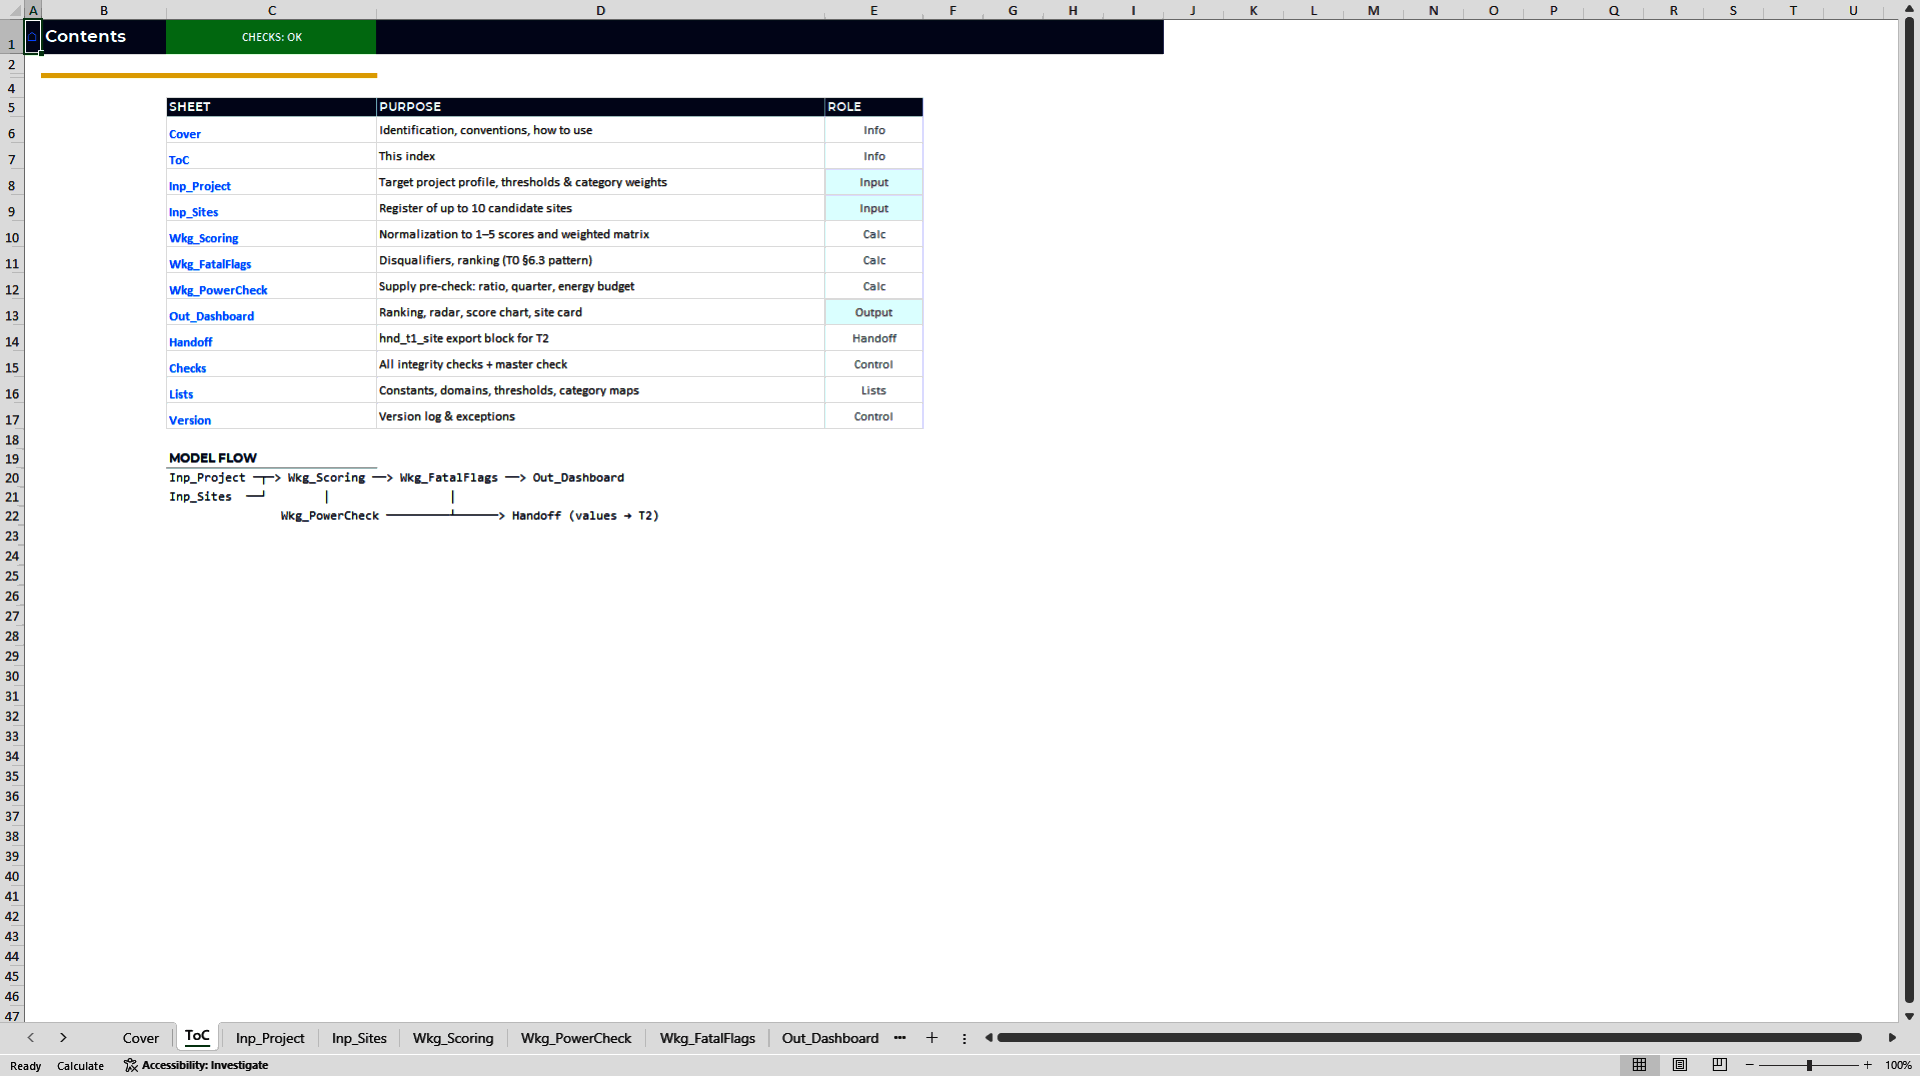
The workbooks are not linked by external formulas. Each one ends in a Handoff sheet whose values are pasted into the next model together with a header stating origin, run date, currency, scenario and check status. Every handoff is a timestamped photograph, so a later edit in an upstream file cannot silently change a decision already taken. Chain checks in the receiving workbook verify the photograph before work continues.
WHAT YOU RECEIVE
Five Excel workbooks (T1 to T5), a Master Guide covering the operating model, staffing, source map, five decision gates and a one-hour walkthrough, and five dedicated user manuals, one per template, each following the same ten-chapter structure. All files are built under the FAST Standard, Flexible, Appropriate, Structured and Transparent, with zero macros, no hidden logic, one formula per calculation row, colour-coded input, calculation and link cells, a documented Source and Status behind every input, and a checks panel with a master light that must read green before any handoff exists. Benchmarks reference published industry data. A complete worked demo case ships loaded in all five files so you can learn the chain before touching your own data.
WHO IT IS FOR
Development leads and sponsors, power and energy analysts, MEP and cost engineers, financial modelers, advisors underwriting digital infrastructure, and investment committee secretaries who need the decision documented rather than asserted.
WHAT IT IS NOT
This is an underwriting and decision toolkit, not a substitute for due diligence. It does not replace formal interconnection studies, detailed electrical engineering, IFC design, EPC or GMP budgets, independent valuations, real term sheets or a credit process. It does not find land, verify zoning, confirm utility capacity, run hourly grid simulations, perform MEP design, produce a detailed BOQ, or contain a full corporate tax model. It narrows, ranks, stress-tests and documents; the signature stays human.
Got a question about the product? Email us at support@flevy.com or ask the author directly by using the "Ask the Author a Question" form. If you cannot view the preview above this document description, go here to view the large preview instead.
Source: Best Practices in Project Finance, Integrated Financial Model Excel: Data Center Project Finance Suite (5 Models + 6 Manuals) Excel (XLSX) Spreadsheet, ExpertPro Consulting
ABOUT THE AUTHOR

ExpertPro is an advisory firm that builds the financial and decision infrastructure behind capital projects. Our work sits at the intersection of project finance, engineering economics and data: we model, stress-test and document infrastructure investments so that sponsors, lenders and investment committees can decide on evidence rather than intuition.
The practice is led by Eduard Kofman, .
... [read more]
Ask the Author a Question
You must be logged in to contact the author.




























